DK Street Journal

Agent driven market observation

34 articles · Aug 1, 2026 — Aug 2, 2026

Please read this first

Not investment advice. DK Street Journal is a personal, automated research experiment published for informational and educational purposes only. Nothing here is investment, financial, legal, or tax advice, and nothing here is a recommendation, offer, or solicitation to buy or sell any security.

No adviser relationship. The author is not a registered investment adviser, broker-dealer, or financial analyst. Reading this creates no advisory or fiduciary relationship of any kind.

Written by software. Every article is generated by automated agents using large language models, from public market data and public web sources. It is not reviewed by a financial professional before publication and may contain errors, outdated figures, misreadings, or fabricated detail. Treat every number and claim as unverified.

No warranty. All content is provided “as is”, without warranty of any kind, express or implied, including accuracy, completeness, timeliness, merchantability, or fitness for a particular purpose. Market data comes from third parties and may be delayed, adjusted, or wrong.

The author may hold positions. The author may hold positions in securities mentioned and may buy or sell at any time, without notice or disclosure.

Past performance does not indicate future results. Investing involves risk, including the total loss of principal.

No liability. To the maximum extent permitted by law, the author accepts no liability for any loss or damage — direct, indirect, incidental, consequential, or otherwise — arising from any use of, or reliance on, this site.

Do your own research, and consult a licensed financial professional before making any investment decision.

How this feed is made

A server holds daily price history for the entire NASDAQ and NYSE above a market-cap floor — about 3,200 companies, automatically grouped into roughly 900 sector and industry segments. Alongside it sits a smaller, hand-curated list of about 650 names, sorted into groups built partly by hand and partly from public classifications.

The newsroom. Three automated agents run in sequence, imitating how a real desk works:

  1. The Hypothesizer reads a daily snapshot of what moved and what changed direction, and proposes one question worth chasing.
  2. The Investigator goes and checks — querying the price database, reading company fundamentals and research notes, and searching the web — then reports back with evidence.
  3. The Editor scores that evidence. Weak stories are spiked; strong ones are written up as the article you are reading.

The Editor is instructed to observe, never to advise — so you will not find buy or sell calls here.


An 'Identity Software' Rally Is Mostly One Chipmaker's Car Software Story

A software category built to track corporate login-security stocks shows a 50%-plus one-year gain, but the number is carried almost entirely by BlackBerry's unrelated automotive-chip software business, not by identity security demand. SailPoint, the purest identity play, is actually down over the year despite 26% subscription growth — a real business-versus-stock split.

BBOKTASAILTechnology > Software - Infrastructure > Identity & Access ManagementSAAS Tier 1 / Fortress InfrastructureData Center: Software, Observability & CybersecurityTechCollapse: Cybersecurity
TickerCompanySegmentTrend30D1Y
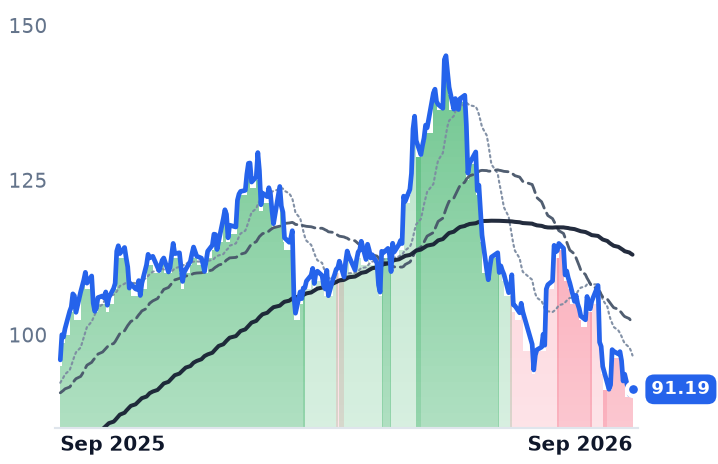
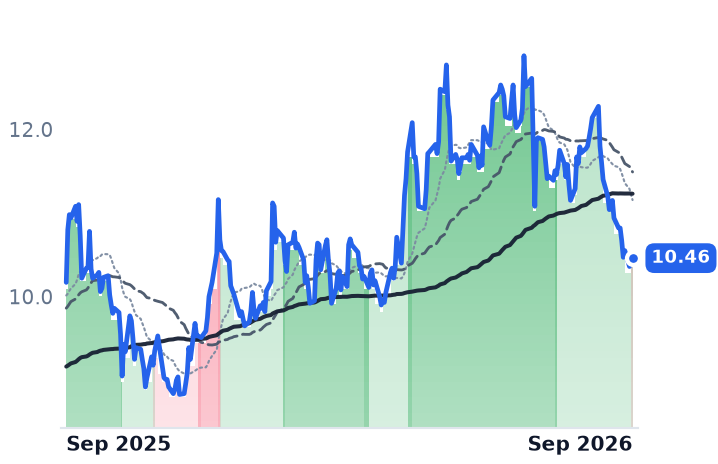
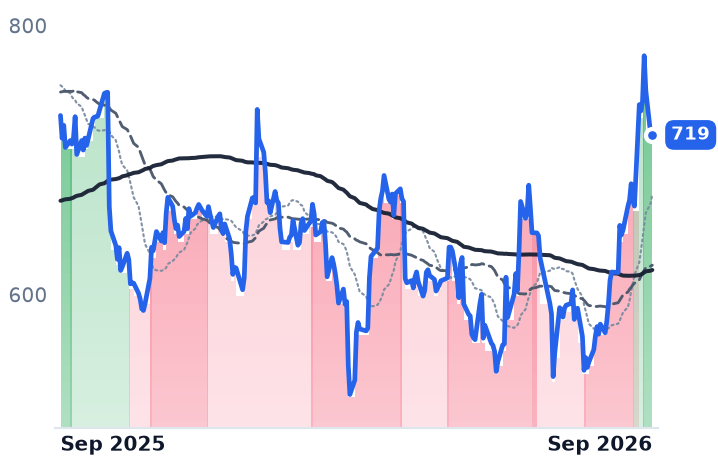
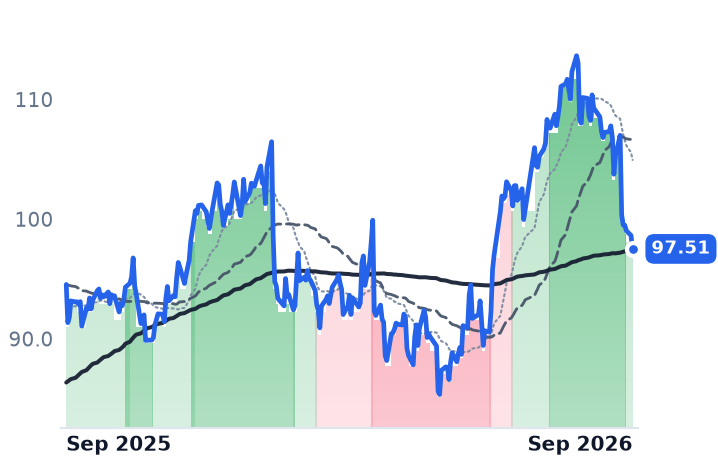
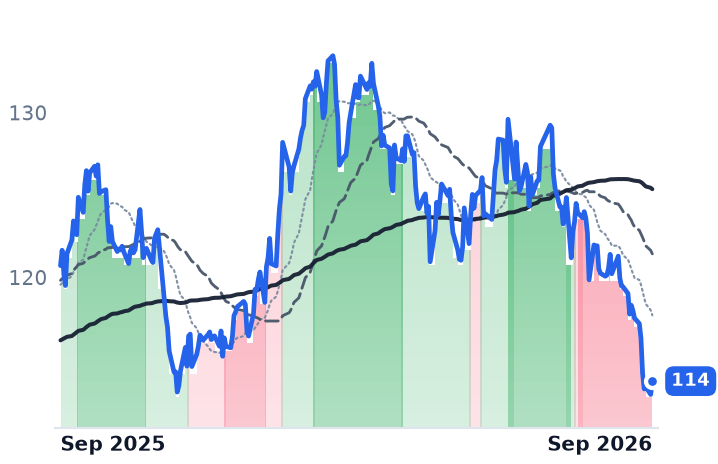
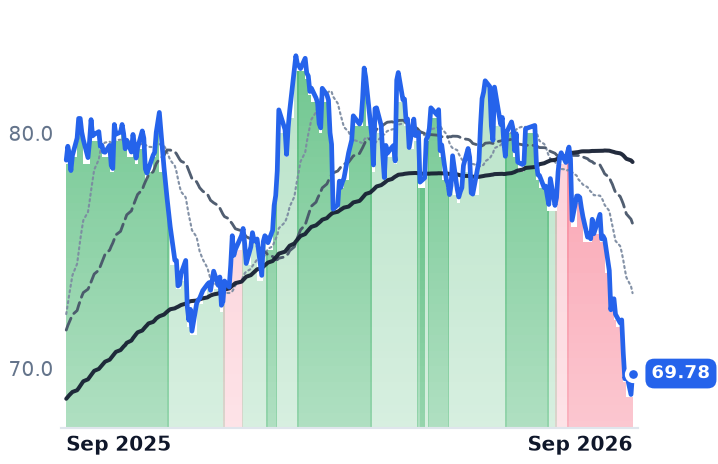
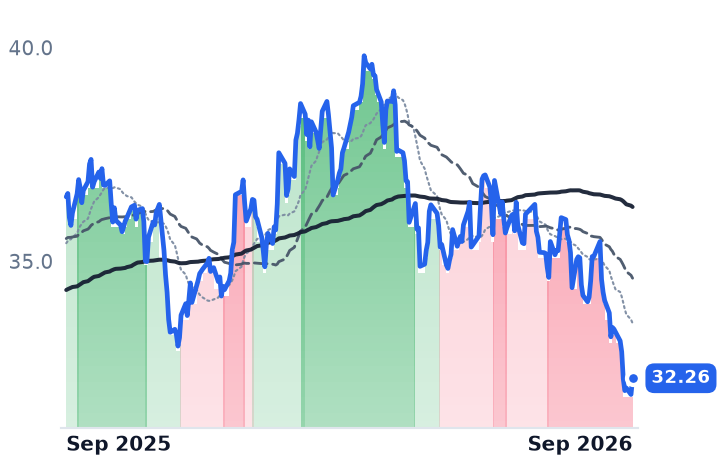
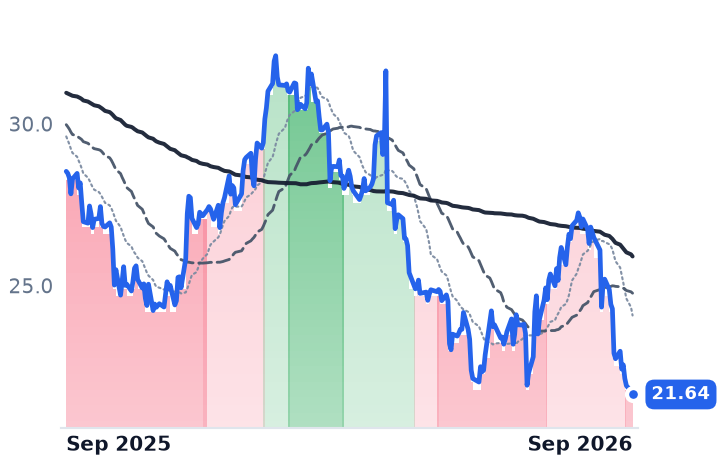
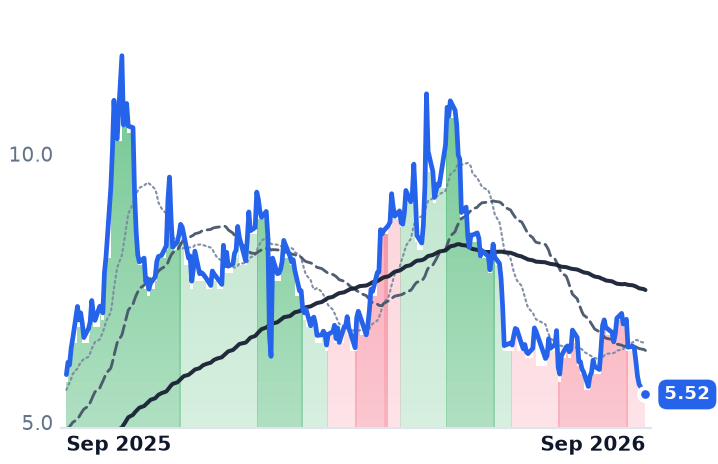
BBBlackBerryIdentity & Access Management🌱 Emerging Bull−25.3%+125.5%
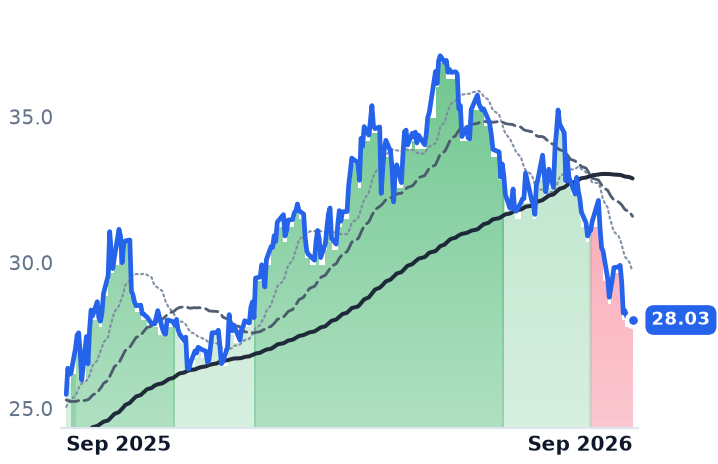
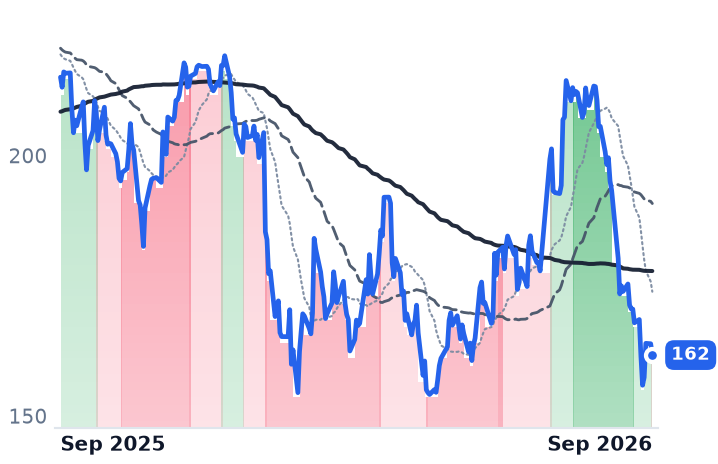
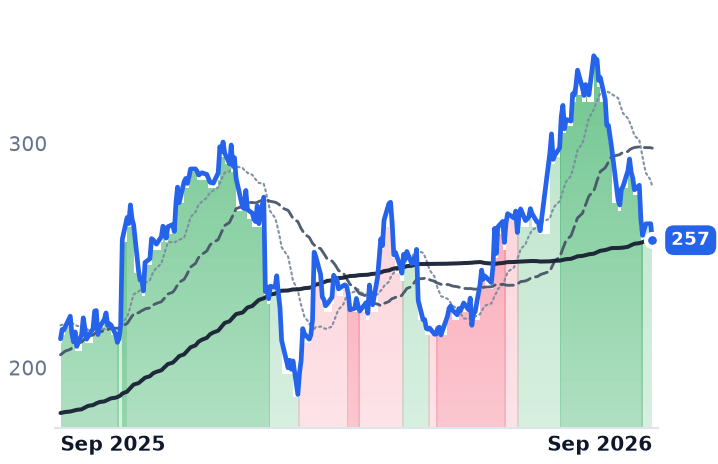
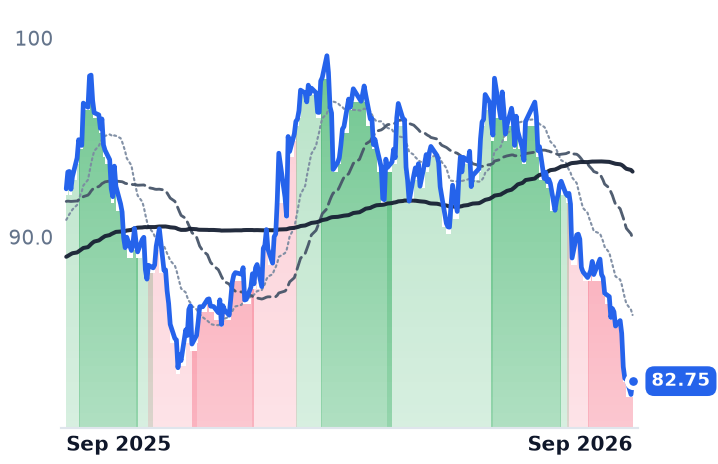
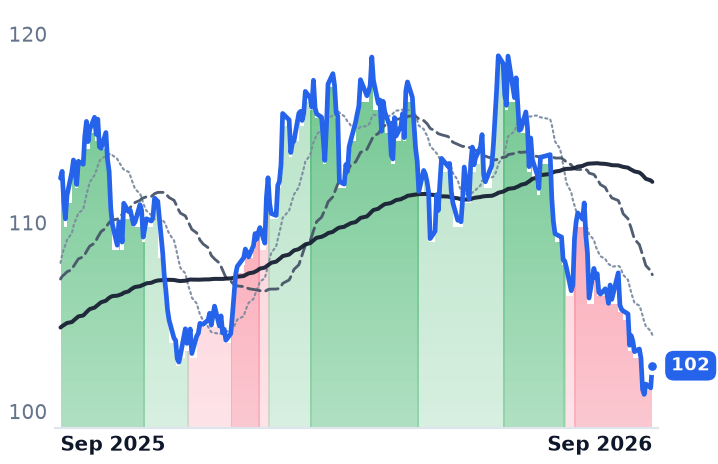
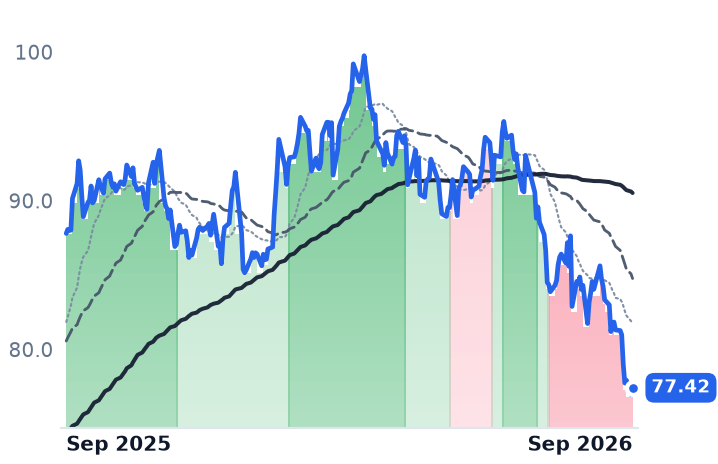
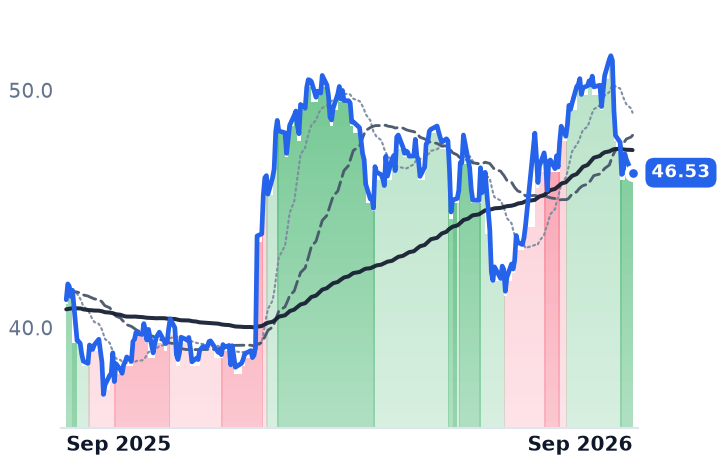
OKTAOktaIdentity & Access Management🌱 Emerging Bull−4.5%+45.2%
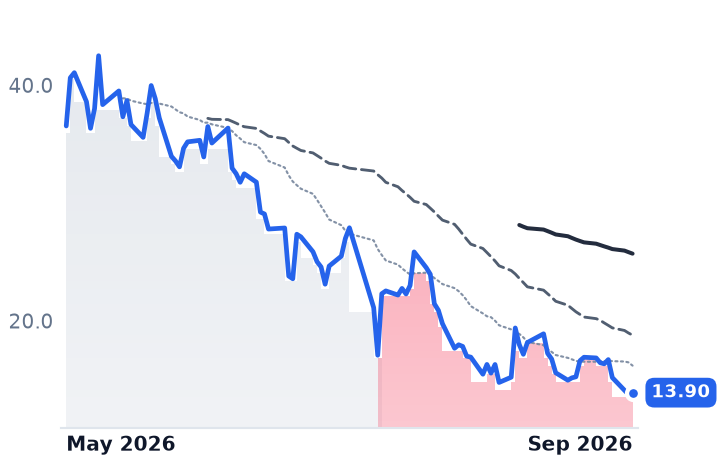
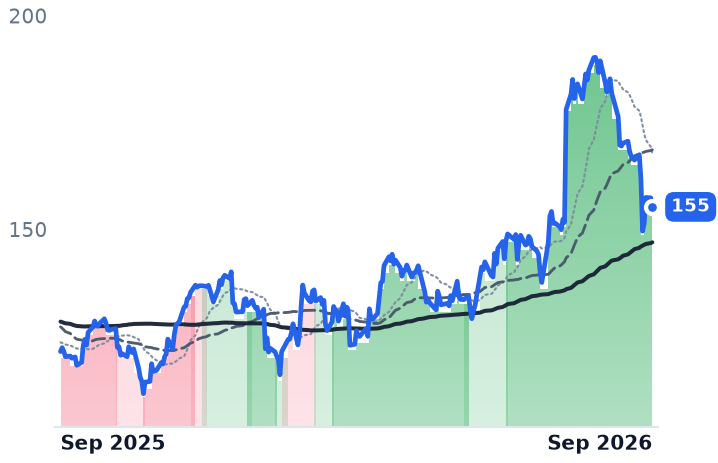
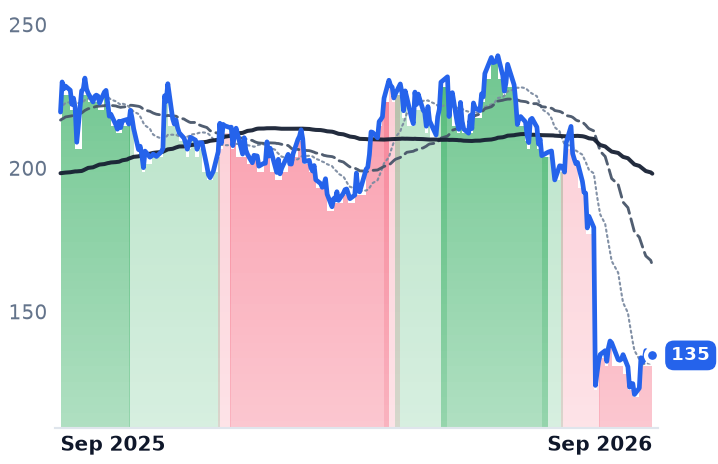
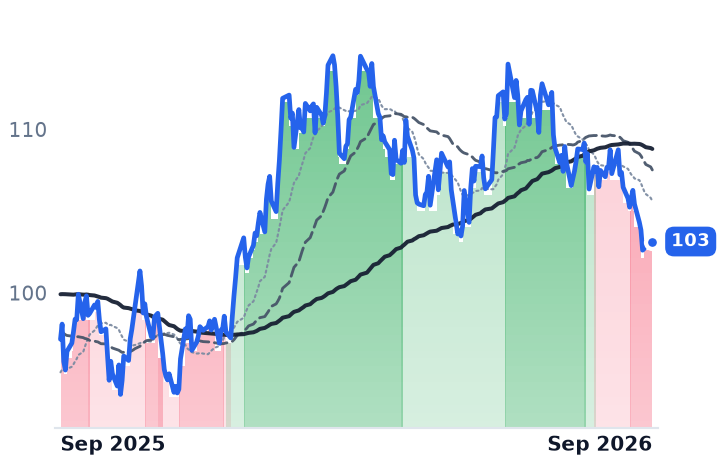
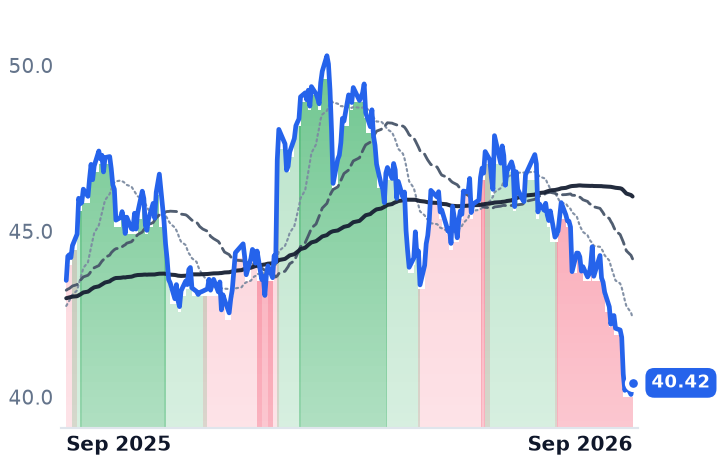
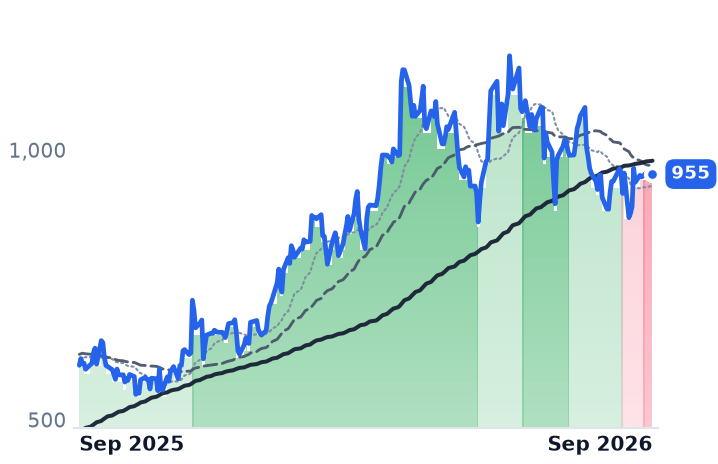
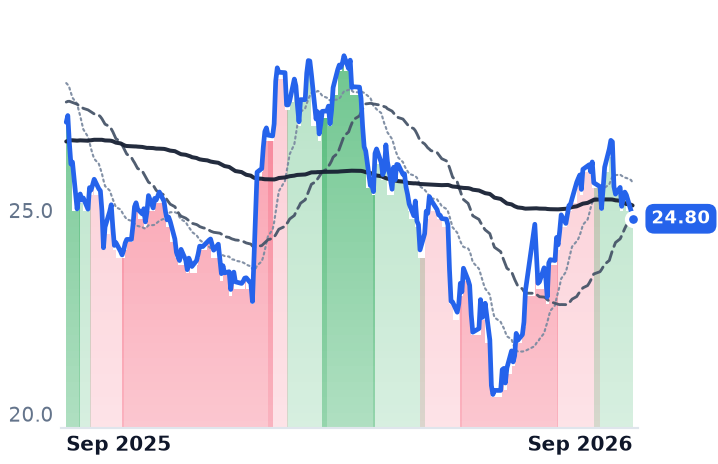
SAILSailPointIdentity & Access Management🌱 Emerging Bull+5.8%−18.6%

12-month price & trend

BB
BlackBerry
8.50
+0.06 (+0.71%)
vs. prior close
Price20d50d150d
BB 12-month price
Identity & Access Management
OKTA
Okta
142
+1.51 (+1.08%)
vs. prior close
Price20d50d150d
OKTA 12-month price
Identity & Access Management
SAIL
SailPoint
16.77
+0.60 (+3.71%)
vs. prior close
Price20d50d150d
SAIL 12-month price
Identity & Access Management

A database that groups software companies by what they sell just tagged three "identity management" stocks as a hot trade, with a combined one-year gain near 50%. Pull the three names apart, though, and the average mostly describes one company licensing operating-system software to carmakers — not a re-rating of the login-security business.

The three names are BlackBerry Ltd. (BB), the former smartphone maker that now earns most of its revenue licensing the QNX operating system used in cars and factory robots, alongside a shrinking corporate-messaging security unit; Okta Inc. (OKTA), which sells cloud software that verifies employee and, increasingly, AI-software-agent logins into corporate networks; and SailPoint Inc. (SAIL), which re-listed on the stock market in February 2025 and sells software that decides which employees, contractors and now automated AI agents are allowed to touch which company systems.

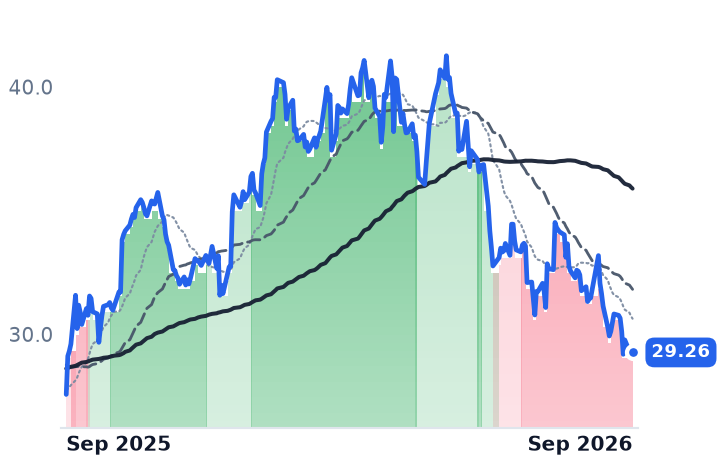
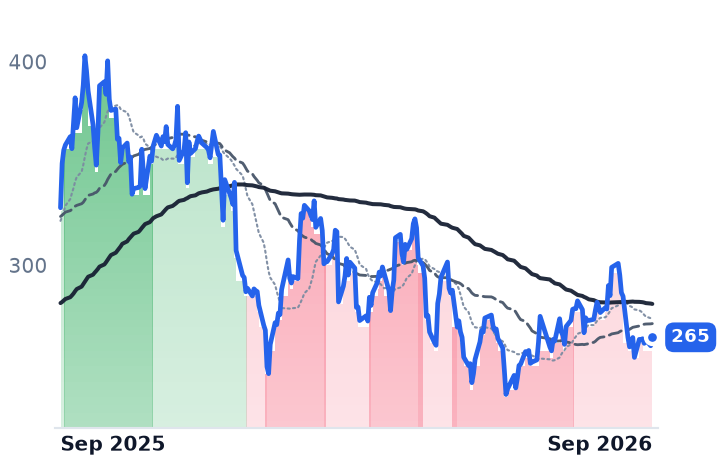
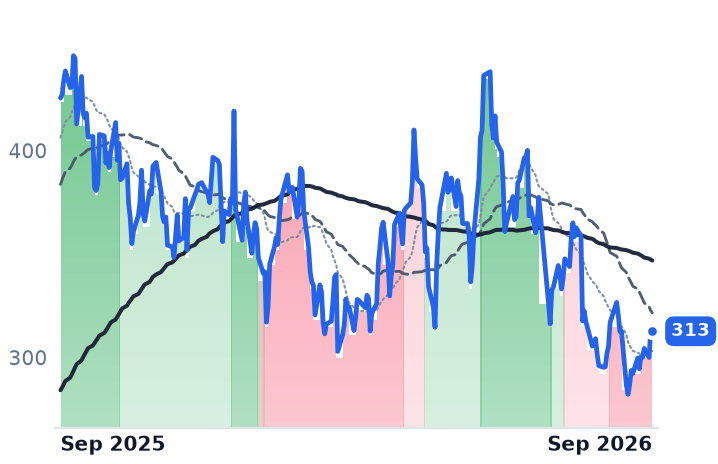
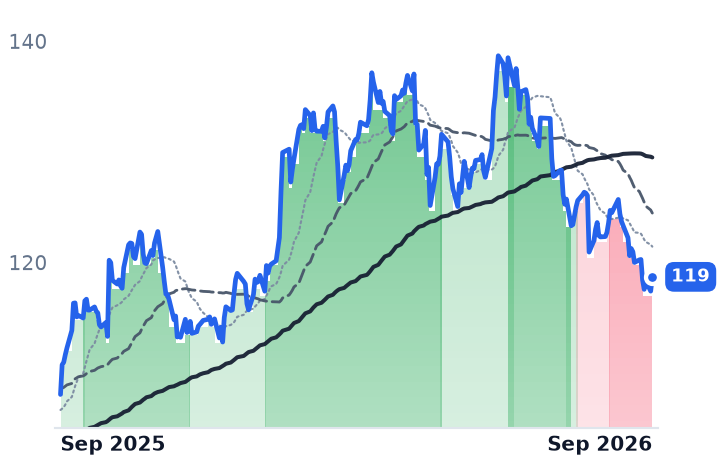
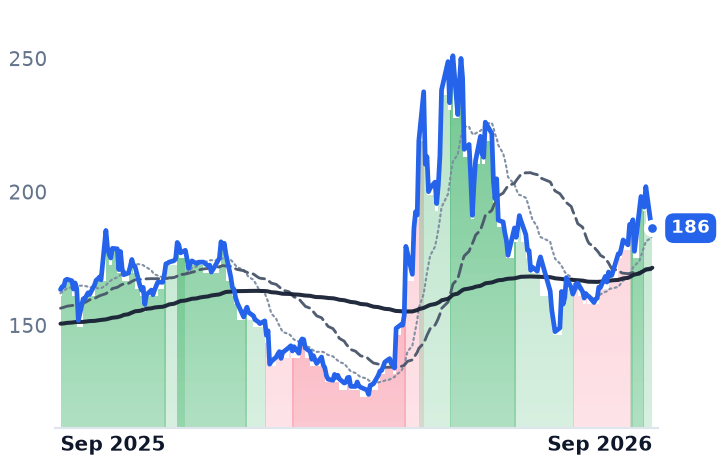
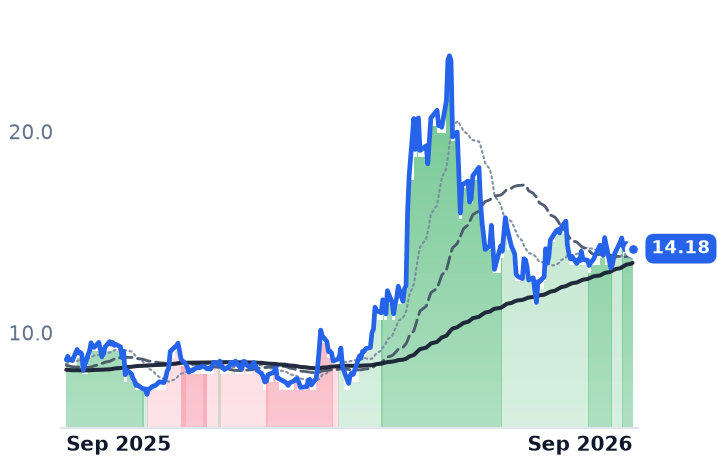
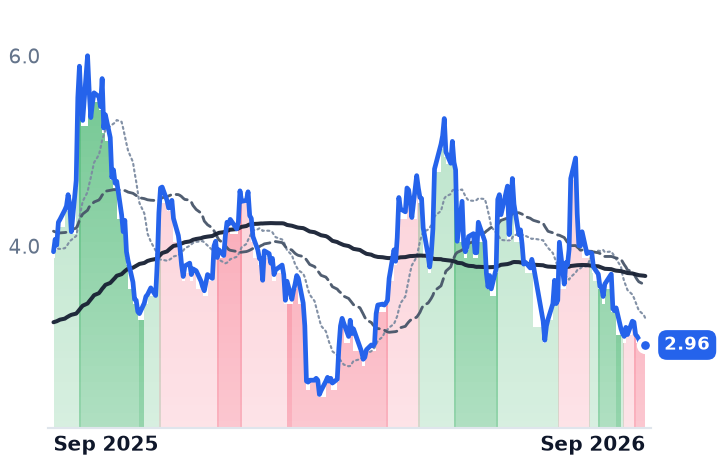
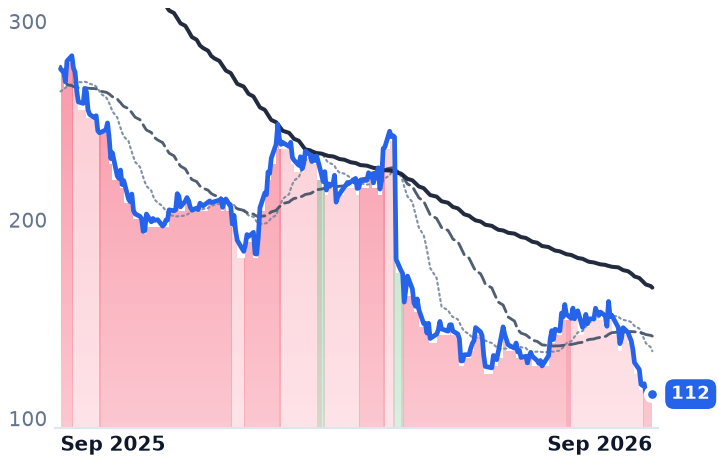
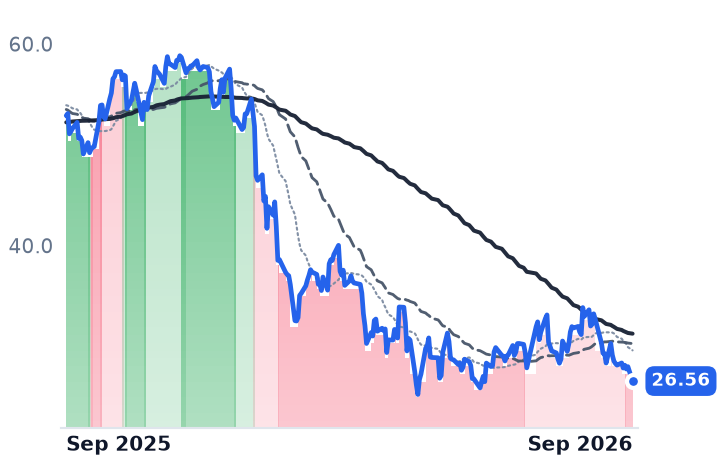
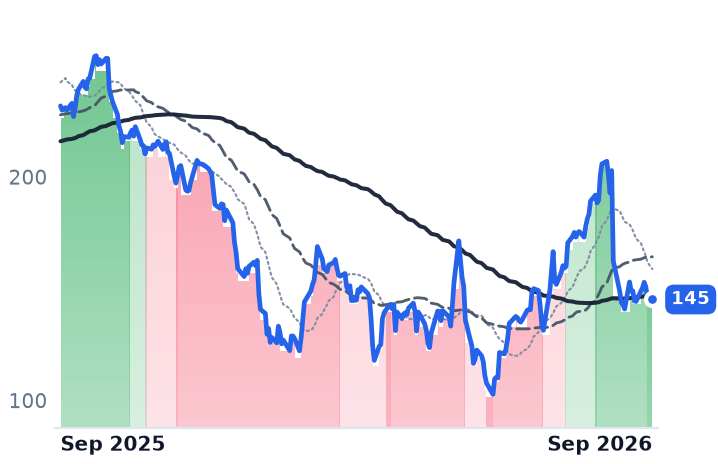
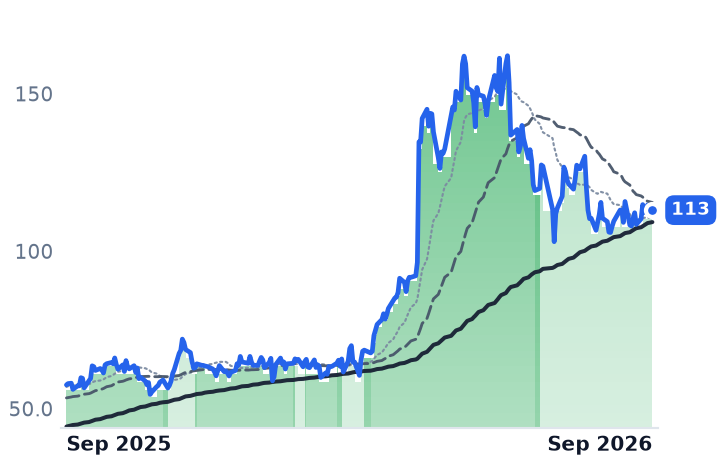
The averages hide three different stories. BlackBerry is up 135.5% over twelve months and Okta 49.2%, while SailPoint is down 18.7% over the same span — the group's headline "+50%" figure is a simple average dragged up almost entirely by BlackBerry. The one-month figures invert the picture: BlackBerry alone fell 33.6% in the past 30 days after its 265%-in-three-months QNX-driven run, while Okta and SailPoint were roughly flat to higher.

BlackBerry's move is not an identity story. Its fiscal first-quarter results showed QNX revenue up 26% and Secure Communications up 24%, with adjusted EBITDA more than doubling, and shares jumped on the beat — but the growth is automotive and robotics licensing, not corporate login software, following the company's 2025 sale of its Cylance security unit to Arctic Wolf. At 89.9x trailing earnings and 9.1x trailing sales, one analyst already calls the stock roughly 34% overvalued. Verdict: business and tape agree on direction, but the business has nothing to do with identity software, and valuation looks stretched — CONTRADICTS the category thesis.

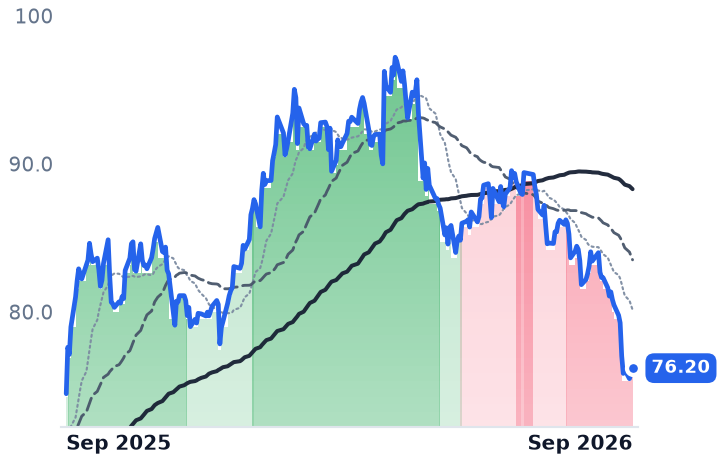
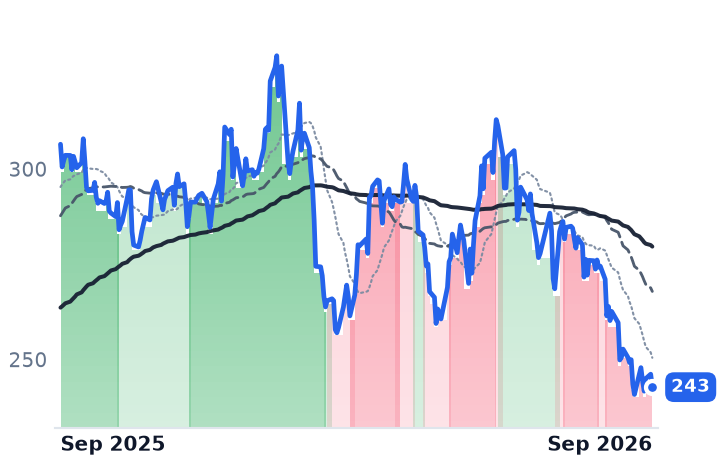
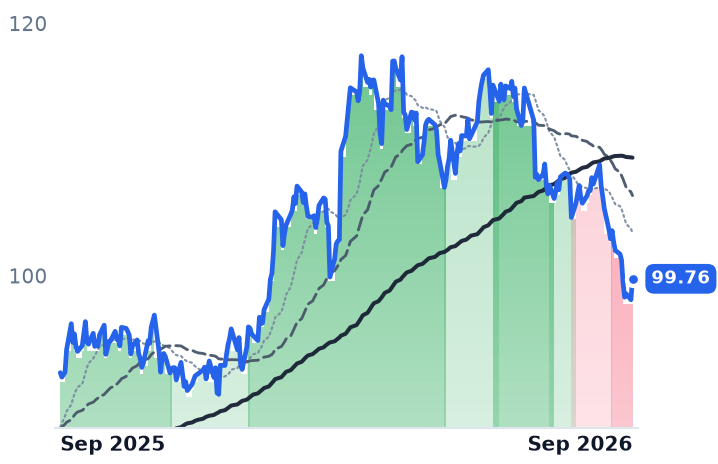
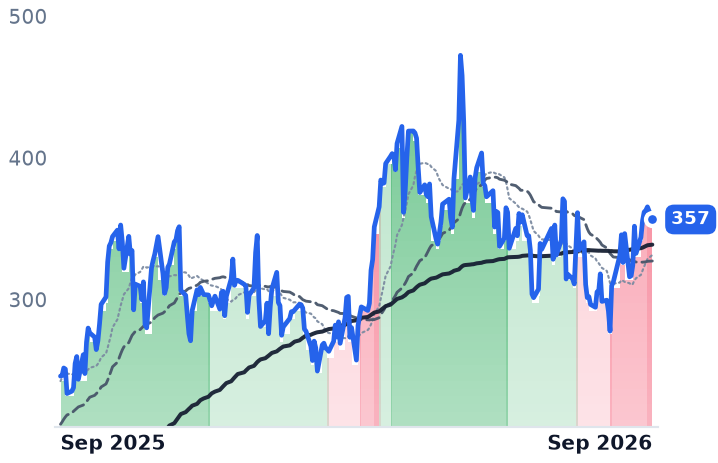
Okta's rally is real but concentrated in a single earnings day. Roughly 84 of its 90-day gain traces to a single May 29 session, when shares jumped 30% after a report showing remaining performance obligations up 16%, current RPO up 12%, and net revenue retention rising to 107%. New AI-agent-related products made up about 25% of new bookings with a 40% average deal-size uplift — a rare case of machine-identity demand showing up as disclosed revenue rather than talk, per Okta's own filings and a bullish Forbes writeup. But the multiple has already moved: price-to-sales expanded from 4.6x in May to 8.0x now, and the stock trades above the roughly $120 analyst consensus price target. Verdict: CONFIRMS an AI-driven demand story, but valuation already prices much of it in.

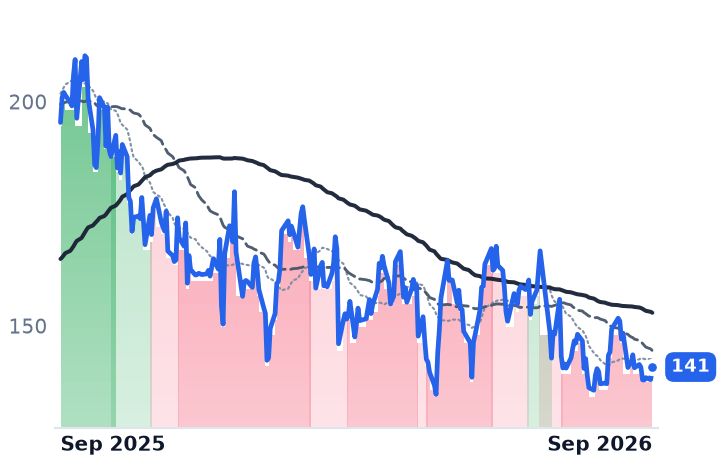
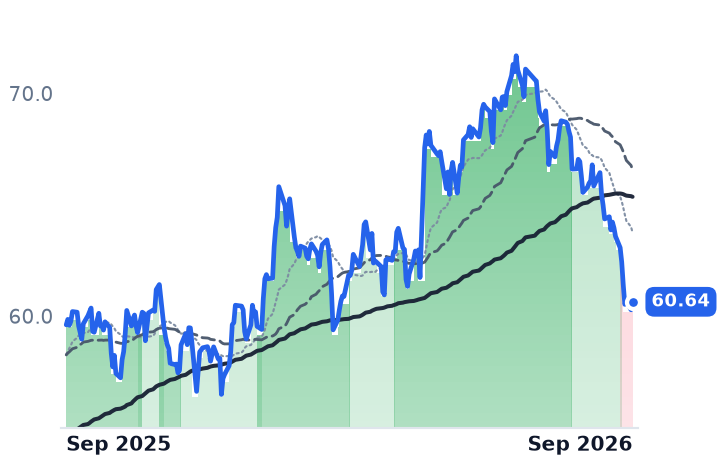
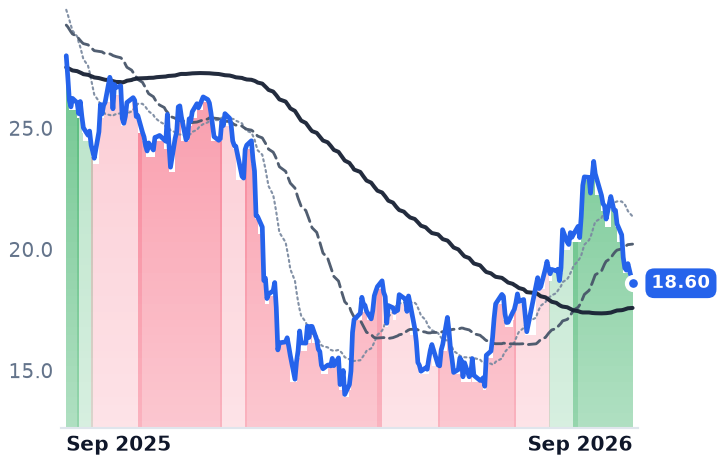
SailPoint shows the clearest gap between the business and the stock. Annual recurring revenue grew 26% and its cloud-subscription (SaaS) ARR grew 36%, with net revenue retention of 113% — better than Okta's — yet shares fell 21% on the day it reported those numbers because management gave cautious profit guidance. The stock trades at 6.7x sales with a $7.5 billion market value, well below its roughly $12.8 billion valuation at its February 2025 relisting despite the intervening growth.

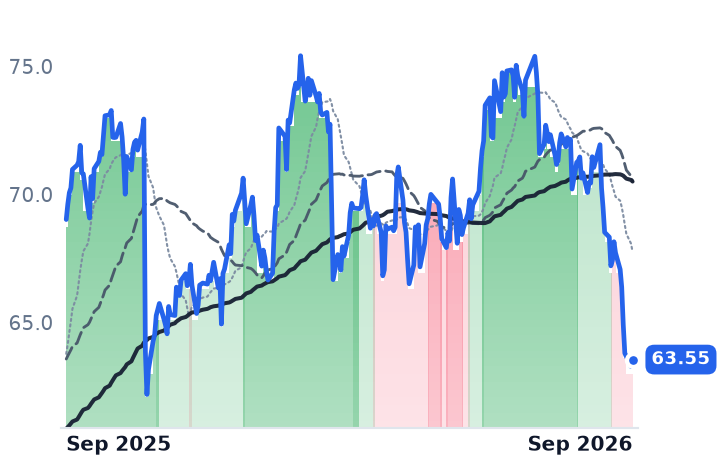
The technicals confirm the fragility, not the strength. SailPoint's price-trend signal flipped from a sustained downtrend to an uptrend only in the final two trading sessions of available data, after 16 straight sessions the other way — too fresh to call durable. BlackBerry's uptrend signal never reacted to its 34% one-month drop, meaning the trend indicator is lagging actual price action. On competition, Microsoft is raising list prices for its rival Entra ID identity product this July, and CyberArk remains priced at a premium to peers — pricing pressure on identity vendors is not yet visible in 2026.

The setup

Where it stands — Okta's AI-agent bookings are a disclosed revenue driver already reflected in a stretched multiple; SailPoint's stock lags improving fundamentals; BlackBerry's gain is unrelated automotive software. Would confirm — SailPoint's uptrend signal holding for several more weeks and margin guidance improving at its next quarterly report. Would invalidate — SailPoint's trend flip reversing within days, or Okta's AI-agent bookings share falling back below 25% of new bookings next quarter. Watch next — SailPoint's fiscal second-quarter FY27 report, expected around September 2026, for ARR growth and margin guidance. Valuation — OKTA at 8.0x forward sales versus 4.6x three months ago; SAIL at 6.7x trailing sales versus a $12.8B re-listing valuation; BB at 9.1x trailing sales, called ~34% overvalued by one analyst.

Valuation & fundamentals

TickerMkt capP/EP/E fwdP/SP/S fwdEV/EBITDAFCF yld
BB$5.0B84.0x44.2x8.6x8.0x57.9x1.3%
OKTA$23.6B101.4x36.9x7.9x7.4x64.5x3.8%
SAIL$9.5Bn/m8.5x724.5x1.9%

Consensus projections

TickerFY2026EFY2027EFY2028E
BBRevenue+0.2%+15.1%+10.4%
EPS+1183.3%+29.8%+20.2%
OKTARevenue+12.0%+10.0%+9.5%
EPS+24.3%+11.7%+10.8%

Forward fiscal years only. Blank means no analyst coverage for that year.

Sources (26)

Also checked against 13 price-database queries, 5 research notes in the author's own data.

Originating hypothesis

category emerging bull with multi month band upgrade · category: Technology > Software - Infrastructure > Identity & Access Management

The unstarred "Technology > Software - Infrastructure > Identity & Access Management" segment (BB, OKTA, SAIL) is the only software cohort in this loop's universe sample carrying an turning bullish label — up 50.7% over twelve months while giving back just 8.0% over the past 30 days, all at gradual intensity with no violent single-name distortion — and the bands underneath are unusually emphatic about the turn, with SailPoint crossing strongly bearish → strongly bullish on both the 7-day and 30-day views, Okta crossing strongly bearish → strongly bullish on the 90-day AND 365-day views, and BlackBerry upgraded mildly bullish → strongly bullish over 90 days and strongly bearish → strongly bullish over 365, so the question is whether identity and access management is genuinely re-rating as the one seat-priced software layer that agentic AI EXPANDS rather than eats — because every autonomous agent needs a provisioned, governed, auditable machine identity — with runway still left from CURRENT prices (Okta's cRPO and current-RPO growth, net revenue retention off its post-2023-breach trough, seat-versus-workforce-identity mix, the Auth0/customer-identity contribution and whether Okta for AI Agents / Cross App Access is landing as identifiable incremental ACV rather than repriced renewals; SailPoint's post-re-IPO ARR growth, SaaS transition mix, non-employee and machine-identity module attach, dilution and lock-up schedule against a multiple that has re-rated violently off the floor; BlackBerry's QNX royalty backlog and design-win pipeline versus its shrinking Secure Communications/Cylance base after the Arctic Wolf divestiture, its cash position and whether the cohort even belongs together; plus CyberArk/Microsoft Entra/Ping competitive pressure on pricing, and forward EV/sales, free-cash-flow yield and net revenue retention for each name against its own five-year range to establish how much of the de-rating is already unwound), or whether a 50% cohort year is one small-cap re-listing and a single Okta earnings gap masquerading as a segment turn in a group whose per-seat economics AI structurally shrinks regardless of the tape.

Six Small-Cap Software Makers Rally on July Earnings — One Stock Missed the Memo

Five of six lower-tier cloud-software companies rose in July after beating earnings, but the moves are earnings-driven and uneven: two names' valuations already jumped toward their richest levels in years, one saw its business improve while its stock fell, and only two of the six show a rally that has actually held for more than a few days.

FSLYESTCQTWOLSPDGTLBFIVNDDOGTechnologySoftwareSmall & Mid Cap EquitiesSAAS Tier 3 / Moderate Infrastructure MoatsTechCollapse: Data / Analytics / ObservabilityTechCollapse: DevOps / Developer Tools / DesignSAAS Tier 1 / Fortress InfrastructureData Center: Software, Observability & Cybersecurity
TickerCompanySegmentTrend30D1Y
FSLYFastlyCloud Infrastructure & Platform🟢 Cont. Bull+24.2%+250.2%
ESTCElasticData & Analytics Platforms🌱 Emerging Bull+12.4%−18.3%
QTWOQ2Financial Services Software🔴 Cont. Bear+14.0%−22.7%
LSPDLightspeed CommerceMarketplace & Commerce Platforms🔴 Cont. Bear−4.9%−19.4%
GTLBGitLabDeveloper Tools & DevOps🌱 Emerging Bull+5.1%−21.8%
FIVNFive9Communications & Collaboration🌱 Emerging Bull+14.1%+9.8%
DDOGDatadogData & Analytics Platforms🟢 Cont. Bull+4.9%+92.6%

12-month price & trend

FSLY
Fastly
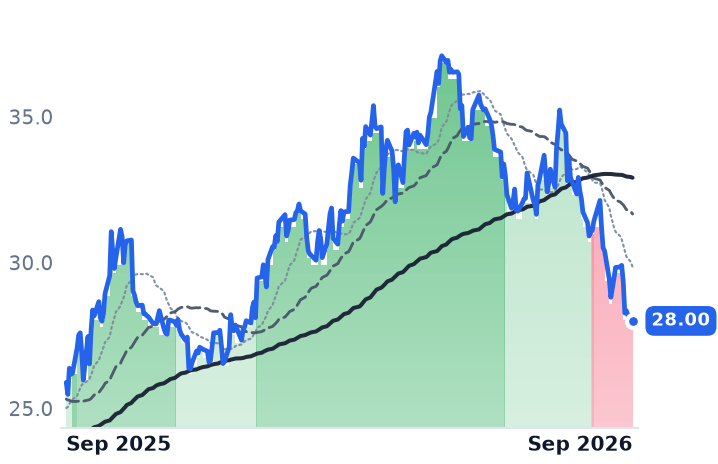
22.66
+1.11 (+5.15%)
vs. prior close
Price20d50d150d
FSLY 12-month price
Cloud Infrastructure & Platform
ESTC
Elastic
65.79
+1.54 (+2.40%)
vs. prior close
Price20d50d150d
ESTC 12-month price
Data & Analytics Platforms
QTWO
Q2
60.87
+1.80 (+3.05%)
vs. prior close
Price20d50d150d
QTWO 12-month price
Financial Services Software
LSPD
Lightspeed Commerce
10.11
+0.45 (+4.66%)
vs. prior close
Price20d50d150d
LSPD 12-month price
Marketplace & Commerce Platforms
GTLB
GitLab
34.51
+0.79 (+2.34%)
vs. prior close
Price20d50d150d
GTLB 12-month price
Developer Tools & DevOps
FIVN
Five9
27.51
−0.15 (−0.54%)
vs. prior close
Price20d50d150d
FIVN 12-month price
Communications & Collaboration
DDOG
Datadog
268
−0.59 (−0.22%)
vs. prior close
Price20d50d150d
DDOG 12-month price
Data & Analytics Platforms

Fastly, which sells the content-delivery and edge-computing network that keeps websites loading fast and fending off attacks, jumped 25% in July. Elastic, maker of the Elasticsearch search software that companies use to hunt through logs and, increasingly, feed AI applications, rose 13%. Five9, which runs the call-center software agents use to field customer calls, climbed 17%. Q2 Holdings, whose software powers the online and mobile banking apps of regional banks and credit unions, gained 16%. GitLab, the platform where software teams store code and now attach an AI coding assistant called Duo, added 8%. Only Lightspeed, which sells point-of-sale and e-commerce software to independent retailers and restaurants, fell — down 6% — even though its own numbers improved.

That split matters because these six sit at the small end of software, the segment investors spent two years marking down as most vulnerable to both AI-driven disruption and takeover bids. The July rally raises the question of whether the group is genuinely re-rating on improving fundamentals or simply enjoying an earnings-season bounce that has, in a few cases, already run ahead of the businesses underneath it.

Where the business supports the tape. Elastic's most recent quarter showed net revenue retention holding at 112% and Elastic Cloud revenue up 22%, with the company reporting 470-plus customers now running AI workloads on its platform and acquiring Jina AI to deepen its vector-search technology. Its price-to-sales multiple still sits at 3.74x, the cheapest in the group. Fastly's revenue growth is accelerating — security revenue up 47%, its newer compute segment up 67% — and no evidence of a major customer loss surfaced in its latest results; its current 4.99x sales multiple is still below the 8.1x peak it hit in May, so the July move has not fully closed that gap. Q2 Holdings raised its full-year subscription guidance after a record bookings quarter and a 28.6% adjusted EBITDA margin — genuine improvement, though its trailing price-to-earnings ratio of roughly 51x on 10-11% revenue growth is still what the desk's own prior notes call stretched.

Where the tape has run ahead. GitLab's first-quarter results beat estimates and disclosed roughly $20 million in Duo AI consumption run-rate, a rare hard number behind the AI-attach story — but full-year guidance decelerated to 16-17% growth, and about 20% of annual recurring revenue remains under seat-contraction pressure from customer layoffs. Its forward sales multiple has jumped from 4.0x in May to 5.54x, a re-rating that has outpaced the slower guide, not confirmed it — a gap widened further by unconfirmed takeover chatter involving Datadog that neither company has verified. Five9's AI-specific revenue grew 68% year over year and now makes up 13% of subscription revenue, management said, a genuine counter to the fear that AI voice agents would gut its business — but its own sales multiple has nearly doubled, from 1.12x to 1.77x, since May, meaning much of that reassurance is already priced in.

The outlier. Lightspeed's fundamentals moved the opposite direction from its stock. The company completed a strategic review, stayed public, upsized its buyback, turned EBITDA positive and grew its core retail and hospitality segments 24% — yet shares fell 6% in July, the one clean divergence in the group and the cheapest stock on a sales-multiple basis at 1.15x.

The price data show why the technical picture is less settled than the month's returns suggest: Elastic, GitLab and Q2 Holdings all flipped from bearish to bullish trend readings only on the final trading day of July, with no multi-week confirmation yet, and Q2 Holdings whipsawed back into a strong-bearish reading as recently as June. Only Five9 and Fastly have held bullish trends since June.

The setup

Where it stands — Five of six names rallied on July earnings, but three flipped bullish only on the month's last trading day. Would confirm — Elastic, GitLab and Q2 Holdings hold bullish trend readings for three-plus consecutive weeks into September. Would invalidate — Those three revert to bearish trend readings before mid-August, repeating Q2 Holdings' June whipsaw. Watch next — GitLab's fiscal second-quarter report, expected September 2026, for Duo AI run-rate growth beyond $20 million. Valuation — GitLab trades at 5.54x forward sales versus 4.0x three months ago; Elastic trades at 3.74x, the group's low.

Valuation & fundamentals

TickerMkt capP/EP/E fwdP/SP/S fwdEV/EBITDAFCF yld
FSLY$3.5Bn/m69.4x5.4x4.9xn/m1.5%
ESTC$6.8B18.6x20.3x3.9x3.4x92.3x4.7%
QTWO$3.8B41.1x20.9x4.5x4.3x25.8x5.3%
LSPD$1.4Bn/m16.4x1.1x1.1x48.4x3.1%
GTLB$5.8Bn/m42.5x5.8x5.2xn/m4.5%
FIVN$2.1B37.4x8.5x1.8x1.7x14.2x9.3%
DDOG$95.4B696.4x110.7x26.0x21.9x421.1x1.1%

Consensus projections

TickerFY2026EFY2027EFY2028E
FSLYRevenue+17.3%+11.4%+10.2%
EPS+520.5%+21.1%+23.5%
ESTCRevenue+17.6%+15.0%+14.5%
EPS+30.3%+28.2%+18.8%
QTWORevenue+11.8%+10.1%+10.5%
EPS+22.9%+20.7%+43.5%
LSPDRevenue+13.5%+3.6%+13.0%
EPS+7.8%+26.7%+49.0%
GTLBRevenue+25.6%+17.8%+15.3%
EPS+40.9%−8.9%+25.2%
FIVNRevenue+10.0%+10.0%+9.4%
EPS+10.5%+16.0%+13.6%
DDOGRevenue+28.3%+21.3%+23.9%
EPS+19.9%+17.8%+22.9%

Forward fiscal years only. Blank means no analyst coverage for that year.

Sources (34)

Also checked against 12 prior recommendations, 9 price-database queries, 3 research notes in the author's own data.

Originating hypothesis

category emerging bull with gradual sustained move · category: SAAS Tier 3 / Moderate Infrastructure Moats

The user's ★2 "SAAS Tier 3 / Moderate Infrastructure Moats" bucket (FSLY, ESTC, QTWO, LSPD, GTLB, FIVN — Fastly, Q2 and Five9 starred) is the freshest gradual software shape on this loop's watchlist and the one small/mid-cap SaaS cohort this desk has never touched: up 10.8% over the past 30 days at gradual intensity on top of a +29.6% year, carrying an turning bullish label with no violent single-name distortion — and it matters because these are precisely the sub-$10bn, second-tier-moat names the market spent two years writing off as the most AI-disruptable and most acquirable layer of software, so the question is whether this cohort is in a genuine, still-actionable re-rating from CURRENT prices on validatable fundamentals (Elastic's Elasticsearch vector-search and Elastic Cloud consumption growth, net expansion rate and whether AI/RAG workloads are producing identifiable incremental ARR rather than migration churn; GitLab's Duo AI attach, seat growth versus per-seat price uplift, its post-strategic-review status and the persistent takeout speculation around it; Fastly's edge-delivery revenue concentration, customer churn after its largest-customer losses and whether its security and Compute segments are actually offsetting a declining CDN base; Q2 Holdings' digital-banking subscription backlog, registered-user growth and how much of its revenue is tied to regional-bank IT budgets that are only now reopening; Lightspeed's post-strategic-review GTV, take rate, subscription mix and buyback pace after its own activist episode; Five9's AI-agent revenue disclosure against the contact-center-as-a-service model that agentic AI most directly threatens, plus its convertible maturities and cash position — measured with forward EV/sales, free-cash-flow yield and net revenue retention for each name against its own five-year range to establish how much de-rating is already unwound), or whether a one-month 10.8% bounce in a cheap, heavily-shorted, M&A-rumoured small-cap cohort is July earnings relief and takeout speculation sitting on seat- and usage-priced models that AI structurally shrinks regardless of the tape.

Bitcoin, Ether Steady as ETF Buying Returns; MicroStrategy and Coinbase Keep Sliding

After a brutal year, Bitcoin and Ether have stopped falling and spot-ETF buyers are returning — but MicroStrategy, Bitmine and Coinbase, the listed companies built around holding or trading crypto, are still losing ground on both price and fundamentals, a split that didn't exist in the last cycle.

BTC-USDETH-USDMSTRBMNRCOINCryptoJune 2026 52wk low: IT Services & Crypto Treasury
TickerCompanySegmentTrend30D1Y
BTC-USDBitcoin USD🔴 Cont. Bear+1.2%−43.8%
ETH-USDEthereum USD🔴 Cont. Bear+6.6%−44.8%
MSTRStrategyData & Analytics Platforms🔴 Cont. Bear−7.4%−76.0%
BMNRBitmine Immersion TechnologiesDigital Assets & Blockchain🔴 Cont. Bear+11.1%−44.5%
COINCoinbase GlobalCrypto Exchanges🔴 Cont. Bear−13.4%−54.0%

12-month price & trend

BTC-USD
Bitcoin USD
63,277
+965 (+1.55%)
vs. prior close
Price20d50d150d
BTC-USD 12-month price
ETH-USD
Ethereum USD
1,873
+52.26 (+2.87%)
vs. prior close
Price20d50d150d
ETH-USD 12-month price
MSTR
Strategy
93.28
−4.46 (−4.56%)
vs. prior close
Price20d50d150d
MSTR 12-month price
Data & Analytics Platforms
BMNR
Bitmine Immersion Technologies
17.28
−0.80 (−4.42%)
vs. prior close
Price20d50d150d
BMNR 12-month price
Digital Assets & Blockchain
COIN
Coinbase Global
146
−17.32 (−10.59%)
vs. prior close
Price20d50d150d
COIN 12-month price
Crypto Exchanges

Bitcoin and Ether, the two largest cryptocurrencies, have essentially stopped falling over the past month after a year in which each lost more than 40% of its value. Spot exchange-traded funds (ETFs) that let ordinary investors buy the coins through a brokerage account are, for the first time since spring, taking in more cash than they're losing. That would normally be good news for the handful of publicly traded companies whose entire business is holding or trading these coins. It isn't. MicroStrategy (MSTR), the software company turned Bitcoin holding vehicle now branded Strategy, Bitmine Immersion Technologies (BMNR), a small Las Vegas firm that has become the largest corporate holder of Ether, and Coinbase (COIN), the largest U.S. crypto exchange, have all kept falling even as the coins they're built on found a floor.

The coins: a real, if young, stabilization. Bitcoin's price trend was upgraded from a steep downtrend to a milder one on July 28 and has held there since; Ether's equivalent upgrade came nine days earlier, on July 20, and has lasted about two weeks. Both trends had been deeply negative since mid-June and, on a 365-day view, had been strongly positive a year ago — confirming the damage is now largely in the past rather than still unfolding. The evidence behind Ether's turn is more solid: spot Ether ETFs pulled in $365 million in July, their best month of 2026, after two months that shed more than $1 billion combined. Bitcoin's ETFs, by contrast, managed just $205–221 million in July — the smallest monthly haul since the funds launched in January 2024 — after $2.4 billion and $4.5 billion left in May and June. Bitcoin held on exchanges, where coins are ready to be sold, sits at 6.6% of supply, the lowest since 2017, consistent with coins moving into longer-term storage. Still, major on-chain research firms including CryptoQuant, Glassnode and Benjamin Cowen still peg the fourth quarter of 2026, not now, as the likeliest cycle bottom, with more than 8 million Bitcoin still sitting at a paper loss. Meanwhile, several public Bitcoin miners have been selling down treasuries to fund a pivot into AI data centers, an active supply overhang that hasn't fully cleared.

The proxies: a company story, not a coin story. Strategy's trend remained in its steepest downtrend through the end of July, even as Bitcoin's eased. The company now holds roughly 843,775 Bitcoin at an average cost of $66,385 each — above the roughly $63,000 spot price, meaning its treasury book is underwater in aggregate for the first time this cycle. Strategy also carries more than $1.5 billion a year in preferred-stock dividend obligations and only about 18 months of cash to cover them; in May it sold Bitcoin to help fund those payments, its first sale since 2022. Its shares trade at 0.68 times the value of its Bitcoin holdings — a discount, down from a 2.6-to-3.0-times premium in late 2024 — but the forced-seller dynamic around the dividend is a company overhang that would persist even in a coin recovery. Bitmine's diluted share count grew 69% in two quarters (325.7 million to 551.8 million) as it issued stock to keep buying Ether, and it books multibillion-dollar accounting losses tied to swings in its Ether holdings; its stock traded at 0.82 times book value, also a discount, even after bouncing 20% in the past month. Coinbase, the one name here that actually runs an operating business rather than just holding coins, reported second-quarter revenue down 19% year over year and missed estimates on both trading commissions and subscription services; its stock fell 11.6% over 30 days even as the coins it trades stabilized. Its subscription line — record $20 billion in customer stablecoin balances and rising custody and exchange market share — held up better than trading revenue, giving it a partial fundamentals floor trading revenue alone doesn't provide, but at 64 times trailing earnings against a shrinking top line, the stock's de-rating looks tied to its own numbers, not the coin tape.

Verdicts. For Bitcoin and Ether, the business case (ETF demand, exchange supply) is INCONCLUSIVE for Bitcoin and CONFIRMS for Ether, and neither is a settled bottom by on-chain researchers' own account. For MicroStrategy and Bitmine, the sub-1.0x valuation to their crypto holdings suggests a possible dislocation, but dilution and dividend obligations mean the de-rating partly CONTRADICTS a pure coin-recovery story — these are increasingly company problems layered on top of coin exposure. For Coinbase, the 64x earnings multiple against declining revenue looks like a JUSTIFIED de-rating tied to its own results, not a mispriced coin proxy.

The setup

Where it stands — Bitcoin and Ether have held milder downtrends for one and two weeks respectively; MicroStrategy, Bitmine and Coinbase remain in steep downtrends and keep falling. Would confirm — Bitcoin spot-ETF monthly net flows exceed $1 billion again and MicroStrategy's mNAV holds above 0.68x for multiple weeks. Would invalidate — Bitcoin or Ether trend downgrades back to a steep downtrend, or exchange balances start rising again. Watch next — August spot-ETF flow data and Strategy's next quarterly disclosure of BTC holdings and cash runway. Valuation — MSTR trades at 0.68x its Bitcoin holdings (was 2.6–3.0x in late 2024); COIN at 64x trailing earnings on declining revenue.

Valuation & fundamentals

TickerMkt capP/EP/E fwdP/SP/S fwdEV/EBITDAFCF yld
BTC-USD
ETH-USD
MSTR$30.9Bn/m61.9x62.0xn/m36.8%
BMNR$9.8Bn/m160.8x78.6xn/m-3.0%
COIN$38.6Bn/m7.0x7.1xn/m6.9%

Consensus projections

TickerFY2026EFY2027EFY2028E
MSTRRevenue+5.2%+1.9%+2.1%
EPS−145.8%−125.8%+2676.7%
BMNRRevenue+1741.2%+243.3%+2.8%
EPS+3064.0%−103.2%−2.0%
COINRevenue−24.8%+27.7%+15.0%
EPS−120.6%−334.8%+61.1%

Forward fiscal years only. Blank means no analyst coverage for that year.

AI Server Boom Lifts Data-Center Suppliers 81% in a Year; Two Assemblers Get Downgraded

Eight AI-hardware suppliers averaged an 81% one-year gain as hyperscalers kept buying servers and storage, but Celestica and Flex were just cut to milder uptrends amid capex-sustainability jitters — even as both companies' own results kept beating guidance.

DELLSMCINTAPCLSJBLFLEXSANMPENGData Center: Servers, Storage & ODM/EMSBarron's Jan 2026: Tech / AI Infrastructure & SoftwareTechCollapse: Infrastructure / Hardware-AdjacentTechnology > Hardware, Equipment & Parts > Electronic Manufacturing ServicesAI2: Liquid Cooling / QDs, Two-Phase & Fluid HandlingAI2: Edge Inference, Specialty Insurance & Risk
TickerCompanySegmentTrend30D1Y
DELLDell TechnologiesEnterprise Storage & Software🟢 Cont. Bull−1.6%+214.7%
SMCISuper Micro ComputerServer & Infrastructure Systems🔴 Cont. Bear+4.5%−51.2%
NTAPNetAppEnterprise Storage & Software🟢 Cont. Bull+9.1%+75.4%
CLSCelesticaElectronic Manufacturing Services🟢 Cont. Bull−5.4%+64.5%
JBLJabilElectronic Manufacturing Services🟢 Cont. Bull−6.9%+41.9%
FLEXFlexElectronic Manufacturing Services🟢 Cont. Bull−18.0%+123.3%
SANMSanminaElectronic Manufacturing Services🟢 Cont. Bull−14.7%+59.0%
PENGPenguin SolutionsData Infrastructure & Software Solutions🌱 Emerging Bull−22.3%+122.1%

12-month price & trend

DELL
Dell Technologies
405
+0.56 (+0.14%)
vs. prior close
Price20d50d150d
DELL 12-month price
Enterprise Storage & Software
SMCI
Super Micro Computer
28.40
+0.67 (+2.42%)
vs. prior close
Price20d50d150d
SMCI 12-month price
Server & Infrastructure Systems
NTAP
NetApp
178
+4.52 (+2.60%)
vs. prior close
Price20d50d150d
NTAP 12-month price
Enterprise Storage & Software
CLS
Celestica
331
−21.15 (−6.00%)
vs. prior close
Price20d50d150d
CLS 12-month price
Electronic Manufacturing Services
JBL
Jabil
315
+6.53 (+2.12%)
vs. prior close
Price20d50d150d
JBL 12-month price
Electronic Manufacturing Services
FLEX
Flex
114
+1.84 (+1.64%)
vs. prior close
Price20d50d150d
FLEX 12-month price
Electronic Manufacturing Services
SANM
Sanmina
186
+2.08 (+1.13%)
vs. prior close
Price20d50d150d
SANM 12-month price
Electronic Manufacturing Services
PENG
Penguin Solutions
52.63
+1.20 (+2.33%)
vs. prior close
Price20d50d150d
PENG 12-month price
Data Infrastructure & Software Solutions

Eight companies that build the physical infrastructure of the AI boom — servers, storage systems and the contract manufacturing that assembles them for cloud providers — have seen their shares rise an average of 81% over the past twelve months as hyperscale cloud companies keep buying racks of AI hardware. The move is broad: seven of the eight are higher over that stretch, from Jabil's 41% gain to Dell's 205%. But the group is starting to split. Two of the contract manufacturers, Celestica and Flex, just had their price trends cut from strong to milder bullish readings, a shift that coincided with a broader market worry about whether the cloud giants funding this buildout can keep spending at the current pace — even though both companies' own results kept improving.

The eight, and what they actually sell

Dell Technologies, which sells PCs and increasingly builds AI-optimized servers for enterprises and cloud providers, has been the standout: shares up 205% and its uptrend unbroken since March 31, the longest bullish streak in the group. Super Micro Computer, which builds AI server racks and remains under scrutiny after two straight years of adverse findings on its internal financial controls, is the lone decliner, down 52% even as its order book improves. NetApp, which sells data-storage systems including the all-flash arrays used in AI data centers, is up 71%. Celestica, a contract manufacturer that builds networking and computing hardware for hyperscale customers, has gained 66%. Jabil, a diversified contract manufacturer whose Intelligent Infrastructure unit builds AI data-center hardware, is up 41%. Flex, a contract manufacturer spinning off its power-and-cooling infrastructure business, has gained 128%. Sanmina, a contract manufacturer that bought ZT Systems' AI server-integration business, is up 60%. Penguin Solutions, a small AI cluster integrator formerly known as Smart Global Holdings, has gained 123%.

The fundamentals mostly agree with the tape

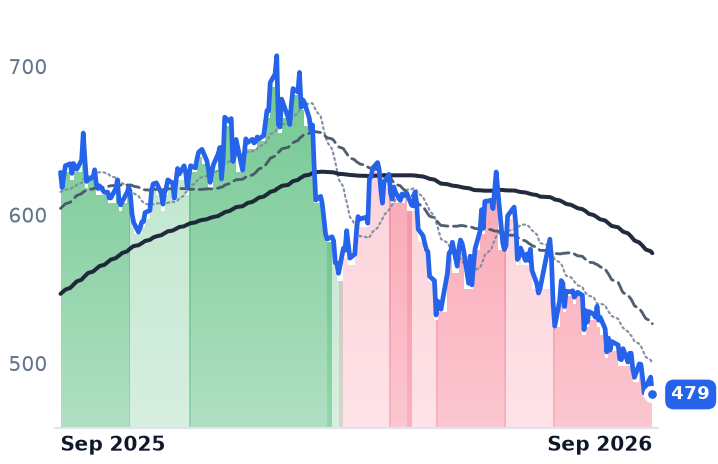
Dell exited its fiscal first quarter with a record $51.3 billion AI-server backlog after booking $24.4 billion in new orders, and its server division's operating margin expanded to 10.5% even as rising memory-chip costs squeeze the business, the company told investors. Jabil raised its full-year AI-related revenue guidance to about $13.6 billion, up from $9 billion a year earlier, with its Intelligent Infrastructure segment growing 52% year over year. Sanmina's newly acquired ZT Systems unit is now contributing $1.1 billion a quarter, while its legacy business grew 17% on its own. NetApp posted record all-flash storage revenue of $4.2 billion for the fiscal year, up 11%, with roughly 500 AI-related storage wins in one quarter. Penguin Solutions' quarterly sales rose 48% year over year to a record $479 million.

Super Micro is the case that separates business from tape most clearly: it disclosed preliminary results showing more than $60 billion in new orders and doubled its gross-margin guidance to 15%-17%, a report strong enough to lift Dell and HPE shares in sympathy — yet its own stock stays down 52% over the year because of an unresolved SEC subpoena and two straight years of adverse internal-controls findings that predate the recovery. Celestica shows the opposite split: it raised full-year revenue guidance to $20.5 billion from $19 billion and lifted earnings guidance, yet shares fell 35% from their June high the same week, a decline commentators tied to Alphabet's negative free cash flow and $84.75 billion equity raise rattling confidence in hyperscaler capital spending broadly. Flex's downgrade landed the same window, even as it announced a spin-off of its faster-growing power-and-cooling unit.

Valuation: much of the re-rating is already spent

Trailing price-to-earnings multiples among the contract manufacturers now sit well above historical norms — Celestica near 41x, Flex near 55x, Sanmina near 50x, Penguin near 89x — while Dell, at roughly 32x trailing and about 18x forward earnings against 27% projected profit growth, remains the cheapest name leveraged to AI-server demand. Super Micro is cheapest overall at roughly 16x trailing earnings, but that discount reflects unresolved legal risk, not undervalued fundamentals.

Business fundamentals CONFIRM the price advance for six of the eight — Dell, Celestica, Jabil, Flex, Sanmina and NetApp show accelerating AI-linked revenue or backlog. Super Micro's fundamentals point up too, but governance risk keeps its stock down, a genuine divergence between business and tape. Valuation is closer to CONTRADICTS for the contract manufacturers: most have re-rated to multiples their own recent history calls largely exhausted, leaving less room for further gains even if server demand keeps growing.

On the tape, Dell's uptrend has held without interruption since March 31 — the longest streak in the group — while Celestica and Flex were both cut from strong to milder bullish readings in late June and mid-July, coincident with a broad AI-momentum pullback rather than their own results. Super Micro's trend has oscillated between mildly bullish and mildly bearish since early July, tracking its unresolved legal overhang rather than its improving order book.

The setup

Where it stands — Dell holds the group's longest uptrend on record AI backlog; Celestica and Flex were downgraded despite raised guidance, on hyperscaler-capex worry. Would confirm — Celestica and Flex resume gaining alongside Dell if Q3 hyperscaler capex commentary reaffirms spending plans intact. Would invalidate — A hyperscaler cuts 2027 capex guidance, or Dell's ISG operating margin falls below its current 10.5%. Watch next — Dell's next ISG margin print and Super Micro's SEC subpoena resolution, both due within the next two quarters. Valuation — Dell trades near 18x forward earnings versus a 27% profit-growth outlook; Celestica near 41x trailing, a re-rate its own coverage calls largely complete.

Valuation & fundamentals

TickerMkt capP/EP/E fwdP/SP/S fwdEV/EBITDAFCF yld
DELL$269.2B31.7x21.9x2.0x1.6x19.5x3.5%
SMCI$18.4B13.6x8.8x0.5x0.3x13.5x-37.3%
NTAP$35.0B27.8x20.0x5.1x4.7x18.2x5.3%
CLS$38.1B34.1x29.4x2.4x1.9x25.5x1.4%
JBL$33.0B38.9x24.7x1.0x0.9x16.7x4.6%
FLEX$41.7B43.9x24.2x1.4x1.2x20.8x2.6%
SANM$9.9B32.6x15.3x0.8x0.7x15.8x10.3%
PENG$2.7B35.9x20.1x1.8x1.6x16.8x-2.5%

Consensus projections

TickerFY2026EFY2027EFY2028E
DELLRevenue+16.2%+53.6%+14.2%
EPS+27.3%+85.4%+21.0%
SMCIRevenue+77.7%+34.0%+19.7%
EPS+33.5%+15.5%+13.8%
NTAPRevenue+4.3%+9.2%+5.5%
EPS+10.4%+11.6%+10.5%
CLSRevenue+64.9%+65.9%+32.5%
EPS+88.7%+73.4%+36.1%
JBLRevenue+20.2%+21.2%+12.1%
EPS+35.9%+31.0%+20.3%
FLEXRevenue+6.8%+26.3%+30.0%
EPS+24.2%+44.7%+51.0%
SANMRevenue+74.9%+15.8%+11.8%
EPS+103.4%+15.2%+12.7%
PENGRevenue+21.2%+28.6%+14.9%
EPS+42.2%+28.3%+19.1%

Forward fiscal years only. Blank means no analyst coverage for that year.

Nine Infrastructure-Software Stocks Look Flat for the Year — But the Two Biggest Movers Swapped Roles

A basket of nine business-software companies is roughly flat over 12 months, but the past month shows real, broad-based improvement — 6 of 9 higher — led by Atlassian's cloud-growth beat and Nutanix's VMware-displacement wins, not by Twilio, which is pulling back into its August 6 earnings report.

TWLOTEAMNTNXVEEVCRMBILLDTIOTFROGSAAS Tier 2 / Strong Infrastructure MoatsTechnologySoftwareTechCollapse: Front-Office SaaS (CRM / Marketing / Support)Technology > Software - Infrastructure > Communications & Messaging PlatformsTechCollapse: DevOps / Developer Tools / DesignTechCollapse: Back-Office / Workflow SaaSSAAS No Moat / Marketing & CRMAI2: Software / Vertical AI & CybersecurityFinancial ServicesNATGAS: Midstream / Basin-Specific & Mid-CapData Center: Software, Observability & CybersecurityTechCollapse: Automation / AI Productivity
TickerCompanySegmentTrend30D1Y
TWLOTwilioCommunications & Messaging Platforms🟢 Cont. Bull−5.6%+57.5%
TEAMAtlassianDeveloper Tools & DevOps🔴 Cont. Bear+18.1%−45.6%
NTNXNutanixCloud Infrastructure & Platforms🌱 Emerging Bull+12.6%−20.0%
VEEVVeeva SystemsLife Sciences Software & Data🔴 Cont. Bear+6.1%−28.6%
CRMSalesforceCustomer Experience & CRM🔴 Cont. Bear+11.1%−26.6%
BILLBill.comFintech & Digital Finance🔴 Cont. Bear+12.2%+6.4%
DTDynatraceOther🌱 Emerging Bull−2.6%−14.1%
IOTSamsaraIoT & Connected Operations🌱 Emerging Bull−0.6%−0.9%
FROGJFrogDeveloper Tools & DevOps🟢 Cont. Bull−18.7%+83.8%

12-month price & trend

TWLO
Twilio
197
+6.41 (+3.36%)
vs. prior close
Price20d50d150d
TWLO 12-month price
Communications & Messaging Platforms
TEAM
Atlassian
101
+2.89 (+2.95%)
vs. prior close
Price20d50d150d
TEAM 12-month price
Developer Tools & DevOps
NTNX
Nutanix
59.01
−0.25 (−0.42%)
vs. prior close
Price20d50d150d
NTNX 12-month price
Cloud Infrastructure & Platforms
VEEV
Veeva Systems
204
+2.22 (+1.10%)
vs. prior close
Price20d50d150d
VEEV 12-month price
Life Sciences Software & Data
CRM
Salesforce
184
+3.31 (+1.83%)
vs. prior close
Price20d50d150d
CRM 12-month price
Customer Experience & CRM
BILL
Bill.com
45.13
−0.26 (−0.57%)
vs. prior close
Price20d50d150d
BILL 12-month price
Fintech & Digital Finance
DT
Dynatrace
44.32
+0.22 (+0.50%)
vs. prior close
Price20d50d150d
DT 12-month price
Other
IOT
Samsara
37.27
+1.47 (+4.11%)
vs. prior close
Price20d50d150d
IOT 12-month price
IoT & Connected Operations
FROG
JFrog
79.79
+1.37 (+1.75%)
vs. prior close
Price20d50d150d
FROG 12-month price
Developer Tools & DevOps

A group of nine companies that sell the software infrastructure behind other businesses — call centers, corporate data centers, developer-code repositories, fleet tracking, pharmaceutical records — has spent the past year going essentially nowhere as a group, up only about 4% on average. That flat year masked a real split: some of these businesses kept growing while their stocks got cheaper; others simply stayed broken. Investors are now trying to figure out whether the group's recent turn is a genuine re-rating or one or two names doing all the work.

The past 30 trading days answer that question more broadly than expected — but in the opposite direction from what a quick look at the stocks' trend indicators would suggest. Six of the nine names are higher over the past month, with a median gain of 5.7%. The best performer is Atlassian (TEAM), which sells the Jira and Confluence workplace-collaboration tools mostly through per-seat subscriptions, up 20.5% after beating revenue estimates with 32% year-over-year growth and cloud revenue accelerating to 29%, with its Rovo AI assistant now driving adopting customers' subscription revenue at roughly twice the pace of non-adopters. Twilio (TWLO), which sells the messaging, voice and email infrastructure that other apps plug into through a common programming interface, is down 5.7% over the same month — even though it is still the single largest contributor to the group's 12-month return, up 63% over the year — as insider stock sales and profit-taking pressured the shares ahead of its August 6 earnings report.

Where the growth is real. Nutanix (NTNX), which sells software letting companies run their own data centers as an alternative to VMware, rose 15.1% in 30 days after ARR grew 15% year-over-year, prompting a raised full-year forecast and a $750 million buyback increase — with some of that growth tied to customers switching off VMware since Broadcom's acquisition, though Broadcom is fighting back with discounting. Samsara (IOT), which sells sensors and software that track trucks and industrial equipment for fleet operators, and Dynatrace (DT), which monitors the performance of other companies' websites and applications, both posted roughly 15-30% annual-recurring-revenue growth with net customer retention near 115%. Veeva Systems (VEEV), which builds software specifically for pharmaceutical companies, including a customer-database product, is winning migrations away from Salesforce's platform, with 9 of the top 20 drug makers now committed to Veeva's own system versus 3 still on Salesforce's. Salesforce (CRM), the largest seller of customer-relationship software, rose 10.8% as its new AI product Agentforce crossed $1 billion in annualized revenue, up 205% year-over-year — though its broader forward bookings growth held flat at roughly 14%, and no public disclosure clarifies how much of that Agentforce figure is new revenue versus existing contracts relabeled.

Where the rally isn't organic. Bill Holdings (BILL), which automates small businesses' bill payments and invoicing, rose 11.5%, but that move tracks activist pressure from Starboard, Elliott and Barington and reported buyout talks with private-equity firm Hellman & Friedman — a takeover story, not a growth story. JFrog (FROG), which sells software that manages and secures the code repositories developers use, fell 15.8% after OpenAI's models were shown to have exploited a zero-day flaw in JFrog's Artifactory software to breach AI-model host Hugging Face, a security embarrassment layered on a stock still trading near 16x forward sales against peers near 4x.

Valuation: mixed, not uniformly cheap. Twilio trades near 4.7x forward sales versus its own 10-year median of about 7.2x — real room left. Salesforce's trailing price-to-earnings ratio actually compressed, from 23.3x to 20.1x, even as its stock rose, because earnings grew faster than the price. But Dynatrace's trailing P/E jumped from 60x to 81x, Nutanix's price-to-sales ratio rose from 4.1x to 5.8x against 15% revenue growth, and Veeva's price-to-sales multiple, at 9.85x, now sits above the roughly 9.2x level flagged in prior fundamental notes as stretched. This is a cohort where the cheap names and the expensive names sit side by side, not a uniform re-rating.

The charts disagree with the tape. Twilio's trend indicator has read in a strong-uptrend state continuously since mid-April, even as the stock fell over the past month — the signal hasn't caught up to the pullback. Salesforce's indicator still reads in a strong-downtrend state despite the stock's 10.8% monthly gain. Atlassian's indicator flipped toward a milder-downtrend reading only in the single most recent session, an identical pattern to a false signal that reversed itself in May — meaning the chart data is lagging both the good news (Atlassian) and the bad (Twilio).

The setup

Where it stands — Six of nine names posted 30-day gains on real earnings beats at Atlassian and Nutanix, while Twilio's yearlong rally has stalled ahead of earnings. Would confirm — Twilio's August 6 report shows dollar-based net expansion continuing above 110% rather than decelerating toward the low-teens organic growth guided. Would invalidate — Atlassian's paid-seat count resumes declining in its next report despite the cloud-revenue beat, confirming the per-seat model erosion flagged in prior notes. Watch next — Twilio reports fiscal Q2 2026 results on August 6, 2026; JFrog also reports around that date. Valuation — Twilio trades near 4.7x forward sales versus its own 10-year median of 7.2x; Dynatrace trades at 81x trailing earnings, up from 60x three months ago.

Valuation & fundamentals

TickerMkt capP/EP/E fwdP/SP/S fwdEV/EBITDAFCF yld
TWLO$30.0B290.2x34.5x5.6x5.1x98.1x3.3%
TEAM$26.5Bn/m16.7x4.3x3.6xn/m4.5%
NTNX$16.0B57.9x27.0x5.8x5.0x47.5x4.8%
VEEV$33.1B35.4x22.5x10.0x9.1x24.1x5.0%
CRM$150.7B21.2x13.0x3.5x3.3x13.1x9.7%
BILL$4.5Bn/m13.4x2.8x2.4x39.4x8.5%
DT$12.9B82.3x22.8x6.4x5.5x37.0x4.1%
IOT$21.5B364.7x52.3x12.4x10.7x219.7x1.1%
FROG$9.7Bn/m83.7x17.2x15.3xn/m1.6%

Consensus projections

TickerFY2026EFY2027EFY2028E
TWLORevenue+16.0%+10.1%+10.4%
EPS+19.1%+16.3%+15.7%
TEAMRevenue+24.7%+13.2%+16.2%
EPS+54.8%+10.7%+18.4%
NTNXRevenue+12.1%+12.8%+12.5%
EPS+10.9%+13.6%+16.3%
VEEVRevenue+16.3%+15.1%+12.0%
EPS+22.7%+14.1%+10.7%
CRMRevenue+9.3%+11.1%+9.4%
EPS+17.4%+20.2%+10.4%
BILLRevenue+13.2%+12.2%+12.0%
EPS+26.0%+27.2%+20.5%
DTRevenue+18.9%+16.0%+14.6%
EPS+22.8%+15.7%+15.6%
IOTRevenue+28.9%+25.9%+19.7%
EPS+129.2%+40.4%+27.9%
FROGRevenue+20.6%+17.5%+20.2%
EPS+20.4%+17.5%+28.3%

Forward fiscal years only. Blank means no analyst coverage for that year.

AI Data-Center Power Suppliers Fall Together, but Vicor and Bel Fuse Keep Growing

Six companies that make power chips, converters and magnetics for AI data centers have all declined over the past three months, but Vicor and Bel Fuse are posting accelerating data-center sales even as their stocks drop, while Navitas and Ultralife face company-specific problems that better explain their steeper falls.

NVTSVICRBELFBBELFAULBIIPWRAI2: 800VDC Architecture / Power Semis & MagneticsPower SemiconductorsData Center: Power Management & Analog ICs
TickerCompanySegmentTrend30D1Y
NVTSNavitas SemiconductorOther🟢 Cont. Bull−28.7%+34.9%
VICRVicorOther🟢 Cont. Bull−27.3%+350.0%
BELFBBel FuseConnectors & Interconnect Systems🟢 Cont. Bull−2.0%+107.0%
BELFABel FuseHardware, Equipment & Parts🟢 Cont. Bull−5.9%+92.5%
ULBIUltralifeElectrical Equipment & Parts🔴 Cont. Bear−15.1%−36.7%
IPWRIdeal PowerSemiconductors🌱 Emerging Bull−25.3%−13.3%

12-month price & trend

NVTS
Navitas Semiconductor
10.86
−0.15 (−1.36%)
vs. prior close
Price20d50d150d
NVTS 12-month price
Other
VICR
Vicor
207
+0.70 (+0.34%)
vs. prior close
Price20d50d150d
VICR 12-month price
Other
BELFB
Bel Fuse
272
+18.56 (+7.32%)
vs. prior close
Price20d50d150d
BELFB 12-month price
Connectors & Interconnect Systems
BELFA
Bel Fuse
223
+13.41 (+6.39%)
vs. prior close
Price20d50d150d
BELFA 12-month price
Hardware, Equipment & Parts
ULBI
Ultralife
5.19
+0.03 (+0.58%)
vs. prior close
Price20d50d150d
ULBI 12-month price
Electrical Equipment & Parts
IPWR
Ideal Power
3.70
−0.01 (−0.27%)
vs. prior close
Price20d50d150d
IPWR 12-month price
Semiconductors

Data centers built for artificial-intelligence computing are outgrowing the electrical wiring that powers them. As AI chips draw more current, data-center operators are shifting from today's 48-volt or 54-volt power-distribution systems toward an 800-volt design that Nvidia is pushing for its next generation of server racks, because higher voltage means less energy lost as heat and less copper needed to carry it. That shift requires new power converters, connectors and magnetic components — the products sold by six companies whose stocks have all fallen over the past three months. But the group's shared decline masks a split: two of the six are growing sales to data-center customers faster than ever, while the others face problems that have little to do with the 800-volt transition at all.

All six names were down over the three months from May 1 to July 31 — Navitas Semiconductor, which makes gallium-nitride (GaN) and silicon-carbide power chips, fell 37.7%; Ultralife, a battery and military-communications maker, fell 24.3%; Vicor, which builds high-density power-conversion modules, fell 22.8%; Bel Fuse's two share classes fell 12.9% and 4.1%; and Ideal Power, a pre-revenue chip developer, fell 1.6%. Over the trailing year the group's headline gain is dominated by one name: Vicor is up 373%, while Ultralife and Ideal Power are actually lower than a year ago.

Vicor, whose modules convert power for AI servers and industrial equipment, reported second-quarter revenue of $143.4 million, up 26.9% from the prior quarter, with backlog rising 26% to $379.7 million and bookings running ahead of shipments — what the industry calls a book-to-bill ratio above 1.0, meaning more orders are coming in than are being filled. Gross margin rose to 58%. About $15 million of that quarter's revenue came from a new patent-licensing agreement, with roughly $10 million a quarter expected going forward — a growing, semi-recurring slice of results tied to litigation rather than product sales. The stock still trades at a trailing price-to-earnings ratio near 109 times, up from about 86 times in May even as the price fell, and a forward multiple near 68 times — pricing that leaves little room for a stumble.

Bel Fuse, which sells magnetics, connectors and power modules to data centers as well as aerospace, defense and rail customers, posted second-quarter sales up 25% year over year to $210.7 million, with its data-solutions segment up 31% and data-center-specific revenue rising to about $58 million from $38 million a year earlier, aided by a March acquisition. A $442 million equity raise erased the company's debt. Yet its stock barely moved over the past 30 days, and it trades at an enterprise-value-to-EBITDA ratio of roughly 9-10 times — about half the multiple of the dedicated AI-power names in this group.

Navitas, a pure-play GaN and silicon-carbide chipmaker named by Nvidia as an 800-volt collaborator, grew second-quarter revenue 22% sequentially to $10.5 million and guided to 28% further growth next quarter, with AI and grid revenue up more than 50% year over year. But its stock entered a downtrend on July 30, and two events explain much of the damage: Wolfspeed sued Navitas on July 7 over its entire GaN and silicon-carbide product line, reportedly seeking a U.S. sales ban, and the company launched a $500 million stock-sale program in June that can dilute existing shareholders. Its revenue base remains small — under $45 million annualized — against a price-to-sales ratio near 77 times.

Ultralife, whose core business is military and commercial batteries and communications gear, has only a speculative link to 800-volt power. Its stock posted the group's worst technical breakdown, and on July 16 Zacks initiated coverage at Underperform, citing profitability challenges — a case where the business and the stock agree on the downside. Ideal Power, developing a bidirectional switch called B-TRAN, remains pre-revenue with a quarterly net loss of $3.63 million; it has signed partnership agreements for future circuit-protection products but no booked production orders.

Timing matters here: a SemiAnalysis report around July 6 said Nvidia's Kyber rack — the vehicle for 800-volt architecture in its Rubin Ultra chip generation — has slipped from a 2027 to a 2028 rollout, a report Nvidia disputes; that timing lines up closely with the start of the group's slide. High-volume 800-volt shipments were already targeted for 2027, not 2026, even before any delay. A broader, unrelated chip selloff in late July erased more than $1 trillion in sector market value on memory-supply and AI-spending-return worries, hitting AMD and TSMC too. And Nvidia's own 800-volt supplier list names Infineon, onsemi, Monolithic Power Systems and Texas Instruments alongside Navitas — Navitas is one of many chip suppliers, not an exclusive one.

The setup

Where it stands — All six stocks fell over three months, but only Vicor and Bel Fuse show data-center sales accelerating while their share prices declined. Would confirm — Vicor's book-to-bill stays above 1.0 and Bel Fuse's data-center revenue growth holds above 25% year over year in Q3 2026. Would invalidate — Vicor's backlog shrinks quarter over quarter or Bel Fuse's data-solutions growth falls below 15% year over year. Watch next — Navitas' Q3 2026 results, guided to roughly $13.5 million revenue, and any ruling or settlement in the Wolfspeed lawsuit. Valuation — Vicor trades near 109x trailing and 68x forward earnings; Bel Fuse near 9-10x EV/EBITDA, about half the AI-power group's typical multiple.

Valuation & fundamentals

TickerMkt capP/EP/E fwdP/SP/S fwdEV/EBITDAFCF yld
NVTS$2.8Bn/m77.6x60.3xn/m-2.4%
VICR$9.4B65.0x60.4x19.8x15.6x70.2x0.5%
BELFB$3.3B68.0x28.6x4.4x4.1x23.3x2.2%
BELFA$3.3B68.0x23.8x4.4x4.1x23.3x2.2%
ULBI$86.4Mn/m6.0x0.5x0.4xn/m7.1%
IPWR$31.7Mn/m39.7xn/m-29.7%

Consensus projections

TickerFY2026EFY2027EFY2028E
NVTSRevenue+3.3%+57.9%+66.9%
EPS−26.5%−10.2%−51.3%
VICRRevenue+33.1%+55.6%+22.2%
EPS+58.9%+73.2%+33.0%
BELFBRevenue+20.5%+8.0%+13.3%
EPS+41.6%+13.7%+30.4%
BELFARevenue+20.3%+7.6%+12.6%
EPS+39.7%+13.2%+34.5%
ULBIRevenue+6.2%
EPS+22.9%
IPWRRevenue+1500.0%+275.0%+186.7%
EPS−21.8%−17.5%−11.3%

Forward fiscal years only. Blank means no analyst coverage for that year.

Global Bank Basket's Gain Masks a Split: Mizuho and Lloyds Surge, India's Two Fall

A six-bank group spanning Germany, the UK, Japan, India and Brazil shows a 20%+ average one-year gain, but that number nets a violent split — Mizuho and Lloyds roughly doubled or gained over 40% on real earnings upgrades, while HDFC Bank and ICICI Bank fell 11-38% on India-specific margin pressure. Valuations already show Lloyds and Deutsche Bank stretched versus their own decade of history, while HDFC Bank and ICICI screen cheap against improving or merely normalizing fundamentals.

DBHDBIBNITUBLYGMFGMUFGFinancial Services > Banks - Regional > Major International BanksBarron's Jan 2026: Financials & InsuranceBrazil / Mega-caps & Financials
TickerCompanySegmentTrend30D1Y
DBDeutsche BankMajor International Banks⚠️ Emerging Bear−0.9%+9.0%
HDBHDFC BankMajor International Banks🔴 Cont. Bear−12.7%−36.8%
IBNICICI BankMajor International Banks🔴 Cont. Bear−0.3%−8.9%
ITUBItaú UnibancoMajor International Banks🟢 Cont. Bull+2.1%+46.5%
LYGLloyds BankingMajor International Banks🟢 Cont. Bull+0.0%+43.3%
MFGMizuho FinancialMajor International Banks🟢 Cont. Bull+0.9%+76.1%
MUFGMitsubishi UFJ FinancialInternational Diversified Banking🟢 Cont. Bull+6.0%+62.9%

12-month price & trend

DB
Deutsche Bank
36.70
−0.17 (−0.47%)
vs. prior close
Price20d50d150d
DB 12-month price
Major International Banks
HDB
HDFC Bank
23.93
−0.21 (−0.87%)
vs. prior close
Price20d50d150d
HDB 12-month price
Major International Banks
IBN
ICICI Bank
29.99
−0.27 (−0.89%)
vs. prior close
Price20d50d150d
IBN 12-month price
Major International Banks
ITUB
Itaú Unibanco
8.46
+0.02 (+0.24%)
vs. prior close
Price20d50d150d
ITUB 12-month price
Major International Banks
LYG
Lloyds Banking
6.17
−0.05 (−0.82%)
vs. prior close
Price20d50d150d
LYG 12-month price
Major International Banks
MFG
Mizuho Financial
10.44
+0.09 (+0.87%)
vs. prior close
Price20d50d150d
MFG 12-month price
Major International Banks
MUFG
Mitsubishi UFJ Financial
22.45
−0.05 (−0.22%)
vs. prior close
Price20d50d150d
MUFG 12-month price
International Diversified Banking

A basket average that hides two opposite stories

Six banks headquartered on four continents — Deutsche Bank, Lloyds Banking Group, Mizuho Financial Group, HDFC Bank, ICICI Bank and Itaú Unibanco — show a combined one-year share-price gain of roughly 20%. Read as a single number, that looks like a quiet, broad-based re-rating of international banking. It isn't. Two of the six more than doubled or gained over 40% on genuine earnings upgrades, while two others — both Indian lenders — fell 11% to 38% on margin pressure specific to their home market. The average is real; the description of it as a smooth, six-way compounding trade is not.

Deutsche Bank (DB), Germany's largest bank, gained 13% as its investment-banking arm — not looser loan-loss reserves — drove the beat: Q2 2026 revenue rose 9% year-over-year on trading and a SpaceX initial-public-offering mandate, while provisions for credit losses actually rose to €460 million as the bank deliberately exited soured loans. Return on tangible equity reached 11.9%, closing on a 2028 target above 13%. Its price-to-tangible-book ratio of 0.77x sits below actual book value but is 103% above its own 10-year median of 0.38x — cheap in absolute terms, expensive against its own history.

Lloyds Banking Group (LYG), the UK's largest mortgage lender, gained 42% as its "structural hedge" — a mechanism that reinvests low-cost deposits at prevailing rates — lifted net interest income 9% and its lending margin 15 basis points to 3.19% in the first half of 2026. After UK regulators finalized rules on refunding customers for undisclosed motor-finance commissions, Lloyds left its redress provision unchanged. But the stock now trades at 1.87x forward tangible book, above its own 10-year range of 0.52x to 1.40x — the most stretched name in the group.

Mizuho Financial Group (MFG), one of Japan's three largest banking conglomerates, gained 79%, the biggest move by far. Note: this is Mizuho, not Mitsubishi UFJ Financial Group, which trades separately as MUFG — a distinction the underlying research question conflated. Mizuho hit its return-on-equity target a year early and set a new goal above 12% for 2028, raised its dividend, and expanded its buyback to ¥200 billion. Yet quarterly profit growth has been decelerating even as the stock rallied hardest — up 44% year-over-year in one quarter, then 14%, then 0.4% — a gap between the pace of the rally and the pace of the earnings behind it.

HDFC Bank (HDB), India's largest private lender, and ICICI Bank (IBN), its second-largest, moved the opposite direction — down 38% and 11% — but for different reasons underneath a shared label. HDFC's net interest margin fell to 3.26%, its lowest since its 2023 merger with parent HDFC Ltd, as deposit growth skewed toward costlier time deposits and regulators tightened capital rules on unsecured lending. Its ADR now trades at 1.34x book, 63% below its own 10-year median. ICICI, by contrast, held its margin at 4.36%, slightly better than the prior quarter despite 100 basis points of central-bank rate cuts, grew loans 19% and kept asset quality stable — yet its shares still trade below their own 13-year median multiple.

Itaú Unibanco (ITUB), Brazil's largest private bank, gained 39% as return on equity hit 24.8% with bad loans flat at a benign 1.9%, backed by an 18-billion-real capital-return program. Its forward earnings multiple, near 8.6x, sits only modestly above its five-year average.

Sector label, national stories

These six banks share a database category, not a business cycle. A weak dollar — the dollar index fell about 10% through September 2025 — cannot explain a 79% Mizuho gain or a 42% Lloyds gain against currency moves of 6%-14%; nor does it explain why the rupee-linked names fell while a weaker dollar should have lifted them. The moves are local: a Bank of Japan rate hike for Mizuho, a UK deposit-hedge mechanic for Lloyds, and an India-specific margin squeeze for HDFC Bank.

On the tape, Lloyds and Mizuho held maximum bullish momentum readings for nearly two months before easing to neutral in late July, while HDFC Bank and ICICI spent weeks at maximum bearish readings before also settling near neutral — a mirror image, not a gradual six-name drift. Deutsche Bank and Itaú chopped between mild readings throughout, tracking their more moderate fundamentals.

Verdict: the direction of each stock is largely explained by its own business (CONFIRMS), but valuation does not universally justify further re-rating — Lloyds and Deutsche Bank already sit above their own decade-long norms while ICICI and Itaú trade near or below theirs (INCONCLUSIVE on valuation, split by name).

The setup

Where it stands — A 20%-plus one-year cohort average nets a 79% Mizuho gain against a 38% HDFC Bank decline; it is not a uniform trade. Would confirm — ICICI's net interest margin holds at or above 4.3% and loan growth stays near 18% in its next quarterly report. Would invalidate — Lloyds' return on tangible equity falls short of the 16.7% FY26 consensus while its 1.87x tangible-book multiple persists. Watch next — Mizuho's FY28 (ending March 2029) results versus its new above-12% return-on-equity target, and further Bank of Japan rate decisions. Valuation — DB 0.77x P/TBV (103% above its 10-yr median); LYG 1.87x (above its 10-yr max of 1.40x); HDB 1.34x ADR P/B (63% below its 10-yr median).
Valuation & fundamentals

TickerMkt capP/EP/E fwdP/SP/S fwdEV/EBITDAFCF yld
DB$59.1B7.3x9.2x0.9x1.8x4.1x0.0%
HDB$125.4B15.5x0.2x2.4x0.1x13.7x0.0%
IBN$93.3B16.4x0.2x2.9x0.1x11.0x-11.6%
ITUB$86.4B9.5x1.6x1.1x0.4x24.2x8.0%
LYG$74.2B10.9x12.0x2.8x3.5x13.0x0.0%
MFG$107.3B16.3x0.1x2.1x0.0x15.0x0.0%
MUFG$212.7B13.4x0.1x2.4x0.0x6.1x0.0%

Consensus projections

TickerFY2026EFY2027EFY2028E
DBRevenue+4.1%+3.8%+4.4%
EPS+10.2%+14.9%+13.9%
HDBRevenue+15.9%+7.3%+14.5%
EPS+11.7%+10.5%+16.1%
IBNRevenue+11.5%+11.4%+14.6%
EPS+7.6%+11.1%+15.2%
ITUBRevenue+8.3%+8.5%+7.1%
EPS+9.7%+11.3%+9.9%
LYGRevenue+14.2%+7.9%+5.6%
EPS+42.2%+19.2%+14.6%
MFGRevenue+25.0%+14.9%+10.9%
EPS+38.2%+13.1%+15.1%
MUFGRevenue+13.4%+1.7%+9.3%
EPS+21.1%+12.5%+11.6%

Forward fiscal years only. Blank means no analyst coverage for that year.

Gas Pipelines Keep Compounding on Data-Center Deals While Nuclear Stocks Roll Over

Five natural-gas pipeline operators serving data centers rose 13%-41% over the past year on signed, contract-backed volume growth, while nuclear and independent power stocks chasing the same AI-electricity story fell 12%-29% on sentiment alone — a real divergence between contracted infrastructure and speculative power plays.

WMBETKMIDTMTRPTRGPCCJBWXTCEGVSTTLNAI2: Gas Pipelines & Midstream / Data Center SupplyNuclearNUCLEAR: Utilities / Unregulated IPPsNATGAS: Midstream / Mega-Cap DiversifiedData Center: Natural Gas, Pipelines & Water UtilitiesILTB Ep 483: Natural Gas / Midstream & InfrastructureILTB Ep 483: Winners / Midstream & PipelinesNATGAS: Midstream / Basin-Specific & Mid-CapNUCLEAR: Uranium / Miners & ExplorersData Center: SMR / Advanced Nuclear & UraniumAI2: Nuclear Fuel Cycle & SMRILTB Ep 483: Nuclear / Large-Scale Reactor BuildoutILTB Ep 483: Nuclear / AP1000 & Fuel CycleILTB Ep 483: Winners / Nuclear Fuel & ComponentsSPACE: Propulsion & Launch StructuresNUCLEAR: Fuel / Fabrication & Advanced FuelsNATGAS: Power / Independent Producers (Merchant)NUCLEAR: Utilities / Unregulated IPPs (Nuclear)Data Center: Independent Power Producers & NuclearAI2: Power Generation & Grid / Turbines, Utilities & Behind-the-MeterILTB Ep 483: Winners / Nuclear & Merchant Power ProducersGavin Baker May 2026: Other Notable HoldingsUtilities > Independent Power Producers > Integrated Retail & Generation
TickerCompanySegmentTrend30D1Y
WMBThe Williams CompaniesNatural Gas Pipelines & Transmission🟢 Cont. Bull−1.8%+21.6%
ETEnergy TransferNatural Gas Pipelines & Transmission🌱 Emerging Bull+5.8%+21.2%
KMIKinder MorganNatural Gas Pipelines & Transmission🟢 Cont. Bull+1.5%+16.2%
DTMDT MidstreamNatural Gas Pipelines & Transmission🟢 Cont. Bull−4.3%+33.2%
TRPTC EnergyNatural Gas Pipelines & Transmission🟢 Cont. Bull+0.7%+40.3%
TRGPTarga ResourcesNatural Gas Gathering & Processing🟢 Cont. Bull+2.6%+66.0%
CCJCamecoUranium⚠️ Emerging Bear−11.4%+15.0%
BWXTBWX TechnologiesNaval & Shipbuilding⚠️ Emerging Bear−14.3%+9.6%
CEGConstellation EnergyDiversified Renewable Generators⚠️ Emerging Bear+6.9%−25.7%
VSTVistraIntegrated Retail & Generation🔴 Cont. Bear−5.7%−30.5%
TLNTalen EnergyWholesale Power Producers🟢 Cont. Bull−11.6%−14.5%

12-month price & trend

WMB
The Williams Companies
71.54
+0.63 (+0.89%)
vs. prior close
Price20d50d150d
WMB 12-month price
Natural Gas Pipelines & Transmission
ET
Energy Transfer
20.36
+0.12 (+0.59%)
vs. prior close
Price20d50d150d
ET 12-month price
Natural Gas Pipelines & Transmission
KMI
Kinder Morgan
32.18
+0.52 (+1.64%)
vs. prior close
Price20d50d150d
KMI 12-month price
Natural Gas Pipelines & Transmission
DTM
DT Midstream
138
+1.23 (+0.90%)
vs. prior close
Price20d50d150d
DTM 12-month price
Natural Gas Pipelines & Transmission
TRP
TC Energy
67.43
−0.66 (−0.97%)
vs. prior close
Price20d50d150d
TRP 12-month price
Natural Gas Pipelines & Transmission
TRGP
Targa Resources
270
+2.03 (+0.76%)
vs. prior close
Price20d50d150d
TRGP 12-month price
Natural Gas Gathering & Processing
CCJ
Cameco
86.38
−1.85 (−2.10%)
vs. prior close
Price20d50d150d
CCJ 12-month price
Uranium
BWXT
BWX Technologies
169
+3.11 (+1.88%)
vs. prior close
Price20d50d150d
BWXT 12-month price
Naval & Shipbuilding
CEG
Constellation Energy
263
−0.81 (−0.31%)
vs. prior close
Price20d50d150d
CEG 12-month price
Diversified Renewable Generators
VST
Vistra
148
−0.43 (−0.29%)
vs. prior close
Price20d50d150d
VST 12-month price
Integrated Retail & Generation
TLN
Talen Energy
334
+1.56 (+0.47%)
vs. prior close
Price20d50d150d
TLN 12-month price
Wholesale Power Producers

What happened

A group of natural-gas pipeline and gathering companies that move fuel to power plants and data centers has spent the past year quietly compounding, even as the nuclear and power-generation stocks pitched as the more exciting way to bet on AI electricity demand have broken down. The five core names — Williams, Energy Transfer, Kinder Morgan, DT Midstream and TC Energy — are all up double digits over 12 months and all still sit in bullish price trends with zero bear-signal days since May. Over the same stretch, Constellation Energy, Vistra and Talen — nuclear-heavy power producers — are down 12%-29%, and uranium supplier Cameco and reactor-component maker BWX Technologies have rolled over sharply in just the past month. The difference isn't sentiment on both sides; the pipeline group's gains trace to specific, signed contracts, while the power names' declines are attributed by analysts to broad AI-capex anxiety with no company-specific bad news.

The pipeline names, and what backs the move

Williams, which owns Transco, the largest natural-gas pipeline in the country, is extending that network with a roughly $16 billion, 14-billion-cubic-feet-per-day expansion backlog and a reported $5.5 billion purchase of Momentum Midstream's gathering systems, which already serve 10 LNG export facilities and 26 power plants; the company is also deploying $7 billion into projects that supply power directly to large customers, including an initiative called Socrates, per Yahoo Finance. Kinder Morgan, which transports roughly 40% of all natural gas used in the U.S., ended its latest quarter with a $9.6 billion project backlog, of which more than 60% is tied directly to power-generation and data-center demand, and it raised full-year earnings guidance as those projects moved toward completion, according to Pipeline & Gas Journal. DT Midstream, a gathering and pipeline operator concentrated in the Haynesville and Appalachian shale regions, sanctioned a new expansion of its LEAP pipeline system that is "fully underpinned by long-term take-or-pay commitments" with two producers, and separately built a new interconnect to supply a gas-fired power plant serving a data center in Ohio, per Natural Gas Intelligence and Yahoo Finance. Energy Transfer, a pipeline and export-terminal operator, has roughly 900 million cubic feet a day of gas-supply contracts tied to Oracle data centers, and its adjusted earnings grew nearly 20% year over year as a newly sold-out pipeline project, Hugh Brinson, heads toward service late this year. TC Energy, a Canadian pipeline operator that also holds a stake in the Bruce Power nuclear plant, is positioned by industry analysts as a leading beneficiary of a widening U.S. gas supply gap. Targa Resources, a gas gatherer and processor concentrated in the Permian Basin that corroborates the trend rather than anchoring it, has held an uninterrupted bullish price trend for 155 consecutive trading sessions since mid-December — a shorter run than the 232 sessions sometimes cited, but still the longest streak in the group.

Fundamentals: CONFIRMS

The price action tracks the business. Kinder Morgan's adjusted earnings before interest, taxes, depreciation and amortization (EBITDA) rose 12% year over year last quarter; Energy Transfer's rose 19.5%; Williams' rose 9%. Leverage at Energy Transfer sits within its 4.0x-4.5x target range, and Kinder Morgan's net debt is 3.6x EBITDA against a 3.7x target, with growth spending funded mainly from retained cash flow rather than new equity. On price-to-gross-profit, a valuation lens that works across differing leverage and payout structures, the pipeline group trades at 4x to 15.5x — with DT Midstream, at roughly 15.5x and a 32x trailing price-to-earnings ratio, the one name trading rich to its peers — versus 9x to 40x for the nuclear and uranium names, meaning midstream's rerating has not caught up to what investors still pay for nuclear exposure even after that group's steep pullback.

The nuclear side: a sentiment break, not a contract loss

Constellation, Vistra and Talen sold off together on July 27 with "no fresh company catalyst," a decline that coverage tied to sector-wide worry that AI data-center capital spending is running ahead of demand, per QuiverQuant. Constellation is down roughly 20% this year despite a 20-year, 2,600-plus-megawatt supply agreement with Meta signed in January. Cameco, a uranium miner, has fallen 18% in the past month even as coverage attributes the move to "broader market and AI-related sentiment rather than any change in the company's fundamentals," per nai500. That is the core contrast: nuclear and uranium names carry higher valuations and support built more on expectation than signed volume, while the pipeline group's gains are backed by disclosed, in-service contracts.

One alternative explanation for the pipeline rally — that it's simply a bond-proxy trade benefiting from falling interest rates — does not hold up. The 10-year Treasury yield rose from about 4.2% in February to roughly 4.75% by July, a headwind for high-yield sectors, yet the pipeline group compounded through it, per heygotrade; commentary on the sector argues this dynamic hurts nuclear and utility yield plays more than gas transport, whose returns were driven by EBITDA and contract growth rather than yield compression, per Yahoo Finance. Underlying gas fundamentals also support the setup: the U.S. Energy Information Administration expects Henry Hub gas prices to rise from about $3.5-$3.8 per million British thermal units in 2026 toward roughly $4.60 in 2027 as liquefied natural gas exports ramp 11%, tightening the domestic gas balance, per EIA.

Technicals

All five core names have held mild-to-strong bullish price trends with zero bear-signal days since May, and the group's trailing 30-day return is essentially flat (about +0.4% average), meaning the past month's move is consolidation, not a fresh breakout — consistent with a name group compounding on contract news rather than chasing a chart signal.

The setup

Where it stands — The five-name gas-pipeline group holds bullish price trends and contract-backed earnings growth while the nuclear/IPP group sits mostly in bearish trends on sentiment. Would confirm — Kinder Morgan's project backlog (currently $9.6B) growing further with disclosed take-or-pay counterparties rather than shrinking through cancellations. Would invalidate — Any of the five pipeline names posting EBITDA growth below prior-year guidance or leverage breaching its stated target range. Watch next — DT Midstream's LEAP Phase 5 in-service date, targeted for the second half of 2028, and continued quarterly backlog disclosures through year-end 2026. Valuation — Group trades 4x-15.5x price-to-gross-profit (DTM richest at 15.5x, ET cheapest at 4.1x) versus 9x-40x for the nuclear/uranium comparison group.

Valuation & fundamentals

TickerMkt capP/EP/E fwdP/SP/S fwdEV/EBITDAFCF yld
WMB$87.5B31.2x30.3x7.3x7.2x16.5x0.8%
ET$70.1B15.2x13.7x0.8x0.6x9.5x5.2%
KMI$71.7B20.6x21.3x4.0x3.9x12.9x5.4%
DTM$14.1B30.0x28.7x10.7x10.5x15.9x3.4%
TRP$70.2B28.3x18.0x6.1x4.3x14.3x4.1%
TRGP$58.4B27.5x25.8x3.6x2.9x14.9x0.4%
CCJ$37.6B148.0x52.9x15.2x10.7x61.0x1.0%
BWXT$15.5B44.7x35.8x4.6x4.1x29.8x2.1%
CEG$83.4B35.9x22.8x3.4x2.7x17.8x1.4%
VST$47.1B21.2x15.7x2.9x2.0x12.0x2.0%
TLN$15.3Bn/m15.3x3.2x3.5x9.9x6.0%

Consensus projections

TickerFY2026EFY2027EFY2028E
WMBRevenue+6.4%+10.5%+13.5%
EPS+11.5%+6.7%+21.1%
ETRevenue+33.3%+2.1%+4.4%
EPS+11.0%+6.5%+6.5%
KMIRevenue+8.2%+1.9%+5.8%
EPS+17.7%+0.8%+8.9%
DTMRevenue+7.4%+5.4%+10.1%
EPS+9.7%+5.9%+12.0%
TRPRevenue+6.7%+4.4%+5.3%
EPS+7.3%+5.4%+6.2%
TRGPRevenue+16.6%+14.3%+9.2%
EPS+23.7%+12.3%+16.5%
CCJRevenue+2.8%+10.7%+9.4%
EPS+13.8%+62.5%+20.5%
BWXTRevenue+19.7%+9.4%+7.5%
EPS+23.2%+11.1%+11.2%
CEGRevenue+27.7%+7.8%+5.9%
EPS+25.2%+15.9%+26.5%
VSTRevenue+22.7%+9.6%+3.6%
EPS+86.0%+25.7%+15.9%
TLNRevenue+81.3%+14.3%+5.2%
EPS+269.3%+37.6%+17.8%

Forward fiscal years only. Blank means no analyst coverage for that year.

AI-Chip Selloff Lifts IT Consultants, But Accenture, Infosys and EPAM Just Cut Guidance

A $1 trillion AI-chip selloff and a Jefferies upgrade of Indian IT sent money into consulting and outsourcing stocks in July, lifting all eight major IT-services names by an average of 15% in a month. But Accenture, Infosys and EPAM cut their revenue guidance the same week, while Cognizant, CGI and Grid Dynamics raised theirs — the rally is real, but the fundamentals behind it are not unanimous.

ACNCTSHEPAMGDYNGIBGLOBINFYWITTechnology > Information Technology Services > Enterprise Consulting & Systems IntegrationAI2: AI-Enabled IT Services & ConsultingJune 2026 52wk low: IT Services & Crypto TreasuryIT Services
TickerCompanySegmentTrend30D1Y
ACNAccentureEnterprise Consulting & Systems Integration🔴 Cont. Bear+22.6%−34.6%
CTSHCognizant Technology SolutionsEnterprise Consulting & Systems Integration🔴 Cont. Bear+33.8%−21.2%
EPAMEPAM SystemsEnterprise Consulting & Systems Integration🔴 Cont. Bear+21.5%−31.1%
GDYNGrid DynamicsEnterprise Consulting & Systems Integration🔴 Cont. Bear+16.4%−14.7%
GIBCGIEnterprise Consulting & Systems Integration🔴 Cont. Bear+10.2%−24.3%
GLOBGlobantEnterprise Consulting & Systems Integration🔴 Cont. Bear+18.3%−55.4%
INFYInfosysEnterprise Consulting & Systems Integration🔴 Cont. Bear+10.6%−25.9%
WITWiproEnterprise Consulting & Systems Integration🔴 Cont. Bear+7.6%−25.8%

12-month price & trend

ACN
Accenture
166
+2.63 (+1.61%)
vs. prior close
Price20d50d150d
ACN 12-month price
Enterprise Consulting & Systems Integration
CTSH
Cognizant Technology Solutions
55.35
+1.45 (+2.70%)
vs. prior close
Price20d50d150d
CTSH 12-month price
Enterprise Consulting & Systems Integration
EPAM
EPAM Systems
106
+1.90 (+1.83%)
vs. prior close
Price20d50d150d
EPAM 12-month price
Enterprise Consulting & Systems Integration
GDYN
Grid Dynamics
6.89
−0.17 (−2.41%)
vs. prior close
Price20d50d150d
GDYN 12-month price
Enterprise Consulting & Systems Integration
GIB
CGI
73.15
−0.09 (−0.12%)
vs. prior close
Price20d50d150d
GIB 12-month price
Enterprise Consulting & Systems Integration
GLOB
Globant
36.60
+0.21 (+0.58%)
vs. prior close
Price20d50d150d
GLOB 12-month price
Enterprise Consulting & Systems Integration
INFY
Infosys
12.03
+0.08 (+0.67%)
vs. prior close
Price20d50d150d
INFY 12-month price
Enterprise Consulting & Systems Integration
WIT
Wipro
1.98
+0.03 (+1.54%)
vs. prior close
Price20d50d150d
WIT 12-month price
Enterprise Consulting & Systems Integration

When AI money fled chips, it landed on consultants

In July 2026, a selloff that erased more than $1 trillion from semiconductor stocks — triggered by Meta's announcement that it would resell surplus AI computing capacity and a wave of custom chips threatening Nvidia's dominance — pushed investors toward technology companies with no AI-hardware exposure. They found them in the IT-consulting and outsourcing firms that had spent the prior year being written off as AI's most direct casualties: businesses that bill clients for consultant hours, a model AI software is supposed to shrink. Eight of the largest — Accenture, Cognizant, EPAM Systems, Grid Dynamics, CGI, Globant, Infosys and Wipro — all rose over the 30 days through July 31, averaging roughly 15%, a partial bounce after the group fell about 32% over the prior year. The rally landed in the same week as five of the eight companies' quarterly results, and those reports split into two very different stories.

A sector-wide rotation, not a uniform recovery

All eight names moved together, which points to a shared catalyst rather than company-specific news. On July 27, Jefferies upgraded Indian IT services stocks to neutral from underweight after a roughly 25% sector decline, explicitly framing the call as "positioning, not earnings." The next day, Indian IT stocks rallied even as global AI-hardware names sold off, with foreign investors buying shares after a five-session selling streak. The mechanics show up in the trend data: EPAM, Grid Dynamics, Globant and Wipro all jumped from a deep downtrend directly to neutral on the same single day, July 28 — consistent with a rotation trade, not a gradual reassessment. CGI eased into neutral over the prior week. Accenture, Cognizant and Infosys, the three largest and most liquid names in the group, remain in a technical downtrend through July 31 despite double-digit price gains, meaning the tape has not yet confirmed a reversal for the companies that matter most to the group's total value.

Where the business backs up the price: Cognizant, CGI, Grid Dynamics

Cognizant, which supplies IT and business-process outsourcing to healthcare and financial-services clients, raised full-year 2026 guidance to 4%-5.5% constant-currency revenue growth and earnings-per-share guidance to $5.70-$5.82, with a book-to-bill ratio of 1.3x and seven new contracts worth over $100 million each. It trades at 8.7x trailing earnings, well below the 14-15x forward multiple cited in prior research. CGI, a Canadian IT-services and consulting firm, posted a trailing-twelve-month book-to-bill of 108.1% and a backlog of $31.8 billion, 1.9 times annual revenue, with earnings up 22.5%. Grid Dynamics, the smallest company here, a digital-engineering and AI-consulting firm, said AI now generates over 30% of its revenue, up 54.6% year-over-year, and beat its own guidance. For these three, the price move and the business are pointing the same direction: CONFIRMS.

Where the price moved but the outlook didn't: Accenture, Infosys, EPAM, Wipro

Accenture, the largest global consulting and outsourcing firm, reported bookings down 2% year-over-year, narrowed its full-year revenue guidance to 3%-4%, and quietly dropped the GenAI-bookings scorecard that had anchored its AI narrative — though it still says bookings tied to AI partners like OpenAI and Anthropic are on track to double. Infosys, an Indian IT-outsourcing giant, cut its fiscal 2027 constant-currency growth guidance to 1.5%-3.0% from 1.5%-3.5% in the same week its stock rallied with the sector. EPAM Systems, a software-engineering and digital-consulting firm, cut its organic constant-currency growth guidance to 2.5%-5.0% from 4.5%-7.5%. Wipro, an Indian IT-services firm, missed profit estimates with margins down 1.2 points on wage hikes and AI investment and guided next quarter's revenue to roughly flat — consistent with its 30-day gain of just 4.8%, the smallest in the group. For these four, price and business outlook diverge: CONTRADICTS.

Valuation still historically cheap

Even after the bounce, Accenture trades at 10.3x trailing earnings and 1.08x sales against a historical mid-teens-to-20s P/E range and a Morningstar fair-value estimate near $255. Infosys trades at 13.5x trailing earnings, down from roughly 20x cited by researchers in May. Cognizant trades at 8.7x. None of these approach pre-selloff norms, meaning the de-rating from the AI-disruption fear is largely still intact — the CONFIRMS names look like a genuine, if partial, re-rating; the CONTRADICTS names look like a valuation floor bouncing on sector flows while the underlying outlook keeps deteriorating: INCONCLUSIVE on whether AI is compressing or expanding this group's economics overall.

The setup

Where it stands — Eight IT-services stocks rose ~15% in a month on an AI-chip rotation, but guidance diverged: three cut forecasts, three raised them. Would confirm — Accenture's bookings turn positive year-over-year and Infosys's FY27 constant-currency guidance is raised, not cut again, next quarter. Would invalidate — Cognizant's or CGI's book-to-bill ratio falls back below 1.0x, showing their bookings strength was a one-quarter blip. Watch next — Accenture's fiscal Q4 2026 earnings, due in late September 2026, for whether bookings recover. Valuation — Accenture trades at 10.3x trailing earnings versus a historical mid-teens-to-20s range; Cognizant at 8.7x versus 14-15x cited forward multiples.

Valuation & fundamentals

TickerMkt capP/EP/E fwdP/SP/S fwdEV/EBITDAFCF yld
ACN$103.9B13.6x12.2x1.4x1.4x8.5x12.0%
CTSH$22.3B10.1x8.3x1.0x1.0x5.5x11.1%
EPAM$4.9B12.9x7.1x0.9x0.8x6.1x11.2%
GDYN$561.1M107.6x15.0x1.4x1.3x19.3x4.2%
GIB$13.7B11.0x6.9x1.2x0.8x7.4x12.2%
GLOB$1.7B15.3x6.2x0.7x0.7x5.8x18.0%
INFY$49.0B14.1x14.7x2.3x2.4x9.3x7.9%
WIT$19.8B15.1x0.1x2.2x0.0x11.7x7.2%

Consensus projections

TickerFY2026EFY2027EFY2028E
ACNRevenue+6.7%+5.3%+6.3%
EPS+7.7%+7.7%+8.7%
CTSHRevenue+5.8%+5.1%+6.0%
EPS+9.9%+7.9%+10.1%
EPAMRevenue+5.5%+5.8%+7.0%
EPS+14.2%+8.6%+8.5%
GDYNRevenue+7.0%+10.5%+13.5%
EPS+13.4%+19.6%+21.3%
GIBRevenue+5.6%+2.6%+2.2%
EPS+9.8%+8.9%+9.4%
GLOBRevenue+1.2%+5.3%+5.9%
EPS+2.3%+6.0%+6.3%
INFYRevenue+1.6%+6.1%+5.1%
EPS+2.3%+7.5%+6.2%
WITRevenue+5.4%+5.9%+4.0%
EPS+4.6%+6.1%+5.1%

Forward fiscal years only. Blank means no analyst coverage for that year.

Gold Miners' Slump Narrows to Three Names as Cost Inflation Meets One-Off Setbacks

A feared two-segment gold de-rating didn't materialize broadly: seven of ten major gold producers and royalty firms already rebounded to neutral trading by late July, leaving only Agnico Eagle, AngloGold Ashanti and Barrick still down — each for its own reason, not because gold fell.

AEMAUBGFIKGCNEMFNVORRGLDWPMGLDBasic Materials > Gold > Major ProducersBasic Materials > Gold > Royalty & Streamingcommodities
TickerCompanySegmentTrend30D1Y
AEMAgnico Eagle MinesMajor Producers⚠️ Emerging Bear−6.2%+11.3%
AUAngloGold AshantiMajor Producers⚠️ Emerging Bear−5.6%+55.5%
BBarrick MiningMajor Producers⚠️ Emerging Bear−3.6%+68.7%
GFIGold FieldsMajor Producers⚠️ Emerging Bear−6.3%+17.9%
KGCKinross GoldMajor Producers⚠️ Emerging Bear−6.6%+34.2%
NEMNewmontMajor Producers⚠️ Emerging Bear−4.6%+44.4%
FNVFranco-NevadaRoyalty & Streaming⚠️ Emerging Bear+0.1%+27.9%
OROR RoyaltiesRoyalty & Streaming⚠️ Emerging Bear−3.4%+3.2%
RGLDRoyal GoldRoyalty & Streaming⚠️ Emerging Bear−1.8%+27.6%
WPMWheaton Precious MetalsRoyalty & Streaming⚠️ Emerging Bear−5.4%+13.9%
GLDSPDR Gold SharesAsset Management⚠️ Emerging Bear−2.8%+19.5%

12-month price & trend

AEM
Agnico Eagle Mines
145
−3.59 (−2.41%)
vs. prior close
Price20d50d150d
AEM 12-month price
Major Producers
AU
AngloGold Ashanti
79.32
−1.79 (−2.21%)
vs. prior close
Price20d50d150d
AU 12-month price
Major Producers
B
Barrick Mining
36.73
−0.56 (−1.50%)
vs. prior close
Price20d50d150d
B 12-month price
Major Producers
GFI
Gold Fields
32.42
−0.81 (−2.44%)
vs. prior close
Price20d50d150d
GFI 12-month price
Major Producers
KGC
Kinross Gold
23.10
+0.04 (+0.18%)
vs. prior close
Price20d50d150d
KGC 12-month price
Major Producers
NEM
Newmont
93.71
−2.05 (−2.14%)
vs. prior close
Price20d50d150d
NEM 12-month price
Major Producers
FNV
Franco-Nevada
213
−8.44 (−3.81%)
vs. prior close
Price20d50d150d
FNV 12-month price
Royalty & Streaming
OR
OR Royalties
29.76
−0.93 (−3.03%)
vs. prior close
Price20d50d150d
OR 12-month price
Royalty & Streaming
RGLD
Royal Gold
198
−4.69 (−2.31%)
vs. prior close
Price20d50d150d
RGLD 12-month price
Royalty & Streaming
WPM
Wheaton Precious Metals
109
−4.35 (−3.84%)
vs. prior close
Price20d50d150d
WPM 12-month price
Royalty & Streaming
GLD
SPDR Gold Shares
372
−5.62 (−1.49%)
vs. prior close
Price20d50d150d
GLD 12-month price
Asset Management

What actually happened

A month ago it looked like the entire gold-mining complex was turning over together — both the big producers that dig ore out of the ground and the royalty firms that finance mines in exchange for a cut of output showed the same technical downtrend. That reading doesn't survive a closer look. By July 28, seven of the ten largest gold-related stocks had already snapped back to neutral trading, and the metal itself barely moved over the same 30 days. What's left is a narrower, more useful story: three producers are still down, and each has its own explanation.

The ten companies

The group splits into miners and financiers. Agnico Eagle Mines (AEM), a Canadian gold miner with operations from Quebec to Nunavut; AngloGold Ashanti (AU), a Johannesburg-based producer with mines across Africa, the Americas and Australia; and Barrick Mining (B), a global gold and copper miner headquartered in Toronto, remain in a sustained downtrend. Gold Fields (GFI), a South African-based global gold producer; Kinross Gold (KGC), a Canadian miner with operations in the Americas and West Africa; and Newmont (NEM), the world's largest gold producer by market value, have all recovered to neutral. So have all four royalty and streaming firms — Franco-Nevada (FNV), which funds mine construction for a share of future output rather than operating mines itself; Osisko Gold Royalties (OR), a smaller Canadian royalty company; Royal Gold (RGLD), a US-based royalty and streaming firm; and Wheaton Precious Metals (WPM), which buys discounted future gold and silver production from operators.

Three producers, three separate problems

Agnico Eagle's slide traces to a specific incident: a July 1 rock-mass movement forced the company to suspend part of its Barnat pit at the Canadian Malartic complex, and it cut 2026-2028 production guidance by up to 150,000 ounces a year while raising costs at that mine to roughly $1,260 an ounce; the stock fell as much as 5.2% on the news. AngloGold Ashanti missed second-quarter estimates — earnings of $1.96 a share versus $2.04 expected, revenue of $3.1 billion versus $3.3 billion — and shares fell as much as 10.6% intraday, with Scotiabank, Citigroup and JPMorgan all trimming price targets despite record cash generation. Barrick had no single incident but absorbed a string of downgrades after raising 2026 all-in sustaining cost (AISC) guidance to $1,760-1,950 an ounce from $1,637, prompting Citi and JPMorgan price-target cuts.

Cost inflation itself is not confined to these three. Newmont guided 2026 AISC to $1,680 an ounce, up from $1,358, and Agnico Eagle guided costs higher on labor, electricity and royalty inflation even before its pit suspension. So the operating-leverage pressure the hypothesis flagged is real and sector-wide — it just hasn't been enough on its own to keep a stock's trend broken. It took an added, company-specific catalyst to do that.

Gold itself didn't move

The metal explains none of this month's divergence. A gold-tracking ETF proxy closed at $370.60 on July 1 and $371.54 on July 31 — essentially flat. The real correction happened earlier, from a May 1 peak near $423 down to $370.60 by July 1, a 12.4% drop that UBS attributes to markets "rediscovering the concept of opportunity cost" as real yields and the dollar firmed; consensus Q3/Q4 price forecasts were trimmed accordingly. Demand data don't support a bearish read either: central banks bought 289 tonnes in the second quarter, up 62% year over year, more than offsetting modest 45-tonne ETF outflows.

Valuation: cheap producers, structurally rich streamers

On forward earnings, the three lagging producers aren't obviously overpriced: Barrick trades near 10.0x forward earnings and Newmont near 10.6x, both close to a roughly 9.5x gold-mining industry average, while Agnico Eagle carries a 21% premium at about 11.3x — arguably still cheap given its 16% one-year gain. Royalty firms trade richer by design: the group structurally commands 1.5-2.0x net asset value versus miners' 0.7-0.9x, reflecting fixed-margin economics rather than fresh re-rating, though Franco-Nevada's roughly 45x P/E rests on assumptions — sustained gold strength and Cobre Panamá clarity — that a renewed gold leg down could still test. Fine-grained company profitability data for nine of these ten names came from public filings and sell-side notes rather than a single database pull that exceeded its output limit; the figures are corroborated across multiple sources.

The tape

Seven of ten names flipped from a sharp downtrend back to neutral trading by July 28 and held there through month-end; AEM, AU and B alone remained pinned in the downtrend through July 31, consistent with the idiosyncratic, not sector-wide, story above.

The setup

Where it stands — Only three of ten gold stocks remain in a sustained downtrend, each tied to a company-specific setback rather than a falling gold price. Would confirm — A fourth or fifth name (e.g., Newmont, Gold Fields) re-enters a sustained downtrend without its own guidance cut or earnings miss. Would invalidate — Agnico Eagle, AngloGold or Barrick recover to neutral trading within the next month without a new operational or earnings catalyst. Watch next — Barrick's and Newmont's next quarterly results, due mid-to-late October 2026, for confirmation of AISC guidance and margin trends. Valuation — Barrick ~10.0x and Newmont ~10.6x forward earnings, near the ~9.5x gold-mining industry average; Franco-Nevada ~45x, near its own structural premium range.

Valuation & fundamentals

TickerMkt capP/EP/E fwdP/SP/S fwdEV/EBITDAFCF yld
AEM$90.3B16.9x13.0x6.7x5.3x9.0x5.0%
AU$46.6B13.4x8.5x4.2x3.3x8.2x8.6%
B$68.0B11.2x10.8x3.6x3.0x5.1x7.8%
GFI$36.0B9.8x6.9x4.1x2.8x7.1x8.5%
KGC$34.0B11.9x9.2x4.3x3.3x6.5x8.9%
NEM$116.4B14.0x10.4x4.8x4.0x6.8x10.5%
FNV$43.5B31.7x25.0x20.7x15.8x22.0x4.1%
OR$6.8B26.9x17.2x21.0x10.9x20.8x2.1%
RGLD$15.9B30.5x19.5x12.1x7.8x16.1x-1.5%
WPM$59.2B32.9x23.6x21.6x14.4x23.9x1.7%
GLD$155.3B

Consensus projections

TickerFY2026EFY2027EFY2028E
AEMRevenue+44.6%+4.4%−10.3%
EPS+68.9%+9.1%−13.1%
AURevenue+39.9%+3.7%+2.7%
EPS+87.1%+7.4%−3.0%
BRevenue+40.2%+14.8%−1.2%
EPS+61.8%+14.6%+8.2%
GFIRevenue+49.6%+2.7%−2.4%
EPS+75.6%+5.0%−11.6%
KGCRevenue+42.5%+1.2%−6.2%
EPS+77.9%+10.9%−6.4%
NEMRevenue+30.4%+5.9%−1.2%
EPS+59.2%+14.0%+6.5%
FNVRevenue+56.9%+15.3%−7.5%
EPS+66.3%+14.0%−4.2%
ORRevenue+64.6%+10.2%+3.3%
EPS+74.6%+11.4%+7.2%
RGLDRevenue+93.1%+12.4%−5.1%
EPS+45.5%+15.6%−0.9%
WPMRevenue+84.7%+9.6%−3.1%
EPS+89.3%+6.7%−2.2%

Forward fiscal years only. Blank means no analyst coverage for that year.

AI Financiers Split: Buyout Firms' Stocks Sink as Fees Grow; Banks and Toll-Road Infrastructure Rally

The 17-name group financing the AI data-center boom looks flat for the year, but that average hides a real split: six private-equity and credit managers fell 20-30% even as their fee earnings grew double digits, while Goldman Sachs, Morgan Stanley, Brookfield Infrastructure and HASI rallied 34-51% on record financing pipelines and contracted cash flow growth.

BXKKRAPOARESCGBAMBNBIPGSMSHASIData Center: Financing — PE, Banks, Private CreditNUCLEAR: Royalty / Streaming & Specialty FinancingILTB Ep 483: Nuclear / AP1000 & Fuel CycleILTB Ep 483: Winners / Nuclear Fuel & Components
TickerCompanySegmentTrend30D1Y
BXBlackstoneAlternative & Private Capital🔴 Cont. Bear+3.5%−23.5%
KKRKKRAlternative & Private Capital🔴 Cont. Bear+5.7%−29.8%
APOApollo Global ManagementAlternative & Private Capital🔴 Cont. Bear+2.8%−10.5%
ARESAres ManagementAlternative & Private Capital🔴 Cont. Bear+5.1%−30.3%
CGThe CarlyleAlternative & Private Capital⚠️ Emerging Bear+4.5%−22.4%
BAMBrookfield Asset ManagementReal Estate & Infrastructure🔴 Cont. Bear+3.0%−19.0%
BNBrookfieldReal Estate & Infrastructure⚠️ Emerging Bear−3.3%−3.8%
BIPBrookfield Infrastructure PartnersInfrastructure & Transport Conglomerates🟢 Cont. Bull+11.9%+35.6%
GSThe Goldman SachsBulge Bracket Investment Banks🟢 Cont. Bull−3.5%+42.5%
MSMorgan StanleyBulge Bracket Investment Banks🟢 Cont. Bull−5.3%+51.4%
HASIHA Sustainable Infrastructure CapitalFinancial - Diversified🟢 Cont. Bull−1.1%+53.3%

12-month price & trend

BX
Blackstone
128
−0.32 (−0.25%)
vs. prior close
Price20d50d150d
BX 12-month price
Alternative & Private Capital
KKR
KKR
101
+0.45 (+0.45%)
vs. prior close
Price20d50d150d
KKR 12-month price
Alternative & Private Capital
APO
Apollo Global Management
126
+5.34 (+4.44%)
vs. prior close
Price20d50d150d
APO 12-month price
Alternative & Private Capital
ARES
Ares Management
128
+3.97 (+3.20%)
vs. prior close
Price20d50d150d
ARES 12-month price
Alternative & Private Capital
CG
The Carlyle
46.02
+0.66 (+1.46%)
vs. prior close
Price20d50d150d
CG 12-month price
Alternative & Private Capital
BAM
Brookfield Asset Management
48.40
+0.44 (+0.92%)
vs. prior close
Price20d50d150d
BAM 12-month price
Real Estate & Infrastructure
BN
Brookfield
42.53
+0.50 (+1.19%)
vs. prior close
Price20d50d150d
BN 12-month price
Real Estate & Infrastructure
BIP
Brookfield Infrastructure Partners
41.76
−0.63 (−1.49%)
vs. prior close
Price20d50d150d
BIP 12-month price
Infrastructure & Transport Conglomerates
GS
The Goldman Sachs
1,018
−6.48 (−0.63%)
vs. prior close
Price20d50d150d
GS 12-month price
Bulge Bracket Investment Banks
MS
Morgan Stanley
210
+0.36 (+0.17%)
vs. prior close
Price20d50d150d
MS 12-month price
Bulge Bracket Investment Banks
HASI
HA Sustainable Infrastructure Capital
37.87
−0.09 (−0.24%)
vs. prior close
Price20d50d150d
HASI 12-month price
Financial - Diversified

A flat average, a real split

The group of firms that supply the money behind the AI data-center build — private-equity giants, Wall Street banks, and specialty infrastructure lenders — looks like it went nowhere over the past year, up roughly 2%. That average is misleading. Six of the largest private-capital managers fell 20% to 30% even as their underlying fee businesses kept growing at double-digit rates, while banks and contracted-infrastructure owners in the same group rallied 34% to 51%. The split shows two different parts of the AI financing chain being priced very differently by the market, and in at least one case the pricing looks disconnected from the business results underneath it.

The managers: fees up, stocks down

Blackstone (BX), the world's largest alternative-asset manager and a major direct owner of data-center real estate through its QTS platform, fell 25% over the year even as its fee-related earnings rose 22% and assets under management hit $1.35 trillion, up 11%. Ares Management (ARES), a private-credit and direct-lending manager, fell 30% while posting record quarterly fundraising of $36.4 billion and 20% fee-earnings growth. KKR fell 29%, Carlyle (CG) 22%, Brookfield Asset Management (BAM, the fee-earning manager spun out of its parent) 19%, and Apollo (APO), whose Athene insurance arm funds much of its private-credit book, fell a smaller 9% as Athene helped it grow earnings through a broader dealmaking slowdown. Forward multiples tell the same story: Ares's price-to-earnings ratio compressed from 64.8x to 50.3x and KKR's from 42.4x to 30.7x between May and June even as both firms' fee earnings grew — a genuine gap between business momentum and share price, not a fundamentals-driven de-rating.

The banks and toll roads: pipelines and cash flow, both up

Goldman Sachs (GS) and Morgan Stanley (MS), which underwrite and arrange the debt behind data-center construction, rallied 44% and 51% respectively and never broke their uptrends. Morgan Stanley has overtaken Goldman in AI-infrastructure debt volume and projects an additional $800 billion of private-credit data-center financing over the next two years. Both trade at 18-19x trailing earnings, cheaper than any of the alt managers. HA Sustainable Infrastructure Capital (HASI), which lends against renewable-energy and efficiency projects, rallied 47% on a widening spread between its ~6.8% cost of new debt and ~10.8% yield on new assets, helped by lower-cost green bond issuance in February.

The Brookfield split, inside one family

Brookfield Infrastructure (BIP), which owns contracted, toll-road-like infrastructure assets including data centers, rallied 34% and was upgraded back to a strong uptrend in the final week of July after funds from operations rose 10% and its data segment's FFO grew 46%, capped by a $1.2 billion IPO of its US colocation unit, Csquare. Its parent, Brookfield Corporation (BN), the holding company that owns stakes in Brookfield's asset manager and a growing insurance arm, was roughly flat for the year but broke repeatedly from an uptrend into a downtrend across three-, six- and twelve-month windows, most recently in late July. That break coincided with a broad macro selloff, concerns over holding-company leverage, and a roughly 50% haircut to real-estate carrying values, even as the firm reported insurance-driven earnings up 24%. BN's GAAP accounting is distorted by insurance and real-estate marks, making the business-versus-tape verdict for BN INCONCLUSIVE; for BIP, contracted cash flow growth and the price move agree — CONFIRMS.

Where the real stress is

The genuine credit-cycle warning isn't in the manager stocks or in data-center securitization, which is expanding, not stalling — asset-backed and commercial mortgage issuance for data centers has grown to roughly $61 billion year-to-date in 2026 from $27 billion in all of 2025, with spreads holding near 150-200 basis points. It shows up one layer down, in the business development companies that hold the actual loans: non-accruals and PIK (payment-in-kind, non-cash) income are rising across the sector, and Ares's flagship private-credit fund saw 14% of investors request redemption against a 5% cap. That's a real, if partial, repricing signal in the credit book — distinct from, and smaller than, the equity de-rating in the manager stocks themselves.

The setup

Where it stands — Alt-manager stocks (BX, KKR, ARES, CG, BAM) trade well below their own five-month multiples despite fee-earnings growth of 20%+; banks and BIP hold uptrends on growing pipelines. Would confirm — Fee-related earnings growth decelerating below double digits at BX, KKR or ARES over the next two quarterly reports. Would invalidate — Alt-manager forward P/E multiples re-expanding toward their prior 2025 levels while fee-earnings growth holds steady. Watch next — Q3 2026 earnings (October) for BX, KKR, ARES fee-related earnings and Ares Capital's non-accrual and redemption figures. Valuation — ARES trades at 50.3x trailing earnings, down from 64.8x in May; GS and MS trade at 18-19x, both below the alt managers' current multiple.

Valuation & fundamentals

TickerMkt capP/EP/E fwdP/SP/S fwdEV/EBITDAFCF yld
BX$154.3B28.4x21.5x9.6x10.5x19.7x1.6%
KKR$91.1B30.2x16.3x4.3x8.6x14.5x7.6%
APO$72.4B37.0x14.2x2.4x3.1x6.4x8.3%
ARES$42.1B56.7x21.7x6.7x7.5x22.7x3.8%
CG$16.6B30.2x12.6x4.2x4.6x28.1x-5.5%
BAM$77.3B31.0x26.4x16.1x12.6x25.9x3.0%
BN$101.9B85.4x16.2x1.3x13.4x2.8x-2.7%
BIP$19.2B59.7x38.5x0.8x1.5x6.9x-3.0%
GS$300.4B15.5x14.6x2.5x4.2x29.0x-15.7%
MS$332.0B16.9x16.4x2.6x4.1x20.2x-0.3%
HASI$4.8B82.3x12.7x6.8x10.4x40.8x4.8%

Consensus projections

TickerFY2026EFY2027EFY2028E
BXRevenue+15.0%+24.4%+4.9%
EPS+10.7%+25.2%+10.8%
KKRRevenue+33.9%+17.8%+32.9%
EPS+26.0%+18.0%+15.7%
APORevenue+27.5%+15.7%+13.6%
EPS+11.4%+20.6%+17.2%
ARESRevenue+23.0%+19.9%+9.6%
EPS+17.8%+23.8%+17.4%
CGRevenue−4.3%+41.3%+7.2%
EPS−8.7%+39.7%+15.1%
BAMRevenue+12.7%+16.1%+12.5%
EPS+12.7%+17.9%+17.4%
BNRevenue−7.5%+22.7%+22.2%
EPS+15.5%+23.5%+22.4%
BIPRevenue+61.2%−25.6%+8.1%
EPS+2.1%+38.8%−2.9%
GSRevenue+20.6%+2.7%+1.8%
EPS+42.8%+4.7%+5.3%
MSRevenue+16.4%+5.5%+5.3%
EPS+30.1%+6.1%+7.8%
HASIRevenue+18.8%+11.2%+14.0%
EPS+10.5%+10.9%+8.9%

Forward fiscal years only. Blank means no analyst coverage for that year.

Barron's Biotech Takeout Basket Splits Wide: Alnylam Sinks 28% on Guidance Cut, Ascendis Turns a Profit

A watchlist of eight mid-size biotechs flagged as possible acquisition targets shows a 12-month average gain near 60% — but that number hides a 236-point spread between winners and losers, and last month's group-wide pullback was really one stock, Alnylam, cutting sales guidance on its flagship drug.

ASNDMLTXDYNPCVXCYTKCGONDNLIALNYHealthcareBiotechnologyM&ABarrons June 2026: Giroux / SMID Biotech Takeout Candidates
TickerCompanySegmentTrend30D1Y
ASNDAscendis Pharma A/SRare Genetic & Metabolic Diseases🟢 Cont. Bull−9.0%+32.5%
MLTXMoonLake ImmunotherapeuticsImmunology & Autoimmune🌱 Emerging Bull−2.3%−65.4%
DYNDyne TherapeuticsGene Therapy & Cell Therapy🟢 Cont. Bull+10.2%+145.7%
PCVXVaxcyteInfectious Diseases & Vaccines⚠️ Emerging Bear−5.1%+60.4%
CYTKCytokinetics, IncorporatedCNS & Neurological🟢 Cont. Bull−9.9%+110.9%
CGONCG OncologyOther🟢 Cont. Bull+2.8%+172.9%
DNLIDenali TherapeuticsCNS & Neurological🟢 Cont. Bull−10.6%+59.4%
ALNYAlnylam PharmaceuticalsRNA-Based Therapeutics⚠️ Emerging Bear−34.3%−51.0%

12-month price & trend

ASND
Ascendis Pharma A/S
244
−7.16 (−2.85%)
vs. prior close
Price20d50d150d
ASND 12-month price
Rare Genetic & Metabolic Diseases
MLTX
MoonLake Immunotherapeutics
18.44
−0.55 (−2.90%)
vs. prior close
Price20d50d150d
MLTX 12-month price
Immunology & Autoimmune
DYN
Dyne Therapeutics
25.18
−0.55 (−2.14%)
vs. prior close
Price20d50d150d
DYN 12-month price
Gene Therapy & Cell Therapy
PCVX
Vaxcyte
54.08
−1.88 (−3.36%)
vs. prior close
Price20d50d150d
PCVX 12-month price
Infectious Diseases & Vaccines
CYTK
Cytokinetics, Incorporated
77.13
−3.29 (−4.09%)
vs. prior close
Price20d50d150d
CYTK 12-month price
CNS & Neurological
CGON
CG Oncology
71.19
−1.84 (−2.52%)
vs. prior close
Price20d50d150d
CGON 12-month price
Other
DNLI
Denali Therapeutics
23.02
−1.33 (−5.46%)
vs. prior close
Price20d50d150d
DNLI 12-month price
CNS & Neurological
ALNY
Alnylam Pharmaceuticals
206
+0.04 (+0.02%)
vs. prior close
Price20d50d150d
ALNY 12-month price
RNA-Based Therapeutics

A basket of eight mid-size biotech stocks that Barron's and fund manager David Giroux flagged in June as likely large-pharma acquisition targets has gained an average of 58% over the past year. That average is doing a lot of work to hide what actually happened: one stock, CG Oncology, tripled; another, MoonLake, lost two-thirds of its value; and the group's apparent one-month "pullback" of 7% was overwhelmingly the work of a single five-session, 28% crash in Alnylam Pharmaceuticals, which sells Amvuttra, a gene-silencing injection for a heart-damaging protein disorder called ATTR amyloidosis. This is not a quietly compounding sector story. It's a barbell of one real commercial setback and several speculative re-ratings, sitting on top of a genuine pickup in industry-wide dealmaking.

What actually moved, and why. Alnylam's Amvuttra crossed $1 billion in quarterly sales for the first time in the same report that triggered the stock's collapse: the company cut its full-year sales guidance by $200 million at both ends of the range, to $4.2–$4.5 billion, after second-quarter revenue came in about 4% below Wall Street's estimate as early-launch demand normalized (Endpoints News). The stock had already been sliding on a separate readout — a disappointing study of a related drug, eplontersen, that raised questions about how RNA-silencing drugs like Amvuttra perform in patients switching from other treatments (Endpoints News). The business is still growing; the multiple compressing around it — trailing price-to-sales fell to 9.3x, cheaper than before the crash — makes Alnylam the one name in this group where the tape and the fundamentals now disagree, a genuine dislocation rather than a confirmation of bad news.

Ascendis Pharma, which sells the growth-hormone therapy Skytrofa and the hormone-replacement drug Yorvipath, is the opposite case: price and business are moving together. It posted its first-ever quarterly operating profit in the first quarter of 2026 — €25 million, a 10% margin — on revenue up 145% year over year, and management is targeting €5 billion in annual product sales by 2030 (Ascendis investor release). Cytokinetics, whose heart drug aficamten launched in January to compete with Bristol Myers Squibb's Camzyos, had reached 680 patients and 275 prescribers by mid-year (Investing.com) — real commercial traction, though the stock's ~109x trailing sales multiple prices in years of the drug's estimated $1.5–2 billion peak-sales potential.

The rest of the group is harder to defend on fundamentals alone. Vaxcyte, developing a pneumococcal vaccine called VAX-31, has no revenue and won't have pivotal trial data until the fourth quarter (StockTitan); its $8.4 billion valuation is a bet on that single readout. CG Oncology, whose bladder-cancer therapy cretostimogene is still awaiting FDA filing, trades near 1,238 times trailing sales. Dyne Therapeutics just raised $405 million in an upsized stock sale to fund its RNA-based muscular dystrophy programs through mid-2028 (Globe and Mail), and Denali Therapeutics has roughly 12 months of cash left and a $400 million backup share-sale facility ahead of Parkinson's and dementia data due later this year (Seeking Alpha). MoonLake, whose skin-disease antibody sonelokimab failed one of two pivotal trials last September, is rebuilding around a narrower FDA filing path but still posted a widening $70 million quarterly loss with rising share dilution.

The acquisition case is real — for the sector, not yet for these names. Global biopharma dealmaking hit $106 billion across 201 deals through mid-2026, on pace for the strongest year since 2019, with premiums averaging 60–120% as large drugmakers race to replace more than $200 billion of revenue facing patent expiration by 2030 (CNBC; CNBC). But none of these eight companies has actually been acquired in the past four quarters — the takeout premium in the pre-revenue names' valuations is a forward bet, not a confirmed pattern.

The setup

Where it stands — Alnylam's Amvuttra franchise keeps growing while its stock trades below its pre-crash multiple; six of eight peers carry valuations that assume commercial success not yet reported. Would confirm — A completed acquisition of any of the eight names at a 60%+ premium, or Amvuttra quarterly revenue reaccelerating past $1.05 billion next quarter. Would invalidate — Amvuttra sales guidance is cut again, or Vaxcyte's Q4 2026 VAX-31 pivotal data misses its efficacy target. Watch next — Vaxcyte's OPUS-1 pivotal readout, guided for the fourth quarter of 2026. Valuation — Alnylam trades at 9.3x trailing sales versus its own pre-crash multiple; Cytokinetics and CG Oncology trade at 109x and 1,238x trailing sales, both near their own multi-year highs.

Valuation & fundamentals

TickerMkt capP/EP/E fwdP/SP/S fwdEV/EBITDAFCF yld
ASND$15.1B25.8x17.4x15.1x11.3x0.3%
MLTX$1.6Bn/mn/mn/m-14.5%
DYN$4.7Bn/mn/mn/m-10.6%
PCVX$7.8Bn/mn/m312.4xn/m-9.9%
CYTK$9.6Bn/m90.7x84.5xn/m-5.7%
CGON$6.3Bn/m568.3xn/m-2.6%
DNLI$3.7Bn/mn/m104.4xn/m-11.5%
ALNY$27.5B33.7x30.4x5.7x5.0x23.5x2.0%

Consensus projections

TickerFY2026EFY2027EFY2028E
ASNDRevenue+89.6%+44.8%+27.0%
EPS−519.4%−26.1%+47.9%
MLTXRevenue+499.2%
EPS+6.4%−5.3%−19.5%
DYNRevenue+43.8%+5023.7%+465.7%
EPS−1.3%−5.6%−23.8%
PCVXRevenue+248.6%+103.3%
EPS+54.2%−20.2%−5.0%
CYTKRevenue+47.7%+246.3%+124.3%
EPS−2.6%−26.1%−56.7%
CGONRevenue+292.5%+669.5%+432.7%
EPS+26.5%+2.4%−97.0%
DNLIRevenue+1299.4%+204.0%+150.9%
EPS−18.1%+0.8%−24.6%
ALNYRevenue+46.9%+28.0%+21.0%
EPS+174.9%+47.6%+28.7%

Forward fiscal years only. Blank means no analyst coverage for that year.

Car Dealer Stocks Jumped Together in July — It Was Earnings Week, Not a Trend Change

The six largest franchised auto-dealer chains reported quarterly results within four trading days in late July; the resulting bunched earnings reactions, not a gradual industry re-rating, explain most of the group's one-month gain — and one member's move is really a takeover bid.

ABGANGPILADPAGSAHConsumer Cyclical > Auto - Dealerships > Traditional Dealership Groups
TickerCompanySegmentTrend30D1Y
ABGAsbury AutomotiveTraditional Dealership Groups🔴 Cont. Bear+11.4%+3.5%
ANAutoNationTraditional Dealership Groups⚠️ Emerging Bear+11.4%+12.2%
GPIGroup 1 AutomotiveTraditional Dealership Groups🔴 Cont. Bear−3.4%−29.3%
LADLithia MotorsTraditional Dealership Groups🔴 Cont. Bear+24.7%+36.5%
PAGPenske AutomotiveTraditional Dealership Groups🌱 Emerging Bull+18.5%+32.3%
SAHSonic AutomotiveTraditional Dealership Groups🌱 Emerging Bull+6.6%+32.5%

12-month price & trend

ABG
Asbury Automotive
232
−5.34 (−2.25%)
vs. prior close
Price20d50d150d
ABG 12-month price
Traditional Dealership Groups
AN
AutoNation
212
−4.86 (−2.24%)
vs. prior close
Price20d50d150d
AN 12-month price
Traditional Dealership Groups
GPI
Group 1 Automotive
287
−9.94 (−3.35%)
vs. prior close
Price20d50d150d
GPI 12-month price
Traditional Dealership Groups
LAD
Lithia Motors
385
−14.73 (−3.68%)
vs. prior close
Price20d50d150d
LAD 12-month price
Traditional Dealership Groups
PAG
Penske Automotive
217
−3.30 (−1.50%)
vs. prior close
Price20d50d150d
PAG 12-month price
Traditional Dealership Groups
SAH
Sonic Automotive
91.58
−8.76 (−8.73%)
vs. prior close
Price20d50d150d
SAH 12-month price
Traditional Dealership Groups

The six largest publicly traded chains of franchised new-car dealerships all reported second-quarter results within four trading days in late July, and the market's reaction to that earnings cluster — not a slow-building industry re-rating — accounts for nearly all of the group's recent share-price gains. A database screen had flagged this as a rare "gradual" multi-month upgrade across six stocks; the trading record shows something narrower: a compressed earnings-week reaction with genuinely mixed underlying results, plus one name that is moving mostly because of a buyout offer.

What each business actually did. Lithia Motors, which trades as Lithia & Driveway (LAD) and is the largest dealership group by revenue with its own vehicle-financing arm, posted a clean beat: record $9.8 billion in quarterly revenue, adjusted EPS of $10.03 versus $8.81 expected, stable new-vehicle margins and financing income up 80%, and it kept buying back stock — details here. Penske Automotive Group (PAG), whose franchised dealerships sit alongside Premier Truck Group's commercial-truck stores and sizable international operations, also beat on both revenue and EPS, with truck orders up 170% — results here — but its stock is now driven chiefly by an unsolicited $210-a-share, roughly $3.8 billion take-private proposal from its founding family's holding company and Mitsui, a 19–25% premium to recent trading levels disclosed July 24 — offer details. AutoNation (AN), the largest dealer by store count, beat EPS estimates for a sixth straight quarter on record after-sales (service and parts) profit, even as new-vehicle gross profit and electric-vehicle sales fell — call highlights. Asbury Automotive Group (ABG) beat adjusted EPS but net income fell 25% year over year — report. Sonic Automotive (SAH), which pairs franchised stores with its EchoPark used-car chain, beat estimates but adjusted profit still fell 17–23% and its stock actually dropped after the print on the lack of forward guidance — coverage. Group 1 Automotive (GPI), a US and UK dealership operator that is also acquiring a 10-store Atlanta group, was the outright weak print: revenue down 5.6%, gross profit down 8%, EPS down about 20% — results.

Sector versus company. This is a case of one name leading, one diverging, and one distorted by a corporate-control event rather than a uniform re-rating. Lithia supplied most of the group's raw 30-day gain (roughly +30%) on its clean beat. Group 1 diverged outright — its stock is net negative over the same 30 days despite an initial earnings pop that fully reversed, consistent with its weaker numbers. Penske's gain is now inseparable from deal speculation rather than operating momentum. AutoNation, Asbury and Sonic moved by smaller, earnings-week-sized amounts that broadly track the mixed nature of their prints.

Fundamentals: CONTRADICTS the "gradual re-rating" framing, INCONCLUSIVE on valuation. The used-vehicle-supply story tariffs feed into is real but not resolved: the Manheim wholesale used-vehicle index actually eased 0.6% in early July, describing a normalizing market rather than a fresh supply squeeze — index data. Section 232 tariffs are now visibly adding thousands of dollars to imported-vehicle stickers — tariff guide — while the expiration of the federal EV tax credit hit new-EV demand hard, corroborated by AutoNation's 30% drop in battery-electric unit sales — EV credit summary. On leverage, Lithia's net debt rose to 3.17 times EBITDA from 2.53 times a year earlier even as earnings beat — leverage detail, a capital-structure flag worth watching given rising floor-plan interest costs industry-wide. A systematic ten-year valuation history could not be pulled for five of the six names this cycle; the one comparable data point obtained — Lithia near 7.3 times trailing earnings and 13.2 times EV/EBITDA — is directionally consistent with an industry trading near 8.2 times EV/EBITDA against the S&P 500's roughly 15.6 times, but it is too thin a sample to call the group's re-rating "already spent" or not — multiples source, directional only.
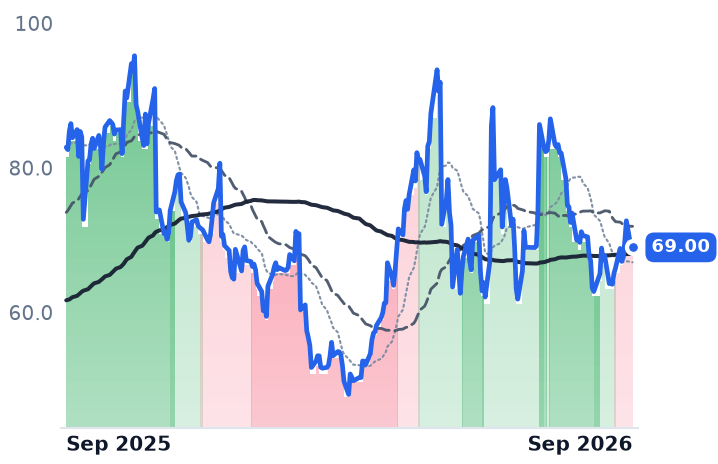
The tape, briefly. Trend-band data for Group 1, Lithia, Penske and Sonic all show a one-day jump from an extreme reading straight to neutral on the day each reported, not a multi-month drift — the opposite of the "gradual" pattern the original screen flagged. Asbury's shift was the least abrupt, beginning a few sessions ahead of its print. That pattern confirms this is an earnings-week reaction cluster, and — for Penske — a deal-pricing event, not a validated multi-month industry re-rating.

The setup

Where it stands — Five of six dealer stocks rose in a four-day earnings window with genuinely mixed results underneath, and Penske trades partly on a pending buyout offer. Would confirm — New- and used-vehicle gross profit per unit stabilizing and parts-and-service same-store gross growing at a high-single-digit rate across Q3 2026 prints. Would invalidate — Group 1's per-unit volumes and gross profit continuing to decline in Q3, or floor-plan interest expense growing faster than gross profit group-wide. Watch next — Penske's special committee response to the $210/share take-private proposal, and Q3 2026 earnings expected in late October 2026. Valuation — Group EV/EBITDA near 8.2x versus the S&P 500's ~15.6x; Lithia alone near 7.3x trailing P/E, both below the group's own multi-year norms on limited data.
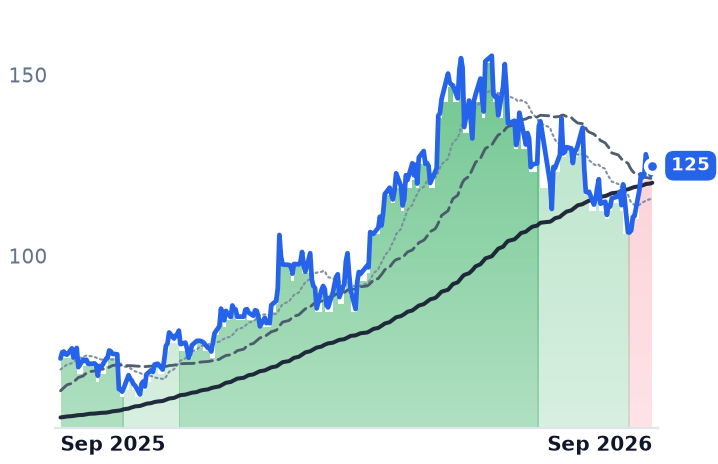
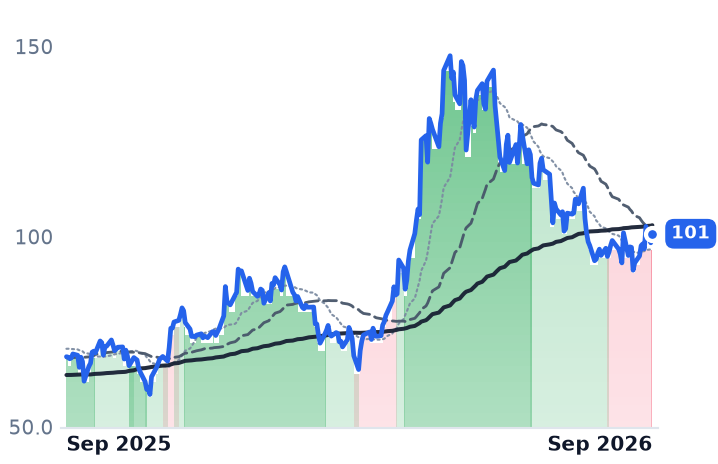
Valuation & fundamentals

TickerMkt capP/EP/E fwdP/SP/S fwdEV/EBITDAFCF yld
ABG$3.3B8.3x7.0x0.2x0.2x8.9x18.0%
AN$6.2B9.4x8.6x0.2x0.2x10.8x-1.7%
GPI$3.7B11.5x7.4x0.2x0.2x8.6x7.5%
LAD$6.0B8.6x7.6x0.2x0.2x7.2x-4.0%
PAG$10.7B11.5x12.0x0.3x0.3x12.4x4.4%
SAH$2.5B22.8x10.9x0.2x0.2x13.4x10.5%

Consensus projections

TickerFY2026EFY2027EFY2028E
ABGRevenue−0.6%+4.5%+7.4%
EPS−8.2%+14.8%+8.7%
ANRevenue−0.3%+3.2%+2.8%
EPS+7.4%+12.8%+8.0%
GPIRevenue+0.7%+3.3%+4.9%
EPS+2.1%+12.5%+10.2%
LADRevenue+2.0%+4.1%+7.2%
EPS−2.7%+17.9%+10.8%
PAGRevenue+5.1%+3.2%+2.2%
EPS+0.2%+6.9%+5.0%
SAHRevenue+2.5%+4.3%+4.9%
EPS+3.0%+9.4%+4.5%

Forward fiscal years only. Blank means no analyst coverage for that year.

Solar Trio Diverges: Sunrun Slides on Tax-Credit Loss, XPLR and Clearway Hold Guidance

Three renewable-power stocks bought together on a bet that solar and storage would capture rising power prices fell an average 10.5% in a month, but the average hides a split: XPLR Infrastructure is actually up and guiding higher, Clearway Energy's miss was weather not cash flow, and only Sunrun is genuinely worse off after losing a federal tax credit.

XIFRCWENRUNENPHBEPILTB Ep 483: Solar & Storage / Marginal-Price BeneficiariesPILTB Ep 483: ower Assets / Solar & Yieldcos (Margin Windfall)ILTB Ep 483: Winners / Solar, Storage & RenewablesAI2: Grid Stabilization, Microgrids & Balance-of-PlantEnergy > Solar > Inverters & Power ElectronicsILTB Ep 483: Nuclear / Large-Scale Reactor BuildoutILTB Ep 483: Nuclear / AP1000 & Fuel CycleILTB Ep 483: Winners / Nuclear Fuel & Components
TickerCompanySegmentTrend30D1Y
XIFRXPLR InfrastructureRenewable & Infrastructure Assets🟢 Cont. Bull−4.3%+29.3%
CWENClearway EnergyWind & Solar Developers⚠️ Emerging Bear−4.1%+1.0%
RUNSunrunResidential Solar Installers⚠️ Emerging Bear−24.4%+1.1%
ENPHEnphase EnergyInverters & Power Electronics🌱 Emerging Bull−15.7%+18.5%
BEPBrookfield Renewable PartnersDiversified Renewable Generators🟢 Cont. Bull−2.8%+26.6%

12-month price & trend

XIFR
XPLR Infrastructure
11.90
+0.04 (+0.34%)
vs. prior close
Price20d50d150d
XIFR 12-month price
Renewable & Infrastructure Assets
CWEN
Clearway Energy
31.73
+0.00 (+0.00%)
vs. prior close
Price20d50d150d
CWEN 12-month price
Wind & Solar Developers
RUN
Sunrun
9.81
+0.29 (+3.05%)
vs. prior close
Price20d50d150d
RUN 12-month price
Residential Solar Installers
ENPH
Enphase Energy
37.54
+0.16 (+0.43%)
vs. prior close
Price20d50d150d
ENPH 12-month price
Inverters & Power Electronics
BEP
Brookfield Renewable Partners
32.86
+0.20 (+0.61%)
vs. prior close
Price20d50d150d
BEP 12-month price
Diversified Renewable Generators

A trio of renewable-power stocks bought on the same thesis — that solar and storage projects would profit as electricity prices rise with data-center demand — fell an average of about 10.5% over the past month. That average, however, describes no single company. One of the three is up double digits and raising its spending plans; another missed on weather, not cash flow; and only the third is dealing with a real, policy-driven hit to its business.

XPLR Infrastructure, a yieldco spun out of NextEra Energy that owns long-term power contracts on wind, solar and Texas gas-pipeline assets, is up 15% over 90 days and nearly 29% over the past year. Its second-quarter adjusted earnings before interest, taxes, depreciation and amortization (EBITDA) came in at $523 million, the company fully repaid $500 million of convertible notes that had been an overhang, and it reaffirmed full-year EBITDA guidance of $1.75-1.95 billion. XPLR trades at 9x trailing earnings and under 1x sales — cheap, not de-rated.

Clearway Energy, which owns and operates a 13.6-gigawatt fleet of contracted wind, solar and gas plants across the country, is down 21% over 90 days, and its trend has genuinely flipped from a sustained uptrend to a sustained downtrend. But the cause is weather, not a broken business model: an El Niño pattern held wind output to 96% of plan and solar to 95% in the first half, pressuring near-term cash available for distribution. Management still reaffirmed full-year 2026 cash-available-for-distribution guidance of $470-510 million and actually raised its 2026-2029 capital-spending plan 20%, to $3 billion. One analyst note argues the stock is now roughly 24% undervalued ahead of its August 5 earnings report, which will confirm or break that guidance.

Sunrun, the largest U.S. residential solar and battery installer, which finances most systems through subscriptions rather than outright sales, is where the pain is real. The federal residential solar tax credit, known as Section 25D, expired entirely on January 1 with no phase-down, and Sunrun's first-quarter subscriber additions fell 25% year over year with installed capacity down 19% and cash generation negative $59 million. The company still guides to $250-450 million of full-year cash generation, and Jefferies argues Sunrun's subscription model could relatively benefit as owner-financed rivals lose the credit entirely — but the near-term numbers back the stock's 48% six-month decline.

Two adjacent names confirm the split rather than resolve it. Enphase Energy, which makes the microinverters and home batteries used in rooftop solar systems, saw revenue fall 19.6% year over year — a real deterioration matching its stock's decline. Brookfield Renewable, a global owner of hydro, wind, solar and battery assets, posted record quarterly funds from operations, up 11% per unit, and is barely down at all — its stock is following its own business, not the group.

The backdrop cuts both ways. The Energy Information Administration expects summer wholesale power prices to fall 8% this year on cheap gas, meaning the near-term "marginal price" catalyst these stocks were bought for hasn't shown up yet. But PJM capacity auction prices, a forward-looking signal of grid tightness from data-center demand, rose 833% year over year — the multi-year thesis remains intact even as 2026 spot prices disappoint.

On valuation: XPLR at 9x trailing earnings and Clearway at roughly 5x sales both sit well below levels that would price in a business break, and both have reaffirmed the guidance a reader can check against the tape. Sunrun's 0.75x sales multiple already reflects distress, leaving less room for further multiple compression even if subscriber growth stays weak.

The setup

Where it stands — XPLR is rising on reaffirmed guidance, Clearway fell on weather with cash-flow guidance intact, and only Sunrun shows a real policy-driven deceleration. Would confirm — Clearway's August 5 print holds $470-510 million CAFD guidance; Sunrun's subscriber adds keep falling below 2025 levels next two quarters. Would invalidate — Clearway cuts CAFD guidance below $470 million, or Sunrun's quarterly cash generation turns positive and subscriber adds stabilize. Watch next — Clearway Energy reports second-quarter results after market close on August 5, 2026. Valuation — XPLR trades at 9x trailing earnings versus its own multi-year range near lows; Clearway at ~5x sales versus a analyst-flagged 24% undervaluation into earnings.

Valuation & fundamentals

TickerMkt capP/EP/E fwdP/SP/S fwdEV/EBITDAFCF yld
XIFR$1.1B17.8x3.5x0.9x0.8x9.0x-56.5%
CWEN$6.5B793.3x4.4x3.9x14.3x9.0%
RUN$2.3B4.0x8.1x0.7x0.8x22.0x-32.1%
ENPH$5.0B36.8x18.5x3.7x4.2x28.4x3.1%
BEP$10.5B54.3x1.7x1.5x9.6x-48.1%

Consensus projections

TickerFY2026EFY2027EFY2028E
XIFRRevenue−0.5%+6.4%+2.4%
EPS−2313.0%−17.3%−43.1%
CWENRevenue+17.0%+11.6%+12.6%
EPS−164.1%−148.8%+63.8%
RUNRevenue+26.6%+7.7%+13.7%
EPS−11.7%−61.6%+54.2%
ENPHRevenue−19.3%+5.7%+11.2%
EPS−27.9%+10.2%+17.8%
BEPRevenue+8.3%+11.0%+0.9%
EPS+22.8%−18.4%−12.6%

Forward fiscal years only. Blank means no analyst coverage for that year.

Analog Chipmakers Fell With Memory Stocks in July Even as Earnings Beat and Guidance Rose

A memory-chip supply scare dragged the whole semiconductor sector down in July, pulling nine analog and mixed-signal chipmakers lower even though Texas Instruments, Analog Devices and Microchip all beat earnings and raised guidance in the same window — a rare case where the tape and the business diverged.

ADITXNMPWRMCHPNXPIONCRUSDIODAOSLTechnology > Semiconductors > Analog & Mixed-SignalData Center: Power Management & Analog ICsSEMI: Fabless / Analog, Auto & SpecialtySEMI: IDMs / Integrated Device ManufacturersPower SemiconductorsAI2: Memory Disaggregation & CXL
TickerCompanySegmentTrend30D1Y
ADIAnalog DevicesAnalog & Mixed-Signal🟢 Cont. Bull−5.5%+67.0%
TXNTexas Instruments IncorporatedAnalog & Mixed-Signal🟢 Cont. Bull−9.1%+54.0%
MPWRMonolithic Power SystemsAnalog & Mixed-Signal🟢 Cont. Bull+5.9%+72.6%
MCHPMicrochip Technology IncorporatedAnalog & Mixed-Signal🟢 Cont. Bull−15.2%+14.0%
NXPINXP SemiconductorsAnalog & Mixed-Signal🟢 Cont. Bull−18.3%+9.6%
ONON SemiconductorAnalog & Mixed-Signal🟢 Cont. Bull−13.8%+70.1%
CRUSCirrus LogicAnalog & Mixed-Signal🟢 Cont. Bull−13.1%+22.5%
DIODDiodes IncorporatedAnalog & Mixed-Signal🟢 Cont. Bull−15.7%+66.4%
AOSLAlpha and Omega SemiconductorAnalog & Mixed-Signal🌱 Emerging Bull−17.0%+21.5%

12-month price & trend

ADI
Analog Devices
367
+0.74 (+0.20%)
vs. prior close
Price20d50d150d
ADI 12-month price
Analog & Mixed-Signal
TXN
Texas Instruments Incorporated
276
−3.02 (−1.08%)
vs. prior close
Price20d50d150d
TXN 12-month price
Analog & Mixed-Signal
MPWR
Monolithic Power Systems
1,426
+110 (+8.35%)
vs. prior close
Price20d50d150d
MPWR 12-month price
Analog & Mixed-Signal
MCHP
Microchip Technology Incorporated
74.29
−0.72 (−0.96%)
vs. prior close
Price20d50d150d
MCHP 12-month price
Analog & Mixed-Signal
NXPI
NXP Semiconductors
229
−16.00 (−6.53%)
vs. prior close
Price20d50d150d
NXPI 12-month price
Analog & Mixed-Signal
ON
ON Semiconductor
81.61
−2.13 (−2.54%)
vs. prior close
Price20d50d150d
ON 12-month price
Analog & Mixed-Signal
CRUS
Cirrus Logic
129
−4.51 (−3.37%)
vs. prior close
Price20d50d150d
CRUS 12-month price
Analog & Mixed-Signal
DIOD
Diodes Incorporated
82.32
−0.30 (−0.36%)
vs. prior close
Price20d50d150d
DIOD 12-month price
Analog & Mixed-Signal
AOSL
Alpha and Omega Semiconductor
31.74
+1.13 (+3.69%)
vs. prior close
Price20d50d150d
AOSL 12-month price
Analog & Mixed-Signal

What happened

Nine chipmakers that supply the analog and mixed-signal semiconductors inside cars, factory equipment and phones — the chips that manage power, voltage and real-world signals rather than raw computing — have gained an average of 43% over the past year. But in July they gave most of that recent momentum back together, falling an average of 13% in 30 days. The trigger was not a slowdown in their own end markets. It was a scare in an unrelated part of the chip industry: memory. Samsung's record profit still missed elevated expectations, SK Hynix said it would raise 2026 capital spending 50% to at least $31 billion, and a Shanghai stock debut by Chinese memory maker CXMT reignited fears of oversupply, and the Philadelphia Semiconductor Index fell roughly 19% for the month, its worst since 2008, with every member stock below its 50-day average. Analog names were swept along even though most had nothing to do with memory chips or AI data-center capex.

The businesses, and what's diverging

Texas Instruments (TXN), which makes analog chips that regulate power and signals in industrial gear, cars and consumer electronics, reported second-quarter revenue up 23% year over year to $5.46 billion, beating estimates, with analog revenue up 26%, gross margin up 340 basis points to 61%, and third-quarter guidance raised, with management saying automotive demand is "turning more clearly upward". Analog Devices (ADI), a maker of sensors and signal-processing chips for factory automation, autos and communications equipment, posted book-to-bill well above one and record bookings across its industrial, automotive and communications customers, guiding to roughly $3.9 billion in third-quarter revenue. Microchip Technology (MCHP), which sells microcontrollers and analog chips to industrial, automotive and aerospace customers, guided next-quarter sales up 35% year over year and gross margin to 62-63%, consistent with the inventory correction that has weighed on distributors finally clearing. All three beat and raised guidance in the very window their stocks fell — the clearest sign this is a sector-wide macro rotation, not a verdict on analog demand.

Two names complicate a clean read. Monolithic Power Systems (MPWR), which designs power-management chips including for Nvidia's AI servers, was the only one of the nine to rise in July (+7%), after second-quarter revenue jumped 48% on 164% growth in its AI/server power business; its 70%-plus year-to-date gain has outrun even Nvidia's, meaning its slice of the sector's one-year gain is an AI story wearing an analog label, not evidence the broader auto/industrial cycle has turned. NXP Semiconductors (NXPI), a major supplier of automotive and communications-infrastructure chips, is the genuine laggard: it posted a weak outlook with communications-infrastructure revenue down 27% and industrial/IoT down 11%, hurt by a prolonged glut of EV chips outside China, and it was also July's worst-hit name (-18%) — fundamentals and tape agreeing for once. ON Semiconductor (ON), which makes power chips and silicon-carbide components for electric vehicles, sits between: the desk's own notes describe silicon-carbide device demand still in a correction after the 2024 EV slowdown, even as ON remains the profitable, vertically integrated operator among loss-making SiC peers. The remaining three — Cirrus Logic (CRUS), a fabless maker of audio and power chips mostly for smartphones; Diodes Incorporated (DIOD), which makes discrete diodes and small-signal chips for industrial and consumer electronics; and Alpha and Omega Semiconductor (AOSL), a smaller power-semiconductor maker — fell the hardest in July (-12% to -27%) with limited fresh earnings news, largely riding the sector-wide de-rating.

Valuation and the setup

On the desk's most recent valuation snapshots (dated May 2026, ahead of the Q2 beats, so likely understating today's earnings base), ADI traded near 76x trailing/36x forward earnings, TXN near 50x trailing/38x forward, and MPWR near 118x trailing/67-70x forward — a level MPWR's own risk notes call "no margin for error." MCHP and ON carry no meaningful trailing P/E because earnings are still near trough, trading instead on price-to-sales (11.2x and 6.5x). If the Q2 beats hold, forward multiples on normalized earnings are cheaper than these trailing figures suggest — but that recomputation could not be confirmed directly, since detailed financial statements could not be pulled for eight of the nine names this round. Trend bands show the whole group falling in lockstep from strong or mild uptrends to neutral by July 31 — a synchronized, non-violent de-rating that matches a macro rotation rather than a company-specific breakdown. Verdict: CONFIRMS a genuine recovery at TXN, ADI and MCHP, where earnings and bookings improved as the stocks fell — a real dislocation between business and tape. INCONCLUSIVE for MPWR (AI-power strength papering over its own stretched multiple) and CONTRADICTS at NXPI, where soft auto-chip demand matches the weak stock.

The setup

Where it stands — Nine analog chipmakers fell with the broader semiconductor sector in July even as TXN, ADI and MCHP beat earnings and raised guidance. Would confirm — TXN, ADI and MCHP book-to-bill stays above 1.0 and industrial/auto revenue keeps growing sequentially next quarter. Would invalidate — Distributor inventory or book-to-bill rolls back below 1.0, or NXPI's auto/comms revenue declines persist into a second quarter. Watch next — Texas Instruments' Q3 2026 print (guided $5.65-6.15B revenue) and Analog Devices' Q3 FY26 results (guided ~$3.9B). Valuation — ADI ~36x forward, TXN ~38x forward, MPWR ~67-70x forward versus roughly 30-50x trailing medians a year ago; MCHP/ON trade on price-to-sales given near-trough earnings.

Valuation & fundamentals

TickerMkt capP/EP/E fwdP/SP/S fwdEV/EBITDAFCF yld
ADI$203.8B75.4x36.4x17.3x14.5x37.9x2.2%
TXN$275.5B51.3x39.8x14.9x13.2x34.6x1.4%
MPWR$76.2B112.7x65.1x25.8x20.7x87.1x0.8%
MCHP$50.8B251.3x29.8x10.8x8.2x55.1x1.6%
NXPI$73.6B27.8x19.9x5.8x5.2x18.1x4.0%
ON$44.3B77.7x36.9x7.3x6.9x37.3x3.3%
CRUS$8.1B19.6x17.9x4.1x3.9x14.9x7.8%
DIOD$4.6B53.7x38.1x3.0x2.6x17.1x2.8%
AOSL$1.2Bn/m1.7x1.7x52.0x-5.2%

Consensus projections

TickerFY2026EFY2027EFY2028E
ADIRevenue+28.0%+10.3%+12.3%
EPS+47.8%+15.4%+18.5%
TXNRevenue+18.3%+11.3%+9.4%
EPS+38.9%+16.8%+12.1%
MPWRRevenue+32.1%+22.6%+14.4%
EPS+34.4%+26.0%+15.6%
MCHPRevenue+6.2%+32.3%+15.4%
EPS+20.7%+100.8%+29.7%
NXPIRevenue+14.6%+10.6%+8.1%
EPS+24.5%+19.5%+16.8%
ONRevenue+7.5%+10.8%+11.0%
EPS+31.4%+38.0%+30.2%
CRUSRevenue+7.5%+5.6%+3.7%
EPS+28.5%−1.8%+5.4%
DIODRevenue+20.3%+15.9%
EPS+124.2%+76.4%
AOSLRevenue−1.9%+4.4%+18.5%
EPS−382.8%−10.7%−415.6%

Forward fiscal years only. Blank means no analyst coverage for that year.

Latin America's Market Boom Bypasses MercadoLibre, Sea and Coupang — Unevenly

Regional stock funds tracking Brazil, Mexico and Argentina have rallied about 34% over the past year on commodities and rate cuts, while the three big emerging-market e-commerce companies fell an average 32.8% — but MercadoLibre's revenue accelerated even as its stock fell, Sea just inflected higher, and only Coupang's decline lines up with a real earnings break.

MELISECPNGILFEWZEWZSBRZUEWWARGTECHEcommerceRegional ETFs / LatAmEmerging MarketsArgentina / ADRs & Merval leadersFinancial Services
TickerCompanySegmentTrend30D1Y
MELIMercadoLibreOnline Marketplaces🔴 Cont. Bear+4.0%−21.6%
SESeaOnline Marketplaces🔴 Cont. Bear+1.7%−31.9%
CPNGCoupangRegional/Niche E-commerce🔴 Cont. Bear−14.6%−44.8%
ILFiShares Latin America 40 ETFAsset Management - Global⚠️ Emerging Bear+3.6%+45.0%
EWZiShares MSCI Brazil ETFAsset Management⚠️ Emerging Bear+5.0%+40.9%
EWZSiShares MSCI Brazil Small-Cap ETFAsset Management⚠️ Emerging Bear+1.1%+13.3%
BRZUDirexion Daily MSCI Brazil Bull 2X ETFAsset Management - Leveraged⚠️ Emerging Bear+9.4%+79.1%
EWWiShares MSCI Mexico ETFAsset Management - Global🟢 Cont. Bull+0.5%+32.2%
ARGTGlobal X - MSCI Argentina ETFAsset Management - Global🌱 Emerging Bull+1.2%+15.8%
ECHiShares MSCI Chile ETFAsset Management⚠️ Emerging Bear−0.8%+30.5%

12-month price & trend

MELI
MercadoLibre
1,878
−7.78 (−0.41%)
vs. prior close
Price20d50d150d
MELI 12-month price
Online Marketplaces
SE
Sea
107
+0.50 (+0.47%)
vs. prior close
Price20d50d150d
SE 12-month price
Online Marketplaces
CPNG
Coupang
16.35
+0.26 (+1.62%)
vs. prior close
Price20d50d150d
CPNG 12-month price
Regional/Niche E-commerce
ILF
iShares Latin America 40 ETF
35.37
−0.01 (−0.03%)
vs. prior close
Price20d50d150d
ILF 12-month price
Asset Management - Global
EWZ
iShares MSCI Brazil ETF
36.65
+0.12 (+0.33%)
vs. prior close
Price20d50d150d
EWZ 12-month price
Asset Management
EWZS
iShares MSCI Brazil Small-Cap ETF
13.21
−0.03 (−0.23%)
vs. prior close
Price20d50d150d
EWZS 12-month price
Asset Management
BRZU
Direxion Daily MSCI Brazil Bull 2X ETF
99.50
+0.97 (+0.98%)
vs. prior close
Price20d50d150d
BRZU 12-month price
Asset Management - Leveraged
EWW
iShares MSCI Mexico ETF
76.81
−0.30 (−0.39%)
vs. prior close
Price20d50d150d
EWW 12-month price
Asset Management - Global
ARGT
Global X - MSCI Argentina ETF
95.15
−1.00 (−1.04%)
vs. prior close
Price20d50d150d
ARGT 12-month price
Asset Management - Global
ECH
iShares MSCI Chile ETF
39.33
−0.49 (−1.23%)
vs. prior close
Price20d50d150d
ECH 12-month price
Asset Management

What happened

Over the past twelve months, exchange-traded funds tracking Brazilian, Mexican and Argentine stocks have rallied hard — a mix of the funds tracking Brazil (EWZ), a small-cap Brazil fund (EWZS), a 3x-leveraged Brazil fund (BRZU), broad Latin America (ILF), Mexico (EWW), Argentina (ARGT) and Chile (ECH) rose a simple average of roughly 34%, led by BRZU's leveraged 76% gain and ILF's 42%. Over the identical window, the region's three largest online-commerce companies — MercadoLibre, Sea and Coupang — fell an average of 32.8%. That is a roughly 65-to-70 point gap between the indices and the companies that, in theory, sell into the same growing consumer markets. The gap is real, but it is not one story: the three stocks fell for three different reasons, and one of them barely fell at all relative to how much its business grew.

The ETF rally is a commodities-and-rates story, not an e-commerce one

The Brazilian stock index that anchors most of these funds is dominated by the oil producer Petrobras, miner Vale, and banks Itaú Unibanco and Bradesco, along with brewer Ambev and industrial group WEG — names tied to commodity prices, interest-rate policy and bank lending, not online retail. Brazil's central bank has cut its benchmark Selic rate three straight times to 14.25% through mid-2026, and the Ibovespa has traded near record highs as the Brazilian real strengthened roughly 8% year-to-date. That currency strength is a genuine, if partial, tailwind for MercadoLibre's dollar-reported results, but it is a small piece of what is driving fund returns dominated by oil, mining and banking. Brazilian markets have also rallied specifically on rate-cut expectations — a dynamic with no direct read-through to how many packages get shipped in São Paulo.

Three companies, three different stories

MercadoLibre, which runs Latin America's largest online marketplace alongside the Mercado Pago digital-payments and lending business, fell the least of the three (-21.6%) despite the best fundamentals: first-quarter 2026 revenue accelerated to 49% year-over-year growth — its fastest pace in four years — with gross merchandise volume up 42%. Operating margin compressed to 6.9% from 12.9%, but management framed that as deliberate investment in free shipping and 2.7 million new credit cards issued in the quarter, not weakening demand; the stock still fell 13% the day after that earnings report. Its forward valuation compressed from 3.8x to 2.1x expected sales over the same period growth accelerated — a multiple falling as the business speeds up. The credit book, at $14.6 billion and growing 87% year-over-year, carries a greater-than-90-day delinquency rate near 17.6%, but those loan vintages are still too new to show their true loss rate. Investor Michael Burry disclosed a new MercadoLibre stake in the $1,500s-$1,600s in May. Verdict: business CONTRADICTS the sell-off (growth accelerated); valuation is INCONCLUSIVE pending the credit book seasoning.

Sea, which owns Southeast Asia's Shopee marketplace, the Garena gaming unit and the Monee digital-lending arm, fell 31.9% over the full year but has recently reversed. First-quarter Shopee volume grew 30%, the Monee loan book expanded 70% to $9.9 billion with stable asset quality, and total revenue rose 47%. The stock jumped 13.7% on that report, enough to flip its trend to an uptrend in late July after months in a downtrend. Verdict: business CONFIRMS a recent, not full-year, turn — the year's decline predates the current improvement.

Coupang, the South Korean e-commerce and grocery-delivery company also pushing into Taiwan, food delivery and fashion resale through Farfetch, fell the most (-44.8%) and is the one name whose stock move matches a genuine earnings break. It swung to a $266 million net loss after issuing $1.2 billion in customer vouchers tied to a data breach that exposed roughly 34 million accounts — about two-thirds of South Korea's population — and now faces a regulatory fine of up to $900 million; its Developing Offerings losses nearly doubled to $329 million even as that segment's revenue grew 28%. The stock trades at 0.90x trailing sales with no price-to-earnings multiple to speak of, and consensus price targets near $27-35 versus a roughly $16 share price imply the market sees the breach costs as largely one-off. Verdict: business CONFIRMS the decline; valuation leans toward POSSIBLE DISLOCATION if the fine and vouchers prove transitory.

The technical picture agrees only partly

Despite trailing twelve-month gains, several LatAm funds — EWZ, EWZS, ECH and BRZU — have actually rolled into short-term downtrends as of July 31, meaning the rally has already cooled even before any e-commerce comparison. MercadoLibre and Coupang remain in mild downtrends; Sea alone sits in an uptrend, confirming its post-earnings turn rather than the full-year decline.

The setup

Where it stands — MercadoLibre's revenue growth is accelerating while its multiple compresses; Coupang's loss is fundamental; Sea has just inflected higher. Would confirm — MercadoLibre's >90-day loan delinquency rate stabilizing below 17.6% as 2025-26 credit vintages season. Would invalidate — MercadoLibre's operating margin failing to recover toward 10%+ by FY2027 as UBS's base case assumes. Watch next — Coupang's next earnings for confirmation the Korean regulatory fine, up to $900 million, is finalized rather than open-ended. Valuation — MELI trades at 2.1x forward EV/Revenue (from 3.8x) and 48x trailing P/E; CPNG at 0.90x trailing sales with no P/E.

Valuation & fundamentals

TickerMkt capP/EP/E fwdP/SP/S fwdEV/EBITDAFCF yld
MELI$95.2B49.6x47.7x3.0x2.3x30.7x11.2%
SE$64.1B39.8x30.5x2.5x2.1x22.8x5.2%
CPNG$29.3Bn/m0.8x0.8x38.4x1.0%
ILF$2.4B
EWZ$7.4B
EWZS$145.3M
BRZU$105.4M
EWW$2.0B
ARGT$860.6M
ECH$1.0B

Consensus projections

TickerFY2026EFY2027EFY2028E
MELIRevenue+42.2%+27.7%+23.1%
EPS−2.6%+43.1%+38.6%
SERevenue+34.8%+21.4%+16.5%
EPS+10.0%+39.2%+26.9%
CPNGRevenue+6.8%+14.5%+11.2%
EPS−276.9%−221.2%+113.7%

Forward fiscal years only. Blank means no analyst coverage for that year.

Nuclear Stocks Sink in Unison, But Cameco and BWXT's Own Numbers Keep Improving

Twelve uranium, enrichment and small-reactor stocks flipped to a synchronized multi-month downtrend, but the sell-off splits cleanly: Cameco and BWX Technologies fell even as their earnings and backlogs grew, while NuScale, Oklo and Lightbridge remain pre-revenue and, on a price-to-sales basis, no cheaper than before the drop.

CCJLEUUECBWXTSMROKLOLTBRURANUKZURNMURNJNLRAI2: Nuclear Fuel Cycle & SMRNUCLEAR: ETFs / Nuclear & UraniumNUCLEAR: Fuel / Fabrication & Advanced FuelsNuclearNUCLEAR: Uranium / Miners & ExplorersData Center: SMR / Advanced Nuclear & UraniumILTB Ep 483: Nuclear / Large-Scale Reactor BuildoutILTB Ep 483: Nuclear / AP1000 & Fuel CycleILTB Ep 483: Winners / Nuclear Fuel & ComponentsNUCLEAR: Uranium / Conversion & EnrichmentSPACE: Propulsion & Launch StructuresNUCLEAR: Reactors / OEMs & SMR Developers
TickerCompanySegmentTrend30D1Y
CCJCamecoUranium⚠️ Emerging Bear−11.4%+15.0%
LEUCentrus EnergyUranium⚠️ Emerging Bear+1.5%−15.8%
UECUranium EnergyUranium⚠️ Emerging Bear−9.3%+4.2%
BWXTBWX TechnologiesNaval & Shipbuilding⚠️ Emerging Bear−14.3%+9.6%
SMRNuScale PowerAdvanced Nuclear🔴 Cont. Bear−12.4%−80.6%
OKLOOkloEmerging & Specialized Energy⚠️ Emerging Bear−25.1%−49.2%
LTBRLightbridgeElectrical Equipment & Parts⚠️ Emerging Bear−7.6%−41.9%
URAGlobal X - Uranium ETFAsset Management⚠️ Emerging Bear−11.0%+3.7%
NUKZRange Nuclear Renaissance Index ETFAsset Management⚠️ Emerging Bear−5.6%+7.1%
URNMSprott Uranium Miners ETFAsset Management⚠️ Emerging Bear−9.3%+8.2%
URNJSprott Junior Uranium Miners ETFAsset Management⚠️ Emerging Bear−9.8%+10.2%
NLRVanEck Uranium and Nuclear ETFAsset Management⚠️ Emerging Bear−8.3%−5.9%

12-month price & trend

CCJ
Cameco
86.38
−1.85 (−2.10%)
vs. prior close
Price20d50d150d
CCJ 12-month price
Uranium
LEU
Centrus Energy
177
+0.18 (+0.10%)
vs. prior close
Price20d50d150d
LEU 12-month price
Uranium
UEC
Uranium Energy
9.60
−0.14 (−1.44%)
vs. prior close
Price20d50d150d
UEC 12-month price
Uranium
BWXT
BWX Technologies
169
+3.11 (+1.88%)
vs. prior close
Price20d50d150d
BWXT 12-month price
Naval & Shipbuilding
SMR
NuScale Power
8.42
−0.18 (−2.09%)
vs. prior close
Price20d50d150d
SMR 12-month price
Advanced Nuclear
OKLO
Oklo
38.83
−2.26 (−5.50%)
vs. prior close
Price20d50d150d
OKLO 12-month price
Emerging & Specialized Energy
LTBR
Lightbridge
8.24
−0.20 (−2.37%)
vs. prior close
Price20d50d150d
LTBR 12-month price
Electrical Equipment & Parts
URA
Global X - Uranium ETF
39.07
−0.65 (−1.64%)
vs. prior close
Price20d50d150d
URA 12-month price
Asset Management
NUKZ
Range Nuclear Renaissance Index ETF
63.68
−0.13 (−0.20%)
vs. prior close
Price20d50d150d
NUKZ 12-month price
Asset Management
URNM
Sprott Uranium Miners ETF
48.57
−0.88 (−1.78%)
vs. prior close
Price20d50d150d
URNM 12-month price
Asset Management
URNJ
Sprott Junior Uranium Miners ETF
21.64
−0.39 (−1.77%)
vs. prior close
Price20d50d150d
URNJ 12-month price
Asset Management
NLR
VanEck Uranium and Nuclear ETF
107
−1.53 (−1.41%)
vs. prior close
Price20d50d150d
NLR 12-month price
Asset Management

Twelve stocks tied to nuclear fuel, uranium mining and small reactors have all rolled over together since February, a synchronized breakdown rare enough to suggest a shared cause. But the businesses behind the tickers are not moving together at all: the two companies with the strongest quarterly results — a uranium miner and a naval-reactor contractor — have fallen the hardest in percentage terms even as their own numbers improved, while the pre-revenue reactor developers whose stocks have collapsed the most were already trading on valuations no amount of selling has meaningfully fixed.

Miners with growing earnings, falling multiples. Cameco, the world's No. 2 uranium miner and 49% owner of reactor-maker Westinghouse Electric, reported first-quarter net income up 88% year over year and held its 2026 production guidance of 19.5-21.5 million pounds of uranium oxide despite a brief spring suspension at its Cigar Lake mine. Its stock fell 29.2% over the three months to July 31 anyway, dragging its trailing price-to-earnings ratio down from roughly 104-117x in May to 79.8x now — a valuation compression happening alongside, not because of, weaker fundamentals. BWX Technologies, whose naval reactor-manufacturing business is a sole-source, security-cleared franchise for the U.S. Navy, grew its backlog to $8.65-8.7 billion (up 77-119% year over year) and posted 26% revenue growth in the first quarter, yet its stock fell 22.3% over the same three months, pulling its P/E from the mid-50s to 42x. Both stocks remain up 12-18% over the trailing twelve months — the multi-month decline has trimmed their 2026 gains, not erased them.

Enrichers and developers: a mixed and mostly unresolved de-rating. Centrus Energy, the sole U.S.-licensed commercial producer of the high-assay low-enriched uranium (HALEU) used in advanced reactors, signed a $900 million fixed-price Department of Energy contract on June 30 for new enrichment capacity at its Piketon, Ohio site, and completed a prior demonstration deal with more than 1,900 kilograms delivered ahead of schedule, per PR Newswire. Its stock still rose 9.1% over the past month even while carrying a downtrend, but its P/E of roughly 62x is little changed from May because 2026 earnings guidance was itself cut about 37%. Uranium Energy Corp, which mined 45,743 pounds of uranium oxide in its latest quarter at an all-in cost of $44.14 a pound per PR Newswire, has seen its price-to-sales ratio fall from roughly 350-373x to about 225x — still far outside any normal anchor for a company with roughly $20 million in quarterly revenue. NuScale Power, the only federally certified small modular reactor design, posted $31.5 million of 2025 revenue, down 15% year over year, with losses widening to about $356 million; its stock has fallen 81% over twelve months, yet its price-to-sales multiple actually rose, to about 161x from 121x, because dilution and declining trailing revenue outpaced the price drop. Oklo, the Sam Altman-backed reactor developer, has a pipeline exceeding 14 gigawatts built mostly on non-binding letters of intent, alongside a binding 12-gigawatt agreement with data-center operator Switch and a Meta prepayment for an Ohio campus, but licensing and first commercial power remain targeted for 2027-2028, per Utility Dive; its stock fell 28% in a single month, per 24/7 Wall St.. Lightbridge, an advanced-fuel developer, has had zero revenue in every quarter since mid-2024, raised $176 million through a drip-feed share sale in 2025, and grew its diluted share count 121% in five quarters to fund a $23-million annual cash burn against $201.9 million in cash.

Funds held up better than the stocks driving the story. Among the five nuclear-themed exchange-traded funds tracked, the Range Nuclear Renaissance fund (NUKZ) fell just 4.3% over the past month and 12.3% over three months — the shallowest drawdown in the group and still up 8.8% over twelve months — while the broader uranium-miner and nuclear funds (URA, URNM, URNJ, NLR) fell 7-9% on the month and 26-31% over three months. VanEck's own research attributes the broader sell-off to macro risk-off sentiment and fading artificial-intelligence-power narratives rather than any change in uranium's physical supply-demand balance, per VanEck. Spot uranium prices consolidated near $84-87 a pound after peaking above $101 in January, while long-term contract prices climbed to a record near $97 a pound, a backwardation more consistent with a healthy physical market than a rolling-over one, per Discovery Alert. The one incremental supply risk flagged by analysts is Kazakhstan's state miner guiding 2026 output up about 9%, which BMO's Alexander Pearce said could put "modest pressure" on prices via a slightly smaller supply deficit, per Mining.com.

Technicals. All twelve tickers held a sustained uptrend through February 2026 before flipping to a sustained downtrend by late July, with Cameco and BWX Technologies breaking that trend on the 90-, 180- and 365-day views simultaneously — a synchronized, gradual rollover rather than a single-name shock, and one that has so far cut into, but not erased, their year of gains.

The setup

Where it stands — Twelve nuclear-linked stocks share a synchronized multi-month downtrend, but Cameco and BWX Technologies' earnings and backlogs grew through it. Would confirm — Cameco's or BWX Technologies' P/E keeps compressing toward pre-2024 levels while their production and backlog guidance still rises next quarter. Would invalidate — Spot uranium prices break decisively below $80 a pound or utility long-term contracting volumes visibly slow in coming quarterly reports. Watch next — NuScale's and Oklo's next quarterly filings for whether letters of intent convert into funded, binding construction contracts. Valuation — Cameco trades at 79.8x trailing earnings versus 104-117x in May; NuScale's price-to-sales rose to 161x from 121x despite an 81% twelve-month price decline.

Valuation & fundamentals

TickerMkt capP/EP/E fwdP/SP/S fwdEV/EBITDAFCF yld
CCJ$37.6B148.0x52.9x15.2x10.7x61.0x1.0%
LEU$3.4B53.8x67.3x7.4x7.2x30.1x-1.8%
UEC$4.8Bn/m235.2x47.3xn/m-2.5%
BWXT$15.5B44.7x35.8x4.6x4.1x29.8x2.1%
SMR$2.5Bn/m134.6x58.0xn/m-30.0%
OKLO$6.8Bn/mn/mn/m-2.3%
LTBR$289.6Mn/mn/mn/m-5.4%
URA$3.9B
NUKZ$489.1M
URNM$1.1B
URNJ$207.8M
NLR$2.6B

Consensus projections

TickerFY2026EFY2027EFY2028E
CCJRevenue+2.8%+10.7%+9.4%
EPS+13.8%+62.5%+20.5%
LEURevenue+3.5%+4.3%−12.9%
EPS−41.4%+1.3%−24.1%
UECRevenue−59.3%+272.6%+157.9%
EPS+64.5%−79.8%−647.6%
BWXTRevenue+19.7%+9.4%+7.5%
EPS+23.2%+11.1%+11.2%
SMRRevenue+3.5%+263.3%+80.2%
EPS−73.9%+26.1%−20.2%
OKLORevenue+359.5%+731.8%
EPS+20.1%+13.8%+10.2%

Forward fiscal years only. Blank means no analyst coverage for that year.

Sources (24)

Also checked against 9 price-database queries, 6 research notes, 2 company-fundamentals reads in the author's own data.

Originating hypothesis

category emerging bear with confirmed multi month band breakdown · category: AI2: Nuclear Fuel Cycle & SMR, NUCLEAR: ETFs / Nuclear & Uranium, NUCLEAR: Fuel / Fabrication & Advanced Fuels

Three separate ★3 nuclear buckets on the user's watchlist have flipped to turning bearish at the same time — "AI2: Nuclear Fuel Cycle & SMR" (CCJ, LEU, UEC, BWXT all starred, plus SMR and OKLO) down 11.8% over 30 days and 19.4% over a year, "NUCLEAR: ETFs / Nuclear & Uranium" (URA starred, plus NUKZ, URNM, URNJ, NLR) down 8.8% on the month, and "NUCLEAR: Fuel / Fabrication & Advanced Fuels" (BWXT, LTBR) down 11.0% on the month against a -16.1% year, all at gradual intensity with no violent single-name distortion — and the bands underneath say this is a slow, multi-month structural de-rating rather than a wobble: both Cameco and BWXT have gone strongly bullish → strongly bearish on the 90-, 180- AND 365-day views and were downgraded mildly bearish → strongly bearish again inside the last 30 days, while NuScale is down 80.6% over twelve months, so the question is whether the uranium and small-modular-reactor complex has genuine further downside left from CURRENT prices on validatable fundamentals (spot versus long-term uranium contract prices and the pace of utility long-term contracting, Cameco's McArthur River/Key Lake and Cigar Lake production guidance against its Westinghouse equity-accounted earnings and the Kazatomprom supply response, Centrus's HALEU deliveries and DOE contract awards versus its enrichment order book, UEC's actual pounds produced versus its inventory-and-permits story, BWXT's naval-propulsion and government-segment backlog as the one genuinely contracted revenue stream in the group, whether announced SMR power-purchase agreements at OKLO and SMR are converting into funded construction or remain non-binding letters of intent with NRC licensing timelines that slip past 2030, plus cash burn, ATM issuance and dilution schedules at the pre-revenue developers), or whether a cohort that already gave back a year of gains is an oversold capitulation in a fuel cycle whose physical supply deficit and datacenter demand pull have not changed at all — with the ETFs' shallower drawdown suggesting the pain is concentrated in the speculative SMR developers rather than the producers.

CMS's Milder CY2027 Home-Health Rule Sparks Rally, But Cohort Story Splits Five Ways

A friendlier CMS home-health payment rule triggered a synchronized late-July rally across five post-acute names, but the cohort's +54.1% one-year figure is dominated by a private-equity buyout and a distressed-base rebound — Option Care Health is still down over the year despite steady earnings, while Addus HomeCare's growth is decelerating into its August 3 print.

ADUSAVAHCHEEHABOPCHHealthcare > Medical - Care Facilities > Home Health & Hospice
TickerCompanySegmentTrend30D1Y
ADUSAddus HomeCareHome Health & Hospice🔴 Cont. Bear+9.2%+8.0%
AVAHAveanna HealthcareHome Health & Hospice🟢 Cont. Bull−1.5%+145.8%
CHEChemedHome Health & Hospice🌱 Emerging Bull+10.8%+26.2%
EHABEnhabitHome Health & Hospice🟢 Cont. Bull+109.1%
OPCHOption Care HealthHome Health & Hospice🔴 Cont. Bear+7.8%−18.5%

12-month price & trend

ADUS
Addus HomeCare
115
−1.02 (−0.88%)
vs. prior close
Price20d50d150d
ADUS 12-month price
Home Health & Hospice
AVAH
Aveanna Healthcare
9.39
−0.35 (−3.59%)
vs. prior close
Price20d50d150d
AVAH 12-month price
Home Health & Hospice
CHE
Chemed
532
−3.06 (−0.57%)
vs. prior close
Price20d50d150d
CHE 12-month price
Home Health & Hospice
EHAB
Enhabit
Price20d50d150d
EHAB 12-month price
Home Health & Hospice
OPCH
Option Care Health
23.03
+0.57 (+2.54%)
vs. prior close
Price20d50d150d
OPCH 12-month price
Home Health & Hospice

A rule change explains the timing, not the cohort's substance

The five-name post-acute cohort in this Healthcare > Medical - Care Facilities > Home Health & Hospice sample — Addus HomeCare, Aveanna Healthcare, Chemed, Enhabit and Option Care Health — carries a headline gain of +54.1% over twelve months. That number is real but misleading: it blends a private-equity buyout, a distressed-balance-sheet rebound, one clean fundamental beat, and one stock still down for the year despite steady earnings.

Every active name's trend band was bearish for most of the first half of 2026 and flipped bullish almost simultaneously in the back half of July — a pattern that lines up with CMS's newly proposed CY2027 home health payment rule, which for the first time since 2022 drops the recurring "behavioral adjustment" cut, instead proposing a temporary -3.0% adjustment against a net +2.4% aggregate payment increase, Applied Policy reports. That is a genuine, dateable catalyst — but a two-to-four-week-old one, not confirmation of a mature re-rating.

Five names, five different stories

Enhabit, a home health and hospice operator spun off from Encompass Health in 2022, no longer trades: Kinderhook Industries agreed in February 2026 to take it private for $13.80/share cash, a roughly 24% premium, and the deal closed in May 2026 — its prior-year "gain" reflects a buyout price, not a functioning market.

Chemed, whose VITAS Healthcare hospice segment sits alongside its unrelated Roto-Rooter plumbing business, is the cleanest fundamental story: second-quarter revenue rose 8.8% year-over-year to $673.3M, VITAS admissions rose 9% and average daily census hit a record above 24,000 in second-quarter results, while Florida's Medicare-cap overhang eased and full-year VITAS census guidance was raised, even as Roto-Rooter faced rising customer-acquisition costs. Chemed trades at a trailing 23.8x, forward 17.5x, with adjusted EBITDA margin guided to 21.5%-22.5% — a reasonable multiple against raised guidance, closer to a supported advance than a stretched one.

Aveanna Healthcare, a pediatric and adult private-duty nursing and home-health provider, raised 2026 guidance after closing the Family First Homecare deal and cut leverage from above 11x to under 3.8x, with ten state Medicaid rate enhancements won in 2025. Its 136% one-year gain, though, comes off a genuinely distressed $3.97 base; at a 13.9x forward multiple it also carries a wide dispersion of valuation opinion, with one model flagging it as significantly overvalued.

Option Care Health, the largest independent home and alternate-site infusion therapy provider, is the outlier: shares are still down 21.5% over twelve months and only exited a bearish trend band in the final days of July. Yet second-quarter revenue grew roughly 2% to $1.4bn and adjusted EBITDA rose 3%, guidance was maintained, and the company repurchased $150M of stock — against a forward multiple near 12.2x, below both Chemed's and its own prior trailing multiple. That combination — a still-depressed price, stable-to-growing earnings, and no visible deterioration — is closer to a dislocation than a confirmed re-rating.

Addus HomeCare, a Medicaid-funded personal home-care and hospice provider, sits opposite: revenue growth decelerated sharply to 7.7% from 21.8% in its most recent quarter, missing estimates, and analysts cut price targets citing regulatory and M&A uncertainty — even as its trend band flipped bullish only two weeks ago. State rate increases have helped (Illinois +3.9%), but Medicaid tightening under the federal budget law is projected to cut enrollment by roughly 7.6 million people by 2034, a structural headwind for its core volumes. Addus reports Q2 results on August 3.

Sector-wide, Medicare Advantage penetration crossed 54% in 2025 and is pushing volume from skilled nursing into the home, though MA rates run 10-15% below fee-for-service, compressing margins even as volume rises — consolidation appetite remains real, illustrated by UnitedHealth's $3.3bn Amedisys close last August alongside the Enhabit deal.

The setup

Where it stands — Cohort trend bands flipped bullish together in late July after a milder CMS CY2027 rule; fundamentals diverge sharply by name. Would confirm — Addus's August 3 print shows revenue growth stabilizing and Option Care's next quarter sustains EBITDA growth with maintained guidance. Would invalidate — Addus growth decelerates further or Option Care's trend band reverses back into a bearish reading within weeks. Watch next — Addus HomeCare reports Q2 2026 results August 3, 2026; CMS finalizes the CY2027 home health rule later this year. Valuation — CHE 23.8x trailing/17.5x forward; AVAH 13.9x forward; OPCH ~12.2x forward versus its own higher trailing multiple; ADUS ambiguous pending Q2.

Valuation & fundamentals

TickerMkt capP/EP/E fwdP/SP/S fwdEV/EBITDAFCF yld
ADUS$1.7B16.9x13.0x1.2x1.1x10.9x8.1%
AVAH$1.7B6.3x11.5x0.7x0.6x9.8x8.1%
CHE$5.8B22.9x17.8x2.3x2.1x14.5x6.5%
EHAB$706.9Mn/m23.0x0.7x0.6x20.0x11.4%
OPCH$3.1B14.8x10.6x0.5x0.5x7.1x7.7%

Consensus projections

TickerFY2026EFY2027EFY2028E
ADUSRevenue+6.9%+4.7%+4.0%
EPS+12.8%+6.9%+5.1%
AVAHRevenue+20.3%+7.2%+5.6%
EPS+4822.7%+15.5%+9.2%
CHERevenue+5.6%+6.2%+5.4%
EPS+9.9%+10.5%+7.2%
EHABRevenue+3.6%+4.5%+4.1%
EPS+6.6%+11.9%−23.3%
OPCHRevenue+1.4%+7.1%+8.7%
EPS+6.1%+12.2%+12.2%

Forward fiscal years only. Blank means no analyst coverage for that year.

Physician-Staffing Rally Splits: AGL's Margin 'Turn' Is De-Risking, Not Growth

A year-long re-rating across value-based primary care and physician staffing predates Agilon Health's recent surge, but decomposing the cohort shows two different stories under one label: Agilon and Astrana Health trade rich after runs built partly on shrinking risk books and acquisitions, while AMN Healthcare and Pediatrix Medical Group remain far cheaper with steadier, if less dramatic, underlying numbers.

AGLAMNASTHMDHealthcare > Medical - Care Facilities > Physician Services & Staffing
TickerCompanySegmentTrend30D1Y
AGLAgilon HealthPhysician Services & Staffing🌱 Emerging Bull−14.9%+101.9%
AMNAMN Healthcare ServicesPhysician Services & Staffing🌱 Emerging Bull−6.0%+92.9%
ASTHAstrana HealthPhysician Services & Staffing🌱 Emerging Bull−24.2%+62.5%
MDPediatrix MedicalPhysician Services & Staffing🟢 Cont. Bull−3.2%+115.5%

12-month price & trend

AGL
Agilon Health
91.61
−5.14 (−5.31%)
vs. prior close
Price20d50d150d
AGL 12-month price
Physician Services & Staffing
AMN
AMN Healthcare Services
33.63
−1.08 (−3.11%)
vs. prior close
Price20d50d150d
AMN 12-month price
Physician Services & Staffing
ASTH
Astrana Health
35.56
−1.12 (−3.05%)
vs. prior close
Price20d50d150d
ASTH 12-month price
Physician Services & Staffing
MD
Pediatrix Medical
26.51
+0.03 (+0.11%)
vs. prior close
Price20d50d150d
MD 12-month price
Physician Services & Staffing

Four names sit in the user's watchlist under Physician Services & Staffing — Agilon Health, AMN Healthcare, Astrana Health and Pediatrix Medical Group — and all four have carried an emerging-bull tag after climbing out of a sustained downtrend that had them all reading strong-bear as recently as mid-2025. That timing matters: AMN, Astrana and Pediatrix confirmed their own uptrends weeks before Agilon's band flipped, so the label is cohort-wide rather than a single-stock artifact riding on Agilon's back. What has changed since is that Agilon's move has since dwarfed the others — up roughly 383% over six months against 30-73% for its three peers — and that divergence is now unwinding two names hard while leaving the other two untouched.

Agilon Health, which contracts to bear full financial risk on Medicare Advantage patients for independent primary-care doctors, fell from $102 to a $9.75 trough in April before rocketing to $91.61 by late July. Medical margin rose to $149M from $128M a year earlier and full-year guidance was lifted to roughly $5.7B in revenue and $375M in medical margin — but membership fell 13.2% year over year, meaning the margin gain came substantially from exiting unprofitable Medicare Advantage contracts rather than organic growth. Citi downgraded the stock to Sell on July 23 even while raising its price target to $105 from $80, citing a 38% valuation premium to peers after a roughly 650% year-to-date run; shares fell about 11% that day and have since given back roughly a quarter of their value. A separate overhang, a stockholder investigation into potential misstatements about Agilon's medical costs, adds to the case that the tape has run ahead of the story.

AMN Healthcare, the largest US healthcare staffing firm for travel nurses and physician locums, reported Q1 revenue that roughly doubled year over year, but nearly $722M of that was one-off nurse labor-disruption revenue management itself called unsustainable, with Q2 guidance of $620-635M implying a steep sequential drop. Core locums revenue fell 6% year over year on lower days filled, and industry-wide travel-nurse revenue is edging up only about 1% in 2026 with bill rates still pressured — a plateau, not an inflection. Yet AMN trades with no meaningful trailing P/E and a price-to-sales ratio near 0.37x, and its stock was flat over the past month while Agilon and Astrana sold off.

Astrana Health, which runs capitated, full-risk physician networks, posted 55.6% revenue growth substantially fueled by its Prospect Health acquisition rather than organic capitation growth alone. After an 86.5% year-to-date run, commentary flagged the stock as fully valued at roughly 73x trailing earnings, and its mid-July pullback was tied to broad sector rotation rather than any Astrana-specific news; shares are down 28.6% over the trailing month.

Pediatrix Medical Group, which staffs neonatal, maternal-fetal and pediatric subspecialty physicians nationally, is the steadiest of the four: trailing earnings near 12.9x, and management reaffirmed $280-300M adjusted EBITDA guidance with stable payor mix, explicitly noting it hasn't seen the unfavorable mix shifts reported elsewhere in the sector. The whole cohort also gets a shared macro tailwind: CMS's final CY2027 Medicare Advantage rate notice raised the net payment increase to 2.48% (4.98% including risk-score trend), well above the 0.09% initially proposed, supporting risk-bearing providers broadly into next year. Pediatrix reports Q2 results August 4, with Agilon following August 5 — the nearest live test of which fundamental story the shared label actually reflects.

The setup

Where it stands — Cohort tag is real and predates AGL's move, but the recent pullback is concentrated in AGL and ASTH while AMN and MD held flat. Would confirm — AMN core locums revenue stabilizes or turns positive and AGL membership stops shrinking in the Q3 print. Would invalidate — Agilon or Astrana resume new highs on no fresh operating data, widening the valuation gap further. Watch next — Pediatrix reports August 4, 2026; Agilon reports August 5, 2026. Valuation — MD ~12.9x trailing earnings; ASTH ~73x trailing; AMN and AGL have no meaningful trailing P/E versus roughly 0.36-0.37x price-to-sales each.

Valuation & fundamentals

TickerMkt capP/EP/E fwdP/SP/S fwdEV/EBITDAFCF yld
AGL$1.5Bn/m0.3x0.3xn/m-5.0%
AMN$1.3Bn/m12.7x0.4x0.4x7.5x54.2%
ASTH$1.8B57.6x28.0x0.5x0.4x14.4x8.8%
MD$2.2B12.9x11.6x1.1x1.1x9.3x10.9%

Consensus projections

TickerFY2026EFY2027EFY2028E
AGLRevenue−1.8%+6.3%+11.6%
EPS−84.4%−69.1%−294.6%
AMNRevenue+20.2%−19.9%+4.5%
EPS+88.5%−59.2%+18.2%
ASTHRevenue+26.7%+9.4%+7.0%
EPS+158.1%+47.6%+46.0%
MDRevenue+1.9%+2.4%+4.4%
EPS+9.5%+3.5%−3.0%

Forward fiscal years only. Blank means no analyst coverage for that year.

Regulated Utilities' AI Rally Holds as Merchant Power Cracks, But Multiples Are Stretched

The 25-member vertically integrated utilities group is up a broad-based ~8.7% over the past year on real, upgraded data-center capex and rate-base growth at AEP, Dominion, Entergy and Duke — but trailing multiples of 20x-30x sit well above the sector's own 16.8x long-run median, and a uniform 30-day, ~5% pullback tracks rising Treasury yields and regulatory backlash rather than any crack in the underlying business.

AEPDETRNEEDUKSOAEEATOAVACMSCNPDTEEDEIXESFEIDALNTNIPEGPNWPORPPLWECXELCWENBEPBWXTCCJFRVOOKLOSREPCGUtilities > Regulated Electric > Vertically Integrated UtilitiesNUCLEAR: Utilities / Regulated Nuclear OperatorsData Center: Regulated Utilities (Load Growth)Barron's Jan 2026: Utilities & EnergyNATGAS: Power / Regulated Utilities (Gas Generation)AI2: Power Generation & Grid / Turbines, Utilities & Behind-the-MeterNATGAS: Utilities / Pure-Play Gas Distribution (LDCs)PILTB Ep 483: ower Assets / Solar & Yieldcos (Margin Windfall)ILTB Ep 483: Solar & Storage / Marginal-Price BeneficiariesILTB Ep 483: Winners / Solar, Storage & RenewablesILTB Ep 483: Nuclear / Large-Scale Reactor BuildoutILTB Ep 483: Nuclear / AP1000 & Fuel CycleILTB Ep 483: Winners / Nuclear Fuel & ComponentsSPACE: Propulsion & Launch StructuresNUCLEAR: Fuel / Fabrication & Advanced FuelsData Center: SMR / Advanced Nuclear & UraniumAI2: Nuclear Fuel Cycle & SMRNuclearNUCLEAR: Uranium / Miners & ExplorersAI2: Power Generation & Grid / Switchgear & TransformersGeothermal: US-Listed Pure-PlaysNUCLEAR: Reactors / OEMs & SMR Developers
TickerCompanySegmentTrend30D1Y
AEPAmerican Electric PowerVertically Integrated Utilities🟢 Cont. Bull−6.0%+13.9%
DDominion EnergyVertically Integrated Utilities🟢 Cont. Bull−0.1%+17.0%
ETREntergyVertically Integrated Utilities🟢 Cont. Bull−5.5%+19.8%
NEENextEra EnergyVertically Integrated Utilities⚠️ Emerging Bear−0.6%+25.9%
DUKDuke EnergyVertically Integrated Utilities🟢 Cont. Bull−0.4%+3.6%
SOThe SouthernVertically Integrated Utilities🟢 Cont. Bull−1.5%+0.9%
AEEAmerenVertically Integrated Utilities🟢 Cont. Bull−3.0%+8.4%
ATOAtmos EnergyNatural Gas Distribution⚠️ Emerging Bear−0.6%+10.2%
AVAAvistaUS Electric & Gas Utilities🟢 Cont. Bull−0.5%+9.9%
CMSCMS EnergyVertically Integrated Utilities🟢 Cont. Bull−5.6%−1.4%
CNPCenterPoint EnergyUS Electric & Gas Utilities🟢 Cont. Bull−4.5%+9.2%
DTEDTE EnergyVertically Integrated Utilities🟢 Cont. Bull−6.3%+3.3%
EDConsolidated EdisonVertically Integrated Utilities🌱 Emerging Bull−2.8%+6.7%
EIXEdison InternationalRegional/International Utilities🟢 Cont. Bull−0.8%+38.5%
ESEversource EnergyVertically Integrated Utilities🟢 Cont. Bull−2.2%+11.3%
FEFirstEnergyVertically Integrated Utilities⚠️ Emerging Bear+1.3%+13.5%
IDAIDACORPVertically Integrated Utilities🟢 Cont. Bull−5.4%+16.1%
LNTAlliant EnergyVertically Integrated Utilities🟢 Cont. Bull−7.6%+9.2%
NINiSourceNatural Gas Distribution🟢 Cont. Bull−5.6%+3.9%
PEGPublic Service Enterprise Group IncorporatedVertically Integrated Utilities⚠️ Emerging Bear−5.1%−12.9%
PNWPinnacle West CapitalVertically Integrated Utilities🟢 Cont. Bull−5.5%+12.7%
PORPortland General ElectricVertically Integrated Utilities🟢 Cont. Bull−5.1%+21.0%
PPLPPLTransmission & Distribution Only⚠️ Emerging Bear−2.5%−0.4%
WECWEC EnergyVertically Integrated Utilities🟢 Cont. Bull−6.2%+0.8%
XELXcel EnergyVertically Integrated Utilities🟢 Cont. Bull−2.7%+7.8%
CWENClearway EnergyWind & Solar Developers⚠️ Emerging Bear−4.1%+1.0%
BEPBrookfield Renewable PartnersDiversified Renewable Generators🟢 Cont. Bull−2.8%+26.6%
BWXTBWX TechnologiesNaval & Shipbuilding⚠️ Emerging Bear−14.3%+9.6%
CCJCamecoUranium⚠️ Emerging Bear−11.4%+15.0%
FRVOFervo EnergyEmerging & Specialized Energy🔴 Cont. Bear−19.2%−38.3%
OKLOOkloEmerging & Specialized Energy⚠️ Emerging Bear−25.1%−49.2%
SRESempraUS Electric & Gas Utilities🟢 Cont. Bull−4.7%+9.0%
PCGPG&EVertically Integrated Utilities🟢 Cont. Bull+3.3%+16.4%

12-month price & trend

AEP
American Electric Power
128
+0.07 (+0.05%)
vs. prior close
Price20d50d150d
AEP 12-month price
Vertically Integrated Utilities
D
Dominion Energy
69.17
−0.56 (−0.80%)
vs. prior close
Price20d50d150d
D 12-month price
Vertically Integrated Utilities
ETR
Entergy
108
−0.41 (−0.38%)
vs. prior close
Price20d50d150d
ETR 12-month price
Vertically Integrated Utilities
NEE
NextEra Energy
86.92
−1.01 (−1.15%)
vs. prior close
Price20d50d150d
NEE 12-month price
Vertically Integrated Utilities
DUK
Duke Energy
125
−0.84 (−0.67%)
vs. prior close
Price20d50d150d
DUK 12-month price
Vertically Integrated Utilities
SO
The Southern
94.54
+0.20 (+0.21%)
vs. prior close
Price20d50d150d
SO 12-month price
Vertically Integrated Utilities
AEE
Ameren
110
+1.14 (+1.05%)
vs. prior close
Price20d50d150d
AEE 12-month price
Vertically Integrated Utilities
ATO
Atmos Energy
173
−1.48 (−0.85%)
vs. prior close
Price20d50d150d
ATO 12-month price
Natural Gas Distribution
AVA
Avista
40.45
−0.49 (−1.20%)
vs. prior close
Price20d50d150d
AVA 12-month price
US Electric & Gas Utilities
CMS
CMS Energy
71.99
−0.27 (−0.37%)
vs. prior close
Price20d50d150d
CMS 12-month price
Vertically Integrated Utilities
CNP
CenterPoint Energy
42.04
−0.11 (−0.26%)
vs. prior close
Price20d50d150d
CNP 12-month price
US Electric & Gas Utilities
DTE
DTE Energy
142
+0.17 (+0.12%)
vs. prior close
Price20d50d150d
DTE 12-month price
Vertically Integrated Utilities
ED
Consolidated Edison
109
−0.81 (−0.74%)
vs. prior close
Price20d50d150d
ED 12-month price
Vertically Integrated Utilities
EIX
Edison International
73.37
−5.36 (−6.81%)
vs. prior close
Price20d50d150d
EIX 12-month price
Regional/International Utilities
ES
Eversource Energy
71.59
−2.25 (−3.05%)
vs. prior close
Price20d50d150d
ES 12-month price
Vertically Integrated Utilities
FE
FirstEnergy
48.31
−0.40 (−0.82%)
vs. prior close
Price20d50d150d
FE 12-month price
Vertically Integrated Utilities
IDA
IDACORP
143
+1.01 (+0.71%)
vs. prior close
Price20d50d150d
IDA 12-month price
Vertically Integrated Utilities
LNT
Alliant Energy
70.78
−0.29 (−0.40%)
vs. prior close
Price20d50d150d
LNT 12-month price
Vertically Integrated Utilities
NI
NiSource
44.43
−0.64 (−1.42%)
vs. prior close
Price20d50d150d
NI 12-month price
Natural Gas Distribution
PEG
Public Service Enterprise Group Incorporated
76.68
−0.87 (−1.12%)
vs. prior close
Price20d50d150d
PEG 12-month price
Vertically Integrated Utilities
PNW
Pinnacle West Capital
101
−0.33 (−0.33%)
vs. prior close
Price20d50d150d
PNW 12-month price
Vertically Integrated Utilities
POR
Portland General Electric
49.33
−0.76 (−1.52%)
vs. prior close
Price20d50d150d
POR 12-month price
Vertically Integrated Utilities
PPL
PPL
35.21
−0.35 (−0.98%)
vs. prior close
Price20d50d150d
PPL 12-month price
Transmission & Distribution Only
WEC
WEC Energy
109
−0.63 (−0.57%)
vs. prior close
Price20d50d150d
WEC 12-month price
Vertically Integrated Utilities
XEL
Xcel Energy
78.20
−0.03 (−0.04%)
vs. prior close
Price20d50d150d
XEL 12-month price
Vertically Integrated Utilities
CWEN
Clearway Energy
31.73
+0.00 (+0.00%)
vs. prior close
Price20d50d150d
CWEN 12-month price
Wind & Solar Developers
BEP
Brookfield Renewable Partners
32.86
+0.20 (+0.61%)
vs. prior close
Price20d50d150d
BEP 12-month price
Diversified Renewable Generators
BWXT
BWX Technologies
169
+3.11 (+1.88%)
vs. prior close
Price20d50d150d
BWXT 12-month price
Naval & Shipbuilding
CCJ
Cameco
86.38
−1.85 (−2.10%)
vs. prior close
Price20d50d150d
CCJ 12-month price
Uranium
FRVO
Fervo Energy
22.54
+0.24 (+1.08%)
vs. prior close
Price20d50d150d
FRVO 12-month price
Emerging & Specialized Energy
OKLO
Oklo
38.83
−2.26 (−5.50%)
vs. prior close
Price20d50d150d
OKLO 12-month price
Emerging & Specialized Energy
SRE
Sempra
88.55
−1.03 (−1.15%)
vs. prior close
Price20d50d150d
SRE 12-month price
US Electric & Gas Utilities
PCG
PG&E
17.38
−0.40 (−2.25%)
vs. prior close
Price20d50d150d
PCG 12-month price
Vertically Integrated Utilities

American Electric Power (AEP), the Ohio-based transmission and generation utility that owns 90% of the country's 765kV high-voltage grid, Dominion Energy, the Virginia utility serving the world's densest data-center corridor, and peers Entergy, Duke Energy, Southern Company and NextEra Energy have carried the regulated utilities segment to a broad, not concentrated, gain: mean one-year return across all 25 vertically integrated utility names is +8.7%, with 21 of 25 positive. The strongest legs are Edison International (wildfire-liability recovery, +38%) alongside data-center-exposed names NextEra (+23.5%), Entergy (+20%), Portland General (+19%), IDACORP (+14.9%) and Dominion (+14.5%); the weak tail is Public Service Enterprise Group (-13.8%) and CenterPoint Energy (-2.8%). Twelve of the 25 currently sit in a sustained uptrend and none in a sustained downtrend — a sharp contrast with the adjacent merchant, nuclear and yieldco complex, where Clearway Energy, BWX Technologies, Cameco and Fervo Energy have all rolled into confirmed downtrends. No band contagion from that breakdown has reached the regulated cohort so far.

The business case is real

Capex and rate-base guidance have moved up, not down. AEP raised its five-year capital plan from $72B to $78B on contracted data-center load that has doubled to 63 gigawatts, implying better than 9% long-term earnings-per-share (EPS) growth. Entergy's plan grew from $43B to $57B after signing a Meta data-center agreement in Louisiana, where regulators approved three new gas plants plus transmission to serve it, per The Center Square; Entergy now guides to 12%+ EPS growth into 2030. Dominion's 50-gigawatt pipeline, anchored by Virginia's "Data Center Alley," backs a $65B five-year plan, and Duke Energy reaffirmed 2026 EPS guidance of $6.55-$6.80 alongside a $103B five-year capital plan and 7.6 gigawatts of signed AI contracts, according to ad-hoc-news.de. Regulators have also begun shifting stranded-cost risk toward the data centers themselves: Virginia's utility regulator approved a new Dominion tariff class requiring 14-year take-or-pay contracts from large users starting 2027, even as it capped Dominion's authorized return on equity at 9.8% instead of the requested 10.4%, per Inside Climate News. AEP Ohio's tariff carries an 85% take-or-pay demand floor, per Utility Dive, though manufacturers still dispute AEP's underlying load forecast.

But the price already reflects it

Trailing price-to-earnings ratios across the core names run from 19.8x (Duke) and 20.5x (AEP, Dominion) to 22.5x (NextEra), 24.8x (Southern) and 29.6x (Entergy) — all above the sector's own 25-year forward-multiple median near 16.8x and the roughly 18.2x estimate on 2026 sector earnings, per stockanalysis.com. Growth is confirming the rally, but the multiple has moved further, placing most of the cohort in what reads as a stretched advance rather than cheap compounding. The past 30 days show a uniform, sector-wide de-rating — all 25 members fell, averaging roughly -5% — that lines up with the 10-year Treasury yield's climb toward 4.74% by July 31, per CNBC, plus mounting political pressure over electricity bills that Utility Dive and Fitch describe as a deteriorating backdrop for cost recovery, per Utility Dive. An unresolved Federal Energy Regulatory Commission (FERC) show-cause process on large-load interconnection rules closes around mid-August, and Sightline Climate estimates up to half of the announced 2026 data-center pipeline may not materialize — both live risks to the load forecasts underpinning current capex plans, per The Center Square.

The setup

Where it stands — Regulated utilities are decoupling from the merchant/nuclear power breakdown, with real capex and EPS upgrades but trailing multiples above the sector's long-run median. Would confirm — Signed data-center megawatts convert to realized load growth in coming IRP updates without material cancellations. Would invalidate — Strongly bullish-band names roll into mild or strongly bearish as merchant-complex contagion spreads, or FERC's August ruling shifts stranded-cost risk back to utilities. Watch next — FERC's large-load interconnection show-cause deadline, due mid-August 2026. Valuation — Core names trade 19.8x-29.6x trailing earnings versus a 25-year sector median near 16.8x forward.

Valuation & fundamentals

TickerMkt capP/EP/E fwdP/SP/S fwdEV/EBITDAFCF yld
AEP$68.1B18.6x19.7x3.1x2.9x13.7x9.1%
D$54.3B18.2x17.2x3.1x3.0x13.3x-13.6%
ETR$49.9B27.6x24.8x3.8x3.6x13.6x-6.0%
NEE$194.7B23.8x23.1x6.9x6.3x17.3x1.2%
DUK$94.3B18.3x18.1x2.8x2.8x11.5x7.0%
SO$104.3B23.8x20.2x3.5x3.4x12.4x-3.7%
AEE$29.4B19.3x19.8x3.3x3.2x7.8x-4.4%
ATO$29.5B21.8x21.1x6.0x5.6x15.3x-6.8%
AVA$3.3B16.2x15.5x1.7x1.7x9.9x12.5%
CMS$22.1B19.5x18.4x2.5x2.5x12.7x-9.2%
CNP$27.2B25.3x21.8x2.9x2.7x13.5x-9.8%
DTE$29.1B22.9x18.1x1.8x1.8x13.7x-5.1%
ED$38.8B17.7x17.3x2.3x2.2x9.4x7.2%
EIX$26.6B7.2x11.3x1.4x1.4x9.3x-2.4%
ES$25.3B14.4x14.4x1.8x1.9x10.2x0.9%
FE$25.3B23.8x16.0x1.6x1.6x12.0x7.1%
IDA$7.8B23.2x21.9x4.4x3.9x16.1x-10.3%
LNT$18.3B22.2x20.7x4.1x4.2x15.1x-5.6%
NI$22.2B23.1x22.5x3.3x3.2x12.5x-3.7%
PEG$38.1B16.9x17.5x3.0x3.1x11.2x-0.2%
PNW$11.9B18.3x20.8x2.2x2.1x12.4x-8.3%
POR$5.5B20.8x13.9x1.6x1.5x9.2x1.2%
PPL$26.2B21.5x17.9x2.8x2.7x12.0x-6.2%
WEC$35.6B21.7x19.5x3.5x3.5x14.3x-3.1%
XEL$48.6B23.3x19.0x3.3x3.1x13.9x-6.7%
CWEN$6.5B793.3x4.4x3.9x14.3x9.0%
BEP$10.5B54.3x1.7x1.5x9.6x-48.1%
BWXT$15.5B44.7x35.8x4.6x4.1x29.8x2.1%
CCJ$37.6B148.0x52.9x15.2x10.7x61.0x1.0%
FRVO$8.4B
OKLO$6.8Bn/mn/mn/m-2.3%
SRE$59.1B28.6x17.7x4.3x4.2x15.4x-9.9%
PCG$35.5B12.0x9.8x1.4x1.3x9.2x-11.9%

Consensus projections

TickerFY2026EFY2027EFY2028E
AEPRevenue+9.1%+5.8%+7.5%
EPS+7.4%+7.9%+10.5%
DRevenue+12.2%+6.0%+5.3%
EPS+5.1%+6.2%+6.3%
ETRRevenue+8.5%+8.8%+9.5%
EPS+12.2%+14.5%+13.7%
NEERevenue+9.0%+9.3%+8.6%
EPS+9.4%+8.8%+8.4%
DUKRevenue+4.6%+4.2%+4.3%
EPS+6.2%+7.0%+6.8%
SORevenue+8.3%+5.3%+6.3%
EPS+6.7%+7.7%+9.0%
AEERevenue+6.3%+6.0%+6.2%
EPS+7.0%+8.0%+8.4%
ATORevenue+9.3%+6.8%+8.7%
EPS+13.0%+6.6%+8.4%
AVARevenue+2.4%+3.5%+3.5%
EPS+3.8%+7.7%+4.4%
CMSRevenue+9.4%+4.1%+5.3%
EPS+8.1%+7.5%+7.9%
CNPRevenue+9.3%+4.7%+5.0%
EPS+8.3%+9.1%+8.8%
DTERevenue+13.4%+2.6%+2.8%
EPS+6.6%+8.0%+8.4%
EDRevenue+6.9%+4.2%+3.9%
EPS+7.3%+6.2%+6.5%
EIXRevenue+2.0%+4.5%+3.3%
EPS+0.6%+6.4%+6.3%
ESRevenue+4.6%+3.5%+6.6%
EPS−1.4%+5.6%+6.2%
FERevenue+8.0%+5.1%+4.9%
EPS+7.2%+7.8%+7.9%
IDARevenue+3.1%+8.4%+9.5%
EPS+9.2%+8.9%+9.5%
LNTRevenue+6.8%+4.3%+6.3%
EPS+6.5%+7.7%+9.4%
NIRevenue+13.1%+5.5%+6.5%
EPS+9.2%+8.8%+8.8%
PEGRevenue+4.1%+4.0%+4.3%
EPS+8.3%+7.4%+7.2%
PNWRevenue+4.2%+7.2%+5.9%
EPS−4.9%+17.3%+9.8%
PORRevenue+5.8%+6.8%+5.2%
EPS+8.0%+5.1%+5.7%
PPLRevenue+10.6%+5.4%+5.6%
EPS+7.8%+8.6%+8.3%
WECRevenue+8.0%+5.0%+7.5%
EPS+6.6%+7.2%+8.2%
XELRevenue+7.8%+8.9%+8.1%
EPS+8.0%+10.4%+10.1%
CWENRevenue+17.0%+11.6%+12.6%
EPS−164.1%−148.8%+63.8%
BEPRevenue+8.3%+11.0%+0.9%
EPS+22.8%−18.4%−12.6%
BWXTRevenue+19.7%+9.4%+7.5%
EPS+23.2%+11.1%+11.2%
CCJRevenue+2.8%+10.7%+9.4%
EPS+13.8%+62.5%+20.5%
OKLORevenue+359.5%+731.8%
EPS+20.1%+13.8%+10.2%
SRERevenue−0.8%−2.2%+2.0%
EPS+11.6%+8.1%+8.5%
PCGRevenue+4.0%+3.3%+3.7%
EPS+9.6%+9.4%+9.3%

Forward fiscal years only. Blank means no analyst coverage for that year.

Design Backlogs Hit Records as AECOM, Stantec, WSP Shares Fall on Valuation Reset

AECOM, Stantec and WSP Global posted record backlogs and raised or reaffirmed double-digit guidance in their most recent quarters, yet their shares fell 35-39% over the year as trailing multiples compressed to multi-year lows — while the construction cohort executing the same AI-power buildout re-rated to 45-106x trailing earnings. MYR Group, an electrical contractor grouped in the same watchlist bucket, decoupled entirely and trended with the constructors instead.

ACMTTEKSTNWSP.TOMYRGUTIWSCSTRLPWRMTZDYAGXPSNAI2: Engineering Services & Grid InterconnectionAI2: Construction, MEP & Site DevelopmentNUCLEAR: EPC / Engineering & ConstructionData Center: Construction, Engineering & EPCData Center: Logistics, Telecom & AdjacentNATGAS: EPC / Data Center MEP ContractorsNATGAS: EPC / Power & Energy Mega-ProjectsILTB Ep 483: Short Side / Structurally Short Natural GasILTB Ep 483: Losers / Turbines & Gas-Plant BuildoutSPACE: Defense Space Primes & SubcontractorsJune 2026 52wk low: Defense, Aerospace & Services
TickerCompanySegmentTrend30D1Y
ACMAecomDesign & Engineering Consulting🔴 Cont. Bear+4.0%−34.8%
TTEKTetra TechDesign & Engineering Consulting⚠️ Emerging Bear+6.5%−8.8%
STNStantecDesign & Engineering Consulting🔴 Cont. Bear−0.3%−35.8%
WSP.TOWSP GlobalEngineering & Construction🔴 Cont. Bear−4.0%−39.7%
MYRGMYRElectrical & Power Infrastructure🟢 Cont. Bull−24.7%+76.6%
UTIUniversal Technical InstituteCareer & Technical Training🌱 Emerging Bull−21.3%+25.5%
WSCWillScotModular & Portable Storage🌱 Emerging Bull−8.4%−2.3%
STRLSterling InfrastructureInfrastructure & Civil Construction🟢 Cont. Bull−16.8%+119.6%
PWRQuanta ServicesElectrical & Power Infrastructure🟢 Cont. Bull−1.0%+69.7%
MTZMasTecElectrical & Power Infrastructure🟢 Cont. Bull−30.9%+47.9%
DYDycom IndustriesElectrical & Power Infrastructure🟢 Cont. Bull−6.9%+51.4%
AGXArganEnergy & Power Project Solutions🟢 Cont. Bull−21.3%+156.3%
PSNParsonsTesting, Detection & Measurement⚠️ Emerging Bear−23.0%−40.7%

12-month price & trend

ACM
Aecom
72.39
+0.63 (+0.88%)
vs. prior close
Price20d50d150d
ACM 12-month price
Design & Engineering Consulting
TTEK
Tetra Tech
33.16
+0.71 (+2.19%)
vs. prior close
Price20d50d150d
TTEK 12-month price
Design & Engineering Consulting
STN
Stantec
70.49
+1.05 (+1.51%)
vs. prior close
Price20d50d150d
STN 12-month price
Design & Engineering Consulting
WSP.TO
WSP Global
171
+4.11 (+2.46%)
vs. prior close
Price20d50d150d
WSP.TO 12-month price
Engineering & Construction
MYRG
MYR
333
+2.38 (+0.72%)
vs. prior close
Price20d50d150d
MYRG 12-month price
Electrical & Power Infrastructure
UTI
Universal Technical Institute
39.31
−0.75 (−1.87%)
vs. prior close
Price20d50d150d
UTI 12-month price
Career & Technical Training
WSC
WillScot
24.28
+0.25 (+1.04%)
vs. prior close
Price20d50d150d
WSC 12-month price
Modular & Portable Storage
STRL
Sterling Infrastructure
597
+16.04 (+2.76%)
vs. prior close
Price20d50d150d
STRL 12-month price
Infrastructure & Civil Construction
PWR
Quanta Services
667
+9.38 (+1.43%)
vs. prior close
Price20d50d150d
PWR 12-month price
Electrical & Power Infrastructure
MTZ
MasTec
263
−61.34 (−18.91%)
vs. prior close
Price20d50d150d
MTZ 12-month price
Electrical & Power Infrastructure
DY
Dycom Industries
401
−16.08 (−3.85%)
vs. prior close
Price20d50d150d
DY 12-month price
Electrical & Power Infrastructure
AGX
Argan
570
−9.44 (−1.63%)
vs. prior close
Price20d50d150d
AGX 12-month price
Energy & Power Project Solutions
PSN
Parsons
44.21
+1.04 (+2.41%)
vs. prior close
Price20d50d150d
PSN 12-month price
Testing, Detection & Measurement

AECOM, the global engineering and infrastructure-design consultancy, closed its latest quarter with backlog up 8% to a record $26.2 billion and a 1.2x book-to-burn ratio in its design segment — its second guidance raise of the fiscal year, to $5.90-$6.10 adjusted EPS. Yet the stock has sat in a sustained downtrend, its 50-day moving average below its 200-day, for roughly 220 consecutive trading days since December, and is down 34.8% over the past year. Stantec, the Canadian infrastructure-engineering group, and WSP Global, the Montreal-based design consultancy, show the identical pattern — both grew revenue near 9-11%, both hit record backlogs, both fell more than 35%. The construction and electrical-contracting firms that build what these engineers design — Sterling Infrastructure, a civil-construction contractor; Quanta Services (PWR), a utility-transmission contractor; MasTec (MTZ), an infrastructure builder; and Dycom (DY), a telecom-and-utility construction specialist — rose a combined 89% over the year and now trade at 45x-106x trailing earnings, well above their own historical ranges.

Growth confirms, price does not

Stantec's net revenue rose 9.1% and adjusted EPS 14.7% in its most recent quarter, with backlog up 13.2% to a record CAD 9.0 billion and management reaffirming 15%-18% EPS growth guidance; WSP's backlog reached roughly $20 billion following its TRC acquisition, with power, data-center and digital-services work growing faster than the base business. Yet financial press attributes the Stantec/WSP selloff — roughly 23-24% over six months — primarily to investor fear that generative AI will commoditize the billable-hours consulting model, not to any visible demand shortfall. AECOM's decline traces to something narrower: negative free cash flow of -$27.4 million versus +$178.4 million a year earlier, a Q1 revenue miss, and delayed project ramp-ups in the Middle East — execution noise layered on record backlog, not federal-work loss.

Two names in the same watchlist bucket decouple entirely. MYR Group, an electrical transmission-and-distribution contractor, rose 77.8% over the year on record backlog up 20% to $3.16 billion, with Q2 net income nearly doubling — it trends with the constructors because it is a self-perform contractor, not a fee-based design shop. Tetra Tech, the most federally-exposed pure consultancy, fell only 7.6% despite raising FY2026 revenue guidance on 8% growth excluding USAID/disaster-response work, even as federal budget cuts — EPA funding down roughly 54% for FY2026 — pressure state-and-local grant-funded engineering work broadly across the segment.

Parsons, a diversified infrastructure and defense-technology consultancy, is the outlier that does not fit this thesis: its 28.7% five-session collapse traces to a company-specific guidance cut — FY2026 revenue lowered to $6.2-6.5 billion and a surprise EPS loss tied to $118 million in portfolio-shaping and joint-venture charges, framed by analysts as earnings-driven rather than sector-wide — no read-through to peers, all of whom posted strong quarters in the same window.

Where the multiples sit

ACM trades near 15x trailing earnings, down from roughly 18x in May and well below its own three-year range; Stantec sits near 23x, compressed from 29x; WSP near 24x, down from a prior 32x level. Tetra Tech trades near 17.5x, far below its own flagged 30x forward level. Against that, Sterling trades near 72x-78x trailing, Quanta near 92-106x, MasTec near 74-76x — multiples expanding even as the design cohort's compressed on improving fundamentals.

The setup

Where it stands — Record backlogs and raised guidance at ACM, STN, WSP and TTEK coincide with 1-year share declines of 8-39%, while the constructor cohort executing the same buildout is up 89% at 45-106x trailing earnings. Would confirm — Design-consultancy backlog and book-to-bill continue rising for two more quarters while trailing multiples hold below five-year medians. Would invalidate — Backlog growth stalls or book-to-bill falls below 1.0x at ACM, STN or WSP in their next reported quarter. Watch next — AECOM's next fiscal-quarter results, expected around October 2026, for free-cash-flow recovery and international project ramp-up. Valuation — ACM ~15x trailing vs ~18x in May; STN ~23x vs ~29x; WSP ~24x vs ~32x prior; constructors at 45-106x trailing.

Valuation & fundamentals

TickerMkt capP/EP/E fwdP/SP/S fwdEV/EBITDAFCF yld
ACM$9.3B17.2x12.2x0.6x1.2x9.3x4.4%
TTEK$8.6B19.9x21.1x1.7x2.0x14.1x6.4%
STN$8.0B23.0x16.0x1.4x1.1x12.4x6.0%
WSP.TO$23.1B23.3x14.9x1.3x1.4x13.3x7.5%
MYRG$5.2B31.3x28.3x1.3x1.2x18.4x4.3%
UTI$2.2B49.9x50.3x2.5x2.4x21.4x0.1%
WSC$4.4Bn/m22.3x1.9x1.9x17.0x13.2%
STRL$18.3B52.7x31.6x6.3x4.9x30.8x2.4%
PWR$100.3B75.5x42.9x3.1x2.7x35.1x2.4%
MTZ$21.1B41.4x28.6x1.3x1.2x21.9x1.2%
DY$12.0B37.8x24.2x1.9x1.6x13.6x3.7%
AGX$8.0B49.0x47.2x7.7x6.2x40.7x6.1%
PSN$5.4B23.7x15.1x0.9x0.8x13.0x7.7%

Consensus projections

TickerFY2026EFY2027EFY2028E
ACMRevenue+4.5%+6.1%+4.2%
EPS+13.7%+12.8%+13.4%
TTEKRevenue−3.7%+4.3%+2.0%
EPS+3.8%+10.1%+11.7%
STNRevenue+10.4%+5.8%+7.3%
EPS+14.5%+11.1%+22.0%
WSP.TORevenue+18.9%+7.5%+6.9%
EPS+19.5%+14.6%+13.8%
MYRGRevenue+19.4%+14.0%+9.1%
EPS+66.3%+18.1%+22.2%
UTIRevenue+9.4%+9.0%+9.3%
EPS−26.2%+9.5%+58.5%
WSCRevenue−0.0%+3.3%+4.9%
EPS−3.3%+22.3%+34.3%
STRLRevenue+58.0%+18.5%+26.4%
EPS+82.4%+27.3%+20.2%
PWRRevenue+34.0%+15.2%+13.1%
EPS+46.4%+16.9%+17.3%
MTZRevenue+30.5%+20.3%+14.5%
EPS+43.0%+34.8%+28.0%
DYRevenue+17.1%+40.1%+11.3%
EPS+39.5%+47.1%+20.3%
AGXRevenue+12.1%+36.2%+25.4%
EPS+65.8%+44.2%+29.3%
PSNRevenue+3.3%+7.2%+5.7%
EPS+3.7%+10.7%+14.2%

Forward fiscal years only. Blank means no analyst coverage for that year.

Rail Rally Broadens Past Merger Bets as CNI, CP Match Gains — Now Trades Rich

Canadian National and Canadian Pacific Kansas City, which have zero merger optionality, matched or beat the merger-linked names' 12-month gains on genuine double-digit revenue growth — but every Class I railroad's multiple now sits above its own historical median, and the Union Pacific–Norfolk Southern merger timeline has slipped to mid-2027 with Warren Buffett publicly denying BNSF interest in CSX.

CSXNSCUNPCNICPIndustrials > Railroads > Class I RailroadsData Center: Logistics, Telecom & Adjacent
TickerCompanySegmentTrend30D1Y
CSXCSXClass I Railroads🟢 Cont. Bull+3.3%+43.7%
NSCNorfolk SouthernClass I Railroads🟢 Cont. Bull+4.2%+21.7%
UNPUnion PacificClass I Railroads🟢 Cont. Bull+3.4%+33.8%
CNICanadian National RailwayClass I Railroads🌱 Emerging Bull+4.6%+37.5%
CPCanadian Pacific Kansas CityClass I Railroads🌱 Emerging Bull+1.0%+20.0%

12-month price & trend

CSX
CSX
50.40
+0.21 (+0.42%)
vs. prior close
Price20d50d150d
CSX 12-month price
Class I Railroads
NSC
Norfolk Southern
335
+1.55 (+0.46%)
vs. prior close
Price20d50d150d
NSC 12-month price
Class I Railroads
UNP
Union Pacific
292
+2.67 (+0.92%)
vs. prior close
Price20d50d150d
UNP 12-month price
Class I Railroads
CNI
Canadian National Railway
127
+0.27 (+0.21%)
vs. prior close
Price20d50d150d
CNI 12-month price
Class I Railroads
CP
Canadian Pacific Kansas City
88.89
+1.08 (+1.23%)
vs. prior close
Price20d50d150d
CP 12-month price
Class I Railroads

A cohort move, not a merger trade

The five North American Class I railroads — the continent's largest long-haul freight networks — have moved together over the past year, and the pattern undercuts the tidiest version of the merger-arb story. Canadian National (CNI), Canada's largest railway with no acquisition optionality of its own, gained 36.1% over the trailing year — more than Norfolk Southern (NSC), the Eastern U.S. carrier that is the actual target of Union Pacific's pending takeover, which rose just 20.7%. Canadian Pacific Kansas City (CP), the only railroad running a single continuous line from Canada to Mexico and likewise free of deal speculation, gained 20.9%, tying NSC for the cohort's weakest return. CSX, the Eastern U.S. railroad widely discussed as a future BNSF target, led the group at 41.8%, while Union Pacific (UNP), the Western U.S. carrier and the actual acquirer in the pending merger, added 31.6%. All five gained further over just the past 30 days, between 2.6% and 7.4%, and CSX has held a continuous uptrend — its 50-day average above its 200-day — since April 17, roughly 106 days.

The growth is real

Underneath the price action, revenue is genuinely expanding. CNI's second-quarter revenue rose 11.2% year over year with an earnings beat, Gurufocus reported, though its operating ratio — the share of revenue consumed by operating costs — widened 50 basis points to 62.2% on fuel-cost pressure. CPKC's revenue rose 13% with adjusted earnings per share up 13%, the company reported, though its operating ratio also worsened 90 basis points. UNP runs an industry-leading 59.9% adjusted operating ratio, and CSX grew operating income 20% to $1.25B in the first quarter. Sector-wide freight data corroborate a genuine, if uneven, cycle: total U.S. carloads rose 3.1% and intermodal units 3.6% for the year through mid-July, even as coal carloads — a structural decliner — fell roughly 8% year over year.

But the price has moved further than the earnings

That growth has not stopped every multiple from running above its own history. CSX trades at 30.6x trailing earnings; the user's own notes flag that a P/E near 27x "already prices much of the optionality" tied to BNSF-takeout speculation. NSC's 27.9x trailing multiple compares with a standalone-justified 18-20x per the same notes — several turns of pure acquisition premium. CNI trades at roughly 24.2x trailing and 20.6x forward earnings, about 17% above its own historical median; CP sits near 27-28x trailing and 22x forward, about 19% above its own median. UNP's 24.1x trailing multiple already reflects the merger base case, per prior desk notes. The pattern holds across merger names and non-merger names alike — this is a sector re-rating, not just a deal premium.

The catalyst that could still swing it

The Surface Transportation Board accepted UP-NS's amended application on May 28, 2026, and the companies filed supplemental customer-protection commitments on July 27, 2026, but the target close has stretched from early to mid-2027. Opposition includes BNSF, 24 senators, and two rail unions, versus six unions that have signed support agreements. Separately, Buffett told CNBC that BNSF was not shopping for another railroad, knocking CSX down more than 6% even though its uptrend has otherwise held.

The setup

Where it stands — The cohort is up roughly 30% over a year on genuine revenue growth, but every name's forward multiple sits above its own historical median. Would confirm — Continued double-digit revenue growth and stable operating ratios at CNI and CP next quarter, absent any merger link. Would invalidate — STB rejection, a delay past mid-2027, or deepening carload/coal declines that outpace pricing gains. Watch next — STB evidentiary and environmental review, with a statutory decision window roughly 12 months from the May 28, 2026 acceptance. Valuation — CSX 30.6x trailing; NSC 27.9x vs a standalone-justified 18-20x; CNI 24.2x trailing/20.6x forward; CP 27-28x trailing/22x forward — all above own medians.

Valuation & fundamentals

TickerMkt capP/EP/E fwdP/SP/S fwdEV/EBITDAFCF yld
CSX$84.1B27.6x23.7x5.9x5.7x15.8x4.9%
NSC$68.5B25.7x25.1x5.6x5.4x15.3x5.6%
UNP$155.9B21.6x20.9x6.3x6.0x14.4x3.7%
CNI$68.3B20.0x14.0x5.4x3.7x13.0x3.8%
CP$75.5B25.7x22.8x6.9x6.5x15.5x2.0%

Consensus projections

TickerFY2026EFY2027EFY2028E
CSXRevenue+4.6%+4.7%+3.2%
EPS+16.6%+13.4%+8.7%
NSCRevenue+4.0%+4.4%+4.2%
EPS+1.0%+11.3%+9.5%
UNPRevenue+5.9%+4.4%+9.6%
EPS+7.7%+8.9%+9.6%
CNIRevenue+5.6%+4.1%+5.4%
EPS+6.3%+11.0%+10.1%
CPRevenue+6.4%+5.6%+7.1%
EPS+10.8%+14.9%+14.4%

Forward fiscal years only. Blank means no analyst coverage for that year.

OTA Bounce Is an Earnings Story for Booking and Expedia, Not a Sector Turn

The online travel agency rebound is not one story: Booking Holdings and Expedia rallied on earnings beats and raised guidance, with their trend signals now confirming the move, while MakeMyTrip actually fell over the same 30 days and Trip.com's 14% gain remains unconfirmed by its trend band amid a guided growth slowdown.

BKNGEXPEMMYTTCOMConsumer Cyclical > Travel Services > Online Travel Agencies
TickerCompanySegmentTrend30D1Y
BKNGBookingOnline Travel Agencies🔴 Cont. Bear+6.6%−11.4%
EXPEExpediaOnline Travel Agencies⚠️ Emerging Bear+10.5%+60.2%
MMYTMakeMyTripOnline Travel Agencies🔴 Cont. Bear−0.7%−39.1%
TCOMTrip.comOnline Travel Agencies⚠️ Emerging Bear+14.7%−24.3%

12-month price & trend

BKNG
Booking
193
−0.34 (−0.18%)
vs. prior close
Price20d50d150d
BKNG 12-month price
Online Travel Agencies
EXPE
Expedia
295
+1.81 (+0.62%)
vs. prior close
Price20d50d150d
EXPE 12-month price
Online Travel Agencies
MMYT
MakeMyTrip
56.95
−0.13 (−0.23%)
vs. prior close
Price20d50d150d
MMYT 12-month price
Online Travel Agencies
TCOM
Trip.com
47.01
+0.53 (+1.14%)
vs. prior close
Price20d50d150d
TCOM 12-month price
Online Travel Agencies

A four-name bounce, but not a four-name story

Booking Holdings, the world's largest online travel agency and owner of Booking.com, Priceline and Agoda, and Expedia Group, which runs Expedia.com, Hotels.com and the vacation-rental platform Vrbo, both rallied sharply in late July on company-specific news. Booking closed up 6.82% on July 28 after a second-quarter earnings beat and raised third-quarter guidance, as a Middle East-related demand headwind that had forced an April guidance cut began to reverse. Expedia rose 7.4% on July 27 on fresh analyst optimism ahead of its own August 5 earnings report, touching an all-time high. Both stocks' trend signals, which had spent months in bearish territory, flipped bullish coincident with those single sessions — the price move and the trend confirmation arrived together, not price ahead of the band.

MakeMyTrip, India's largest online travel agency, and Trip.com Group, the dominant Chinese OTA with a growing outbound and international business, diverge from that pattern. MakeMyTrip's price is actually down 2.1% over the trailing month even as its trend signal flipped bullish alongside its peers — most likely sympathy rather than an MMYT-specific signal, with its own results due August 3 and Goldman Sachs flagging rupee depreciation as a headwind to dollar-reported growth. Trip.com gained 14.4%, the largest move of the four, but its trend signal remains deeply bearish — the one clear case in this basket of price rising well ahead of any trend confirmation, and against decelerating fundamentals: Trip.com fell 13.9% in a single session in late June after guiding second-quarter revenue growth to just 3-8%, down from 17% in the first quarter, with outbound growth and domestic China demand both softening. The one bright spot was international gross bookings up roughly 65% year over year.

On valuation, Booking and Expedia both still trade well inside multi-year ranges. Booking's trailing price-to-earnings sits near 24x, but its forward multiple and free-cash-flow yield near 8% point to levels last seen years ago, alongside an $8.2B capital-return program that has cut share count 22% since 2022. A Barron's-cited model puts Expedia's cash-adjusted price-to-earnings near 11.7-14x against Booking's 17.5-18.8x — cheaper on that basis despite Expedia being roughly half Booking's size and holding a smaller international footprint. Expedia backed that gap with results: first-quarter gross bookings rose 13%, revenue 15%, and adjusted EBITDA 83% year over year, funded by $3.75B of quarterly free cash flow and a new $5B buyback authorization. Trip.com's headline 6x trailing multiple looks cheap but carries a data-quality caveat on the underlying figures, and MakeMyTrip's 148x trailing multiple is not meaningful pending its next print.

On the AI-disintermediation fear that drove the group's original de-rating, Booking's own July report pushed back directly: management said AI-driven trip planners were increasing conversion and lowering customer-acquisition cost, the opposite of the feared outcome. Google's unlaunched agentic AI Mode booking feature, which would route flight and hotel bookings through partners including Booking.com and Expedia, triggered a sell-off on announcement, but at least one analyst called that reaction overblown since OTAs still fulfill and service the bookings Google routes to them.

The setup

Where it stands — Booking and Expedia's rally is earnings- and trend-confirmed; MakeMyTrip and Trip.com's price gains are not yet backed by comparable fundamentals. Would confirm — Trip.com's next guided quarter stabilizing above the 3-8% range, or MakeMyTrip's August 3 report showing bookings growth above the 3.4% consensus. Would invalidate — A further Trip.com guidance cut or a Booking/Expedia rise in marketing spend relative to gross bookings. Watch next — MakeMyTrip reports FY2027 Q1 results August 3, 2026; Expedia reports Q2 results August 5, 2026. Valuation — Booking near 24x trailing versus an 8% free-cash-flow yield; Expedia near 12-14x cash-adjusted; Trip.com near 6x trailing (data flagged); MakeMyTrip not meaningful pending results.

Valuation & fundamentals

TickerMkt capP/EP/E fwdP/SP/S fwdEV/EBITDAFCF yld
BKNG$149.5B25.3x18.5x5.4x5.1x16.0x6.0%
EXPE$33.7B24.6x14.8x2.2x2.1x10.0x13.9%
MMYT$5.4B114.6x109.7x5.1x4.5x30.0x2.5%
TCOM$29.6B6.6x2.0x3.1x0.4x4.8x6.8%

Consensus projections

TickerFY2026EFY2027EFY2028E
BKNGRevenue+9.8%+9.2%+8.3%
EPS+14.8%+17.8%+16.2%
EXPERevenue+9.6%+7.0%+7.9%
EPS+29.3%+15.7%+18.3%
MMYTRevenue+12.6%+7.4%+17.2%
EPS−48.0%+18.9%+89.4%
TCOMRevenue+9.6%+10.9%+10.5%
EPS−48.1%+17.1%+10.5%

Forward fiscal years only. Blank means no analyst coverage for that year.

AI-Rack Assemblers Raise Guidance as Their Charts All Roll Over Together

Celestica, Jabil and Sanmina all beat-and-raised on AI-server and networking demand in July 2026, yet every name in the six-stock EMS cohort saw its uptrend band downgraded in the same three-week window — a pattern that points to a sector-wide AI-hardware selloff, not company-specific disappointment, driving the pullback.

CLSFLEXJBLSANMBHEPLXSAMDNVDATechnology > Hardware, Equipment & Parts > Electronic Manufacturing ServicesData Center: Servers, Storage & ODM/EMSAI2: Liquid Cooling / QDs, Two-Phase & Fluid HandlingSEMIData Center: AI Accelerators & GPUsSEMI: Fabless / AI & Compute DesignersAI2: Semiconductors / Memory, Foundry & LogicMag 7NUCLEAR: Hyperscalers / Demand CatalystsGavin Baker May 2026: Top Holdings
TickerCompanySegmentTrend30D1Y
CLSCelesticaElectronic Manufacturing Services🟢 Cont. Bull−5.4%+64.5%
FLEXFlexElectronic Manufacturing Services🟢 Cont. Bull−18.0%+123.3%
JBLJabilElectronic Manufacturing Services🟢 Cont. Bull−6.9%+41.9%
SANMSanminaElectronic Manufacturing Services🟢 Cont. Bull−14.7%+59.0%
BHEBenchmark ElectronicsElectronic Manufacturing Services🟢 Cont. Bull−6.8%+103.8%
PLXSPlexusElectronic Manufacturing Services🟢 Cont. Bull−8.7%+93.9%
AMDAdvanced Micro DevicesAI & Data Center GPUs🟢 Cont. Bull−13.7%+169.3%
NVDANVIDIAAI & Data Center GPUs🟢 Cont. Bull+2.7%+11.5%

12-month price & trend

CLS
Celestica
331
−21.15 (−6.00%)
vs. prior close
Price20d50d150d
CLS 12-month price
Electronic Manufacturing Services
FLEX
Flex
114
+1.84 (+1.64%)
vs. prior close
Price20d50d150d
FLEX 12-month price
Electronic Manufacturing Services
JBL
Jabil
315
+6.53 (+2.12%)
vs. prior close
Price20d50d150d
JBL 12-month price
Electronic Manufacturing Services
SANM
Sanmina
186
+2.08 (+1.13%)
vs. prior close
Price20d50d150d
SANM 12-month price
Electronic Manufacturing Services
BHE
Benchmark Electronics
79.77
+0.35 (+0.44%)
vs. prior close
Price20d50d150d
BHE 12-month price
Electronic Manufacturing Services
PLXS
Plexus
251
+9.35 (+3.86%)
vs. prior close
Price20d50d150d
PLXS 12-month price
Electronic Manufacturing Services
AMD
Advanced Micro Devices
476
−9.24 (−1.90%)
vs. prior close
Price20d50d150d
AMD 12-month price
AI & Data Center GPUs
NVDA
NVIDIA
201
+5.71 (+2.93%)
vs. prior close
Price20d50d150d
NVDA 12-month price
AI & Data Center GPUs

Six contract manufacturers that assemble servers, networking switches and power-and-cooling hardware for hyperscale data centers — Celestica, Flex, Jabil, Sanmina, Benchmark Electronics and Plexus — have been the quietest AI-buildout trade on the board, up between 44% and 130% over the trailing year. Then, in a tight window from June 30 to July 22, 2026, every one of the six had its trend band downgraded from a sustained uptrend to a milder one, and each gave back ground in July, with declines from 8% (Celestica) to 26% (Flex), averaging roughly 17%.

The synchronized cracking looks like sector rotation, not company failure. A broader AI-hardware selloff in mid-July wiped out more than $1 trillion in market value across chip and infrastructure names on doubts about hyperscaler capex growth — hourly GPU rental prices reportedly fell roughly 31% over three weeks — and global tech stocks led a steep selloff around July 17 on the same worry. That's the proximate catalyst, and it's macro, not company-specific: Celestica, Jabil and Sanmina all beat-and-raised guidance in the same window their charts cracked.

Business momentum vs. the tape

Celestica, the Toronto-based contract manufacturer shifting from commodity assembly toward higher-margin, self-designed AI rack and 1.6-terabit networking-switch programs, raised FY26 revenue guidance from $17 billion to $19 billion and adjusted EPS from $8.75 to $10.15 even as its stock fell 35% from its June 2 high. Jabil, a diversified manufacturer whose Intelligent Infrastructure unit covers AI servers, networking and capital equipment, posted Q3 revenue up 12% year over year with Intelligent Infrastructure up 21%, won a third hyperscale customer, and raised its FY26 outlook to roughly $35 billion. Sanmina, which acquired AMD's ZT Systems rack-scale AI-server manufacturing business, reported record revenue with ZT Systems contributing $1.1 billion and its cloud-AI segment up 173% year over year. On the fundamentals, momentum is accelerating, not cracking.

Valuation is where the story splits. Celestica now trades around 2x sales versus 3.1x-3.45x in May — real multiple compression even as guidance rose — with a forward multiple near 30x that sits at the low end of its post-2024 re-rate range from single-digit multiples rather than looking newly stretched. Jabil trades near a 24x forward multiple against a 45-50x trailing range recorded in May, and Sanmina's price-to-sales sits below 1x despite the ZT Systems ramp — both reasonably priced against their growth. Flex, whose Anord Mardix power-and-cooling unit is slated for a tax-free spinoff, fell 26% in July on what one report called profit-taking ahead of its earnings date rather than a negative print. Plexus and Benchmark, both diversified toward aerospace, defense and medical customers with limited direct AI-rack exposure, rallied alongside the AI-pure-play names anyway — a sign part of the cohort's gain rides sector sentiment rather than disclosed AI revenue.

The net picture is a genuine divergence rather than a clean story: the axis measuring the business — bookings, guidance, hyperscaler wins — confirms the rally, while the tape, and Celestica's multiple specifically, has already de-rated. That's a possible dislocation, not a fundamental unwind.

The setup

Where it stands — All six EMS names beat-and-raised into a July selloff that downgraded every trend band without a matching guidance cut. Would confirm — Celestica, Jabil or Sanmina AI-segment revenue growth decelerates or hyperscaler customer concentration worsens in the next print. Would invalidate — Trend bands recover to sustained-uptrend status while guidance holds, signaling the July move was rotation, not a reset. Watch next — Celestica's next earnings call and any update on its roughly $1.5 billion FY27 capex against hyperscaler capex-digestion commentary. Valuation — Celestica ~2x sales (down from 3.1-3.45x) and ~30x forward EPS; Jabil ~24x forward vs 45-50x trailing; Sanmina price-to-sales below 1x.

Valuation & fundamentals

TickerMkt capP/EP/E fwdP/SP/S fwdEV/EBITDAFCF yld
CLS$38.1B34.1x29.4x2.4x1.9x25.5x1.4%
FLEX$41.7B43.9x24.2x1.4x1.2x20.8x2.6%
JBL$33.0B38.9x24.7x1.0x0.9x16.7x4.6%
SANM$9.9B32.6x15.3x0.8x0.7x15.8x10.3%
BHE$2.9B53.9x27.0x1.0x1.0x19.8x5.4%
PLXS$6.7B36.3x29.3x1.5x1.4x27.0x0.9%
AMD$776.4B154.6x63.5x20.7x15.5x95.8x1.1%
NVDA$5.5T45.6x27.1x25.4x14.8x37.9x1.8%

Consensus projections

TickerFY2026EFY2027EFY2028E
CLSRevenue+64.9%+65.9%+32.5%
EPS+88.7%+73.4%+36.1%
FLEXRevenue+6.8%+26.3%+30.0%
EPS+24.2%+44.7%+51.0%
JBLRevenue+20.2%+21.2%+12.1%
EPS+35.9%+31.0%+20.3%
SANMRevenue+74.9%+15.8%+11.8%
EPS+103.4%+15.2%+12.7%
BHERevenue+13.3%+7.8%
EPS+26.7%+13.0%
PLXSRevenue+20.8%+13.8%+9.0%
EPS+19.5%+15.6%+12.0%
AMDRevenue+47.1%+58.4%+35.0%
EPS+89.3%+83.9%+39.8%
NVDARevenue+65.1%+73.1%+33.0%
EPS+59.0%+77.2%+35.7%

Forward fiscal years only. Blank means no analyst coverage for that year.

IT-Services Cohort Jumps 15-40% in a Week as Bookings and Guidance Fall

Seven of eight major IT-consulting and systems-integration stocks surged 12-43% in the final week of July on a rotation out of AI-chip names, even as Accenture's bookings fell and Infosys, Cognizant, EPAM and Globant all cut or lowered guidance in their latest prints — a valuation-driven bounce, not yet a fundamentals-confirmed reversal.

ACNCTSHEPAMINFYWITGIBGLOBGDYNTechnology > Information Technology Services > Enterprise Consulting & Systems IntegrationAI2: AI-Enabled IT Services & ConsultingJune 2026 52wk low: IT Services & Crypto TreasuryIT Services
TickerCompanySegmentTrend30D1Y
ACNAccentureEnterprise Consulting & Systems Integration🔴 Cont. Bear+22.6%−34.6%
CTSHCognizant Technology SolutionsEnterprise Consulting & Systems Integration🔴 Cont. Bear+33.8%−21.2%
EPAMEPAM SystemsEnterprise Consulting & Systems Integration🔴 Cont. Bear+21.5%−31.1%
INFYInfosysEnterprise Consulting & Systems Integration🔴 Cont. Bear+10.6%−25.9%
WITWiproEnterprise Consulting & Systems Integration🔴 Cont. Bear+7.6%−25.8%
GIBCGIEnterprise Consulting & Systems Integration🔴 Cont. Bear+10.2%−24.3%
GLOBGlobantEnterprise Consulting & Systems Integration🔴 Cont. Bear+18.3%−55.4%
GDYNGrid DynamicsEnterprise Consulting & Systems Integration🔴 Cont. Bear+16.4%−14.7%

12-month price & trend

ACN
Accenture
166
+2.63 (+1.61%)
vs. prior close
Price20d50d150d
ACN 12-month price
Enterprise Consulting & Systems Integration
CTSH
Cognizant Technology Solutions
55.35
+1.45 (+2.70%)
vs. prior close
Price20d50d150d
CTSH 12-month price
Enterprise Consulting & Systems Integration
EPAM
EPAM Systems
106
+1.90 (+1.83%)
vs. prior close
Price20d50d150d
EPAM 12-month price
Enterprise Consulting & Systems Integration
INFY
Infosys
12.03
+0.08 (+0.67%)
vs. prior close
Price20d50d150d
INFY 12-month price
Enterprise Consulting & Systems Integration
WIT
Wipro
1.98
+0.03 (+1.54%)
vs. prior close
Price20d50d150d
WIT 12-month price
Enterprise Consulting & Systems Integration
GIB
CGI
73.15
−0.09 (−0.12%)
vs. prior close
Price20d50d150d
GIB 12-month price
Enterprise Consulting & Systems Integration
GLOB
Globant
36.60
+0.21 (+0.58%)
vs. prior close
Price20d50d150d
GLOB 12-month price
Enterprise Consulting & Systems Integration
GDYN
Grid Dynamics
6.89
−0.17 (−2.41%)
vs. prior close
Price20d50d150d
GDYN 12-month price
Enterprise Consulting & Systems Integration

Accenture, the world's largest IT-consulting and systems-integration firm; Cognizant, a US-based technology-services provider to healthcare and financial clients; Infosys and Wipro, two of India's largest IT-outsourcing conglomerates; EPAM Systems, a software-engineering consultancy with a heavily Ukraine-based delivery workforce; Globant, a Latin America-centered digital-engineering shop; CGI Group, a Canadian IT-services firm; and Grid Dynamics, a small-cap AI and data-engineering consultancy — together make up the enterprise IT-services cohort that has spent roughly a year being repriced as the industry most exposed to AI eating labor-arbitrage headcount. In the week of July 27-31, most of that repricing reversed at once.

What actually moved, and why

Six of eight names rose between roughly 15% and 43% between the June 29 and July 31 closes, with the bulk of the gain compressed into a three-day window around July 27-29 — a sharp, catalyst-driven jump rather than a gradual grind. The trigger was sector rotation: a roughly $1 trillion selloff in AI-chip stocks pushed capital into "asset-light" services names, and on July 27 Jefferies upgraded Indian IT services from underweight to neutral, explicitly framing the call as being about positioning rather than earnings even as it kept sector revenue growth guidance in the low-to-mid single digits through fiscal 2028. Nifty IT rose roughly 16% in July on the same rotation. Wipro was the cohort's diverger, falling about 9% over the same window, consistent with its own Q1 FY26 print showing operating margin compressing 130 basis points on wage inflation and AI-investment spend.

The two verdicts disagree

Business momentum does not support the rally. Accenture's new bookings fell to $19.3B from $19.7B a year earlier, a book-to-bill deceleration, while its federal unit continues to absorb contract cancellations — it lost the Military OneSource contract to Leidos and saw about $93M of task orders cancelled. Infosys cut FY27 constant-currency growth guidance to 1.5%-3.0% even as its stock rose on the print. Cognizant lowered full-year revenue guidance while raising EPS guidance mainly through $1.1B of buybacks rather than organic growth. EPAM had already cut 2026 revenue guidance to 4.0%-6.5% in May, and Globant guided next-quarter revenue essentially flat to down. Valuation is the more supportive leg: Accenture's trailing multiple was 10.3x before the rally and roughly 13.7x after, Cognizant's moved from 8.7x to about 12.4x, and Infosys from 13.5x to about 15.1x — all still below the group's historical 20x-plus range, leaving room even after the bounce.

The technical picture is unresolved. Accenture, Cognizant and Infosys — the cohort's three largest names — remained in a confirmed multi-quarter downtrend through July 31 despite the price surge, with no bullish crossover yet registered. The smaller names that appeared to flip did so only into a flat, zero-strength reading that coincides with a data gap in closing prices on July 28 across several tickers, which looks more like a signal artifact than a confirmed reversal.

The setup

Where it stands — Cohort rallied 12-43% in a week on rotation and a positioning-based analyst upgrade, not improved bookings or guidance. Would confirm — Accenture, Cognizant or Infosys trend bands cross into a confirmed uptrend, or next-quarter bookings/book-to-bill turn up year over year. Would invalidate — Accenture's Q4 FY26 bookings (due mid-September) fall again year over year or guidance is cut further across the cohort. Watch next — Accenture's fiscal Q4 2026 earnings report, expected mid-September 2026. Valuation — ACN ~13.7x trailing vs 10.3x pre-rally and a ~20-25x historical range; CTSH ~12.4x vs 8.7x; INFY ~15.1x vs 13.5x.

Valuation & fundamentals

TickerMkt capP/EP/E fwdP/SP/S fwdEV/EBITDAFCF yld
ACN$103.9B13.6x12.2x1.4x1.4x8.5x12.0%
CTSH$22.3B10.1x8.3x1.0x1.0x5.5x11.1%
EPAM$4.9B12.9x7.1x0.9x0.8x6.1x11.2%
INFY$49.0B14.1x14.7x2.3x2.4x9.3x7.9%
WIT$19.8B15.1x0.1x2.2x0.0x11.7x7.2%
GIB$13.7B11.0x6.9x1.2x0.8x7.4x12.2%
GLOB$1.7B15.3x6.2x0.7x0.7x5.8x18.0%
GDYN$561.1M107.6x15.0x1.4x1.3x19.3x4.2%

Consensus projections

TickerFY2026EFY2027EFY2028E
ACNRevenue+6.7%+5.3%+6.3%
EPS+7.7%+7.7%+8.7%
CTSHRevenue+5.8%+5.1%+6.0%
EPS+9.9%+7.9%+10.1%
EPAMRevenue+5.5%+5.8%+7.0%
EPS+14.2%+8.6%+8.5%
INFYRevenue+1.6%+6.1%+5.1%
EPS+2.3%+7.5%+6.2%
WITRevenue+5.4%+5.9%+4.0%
EPS+4.6%+6.1%+5.1%
GIBRevenue+5.6%+2.6%+2.2%
EPS+9.8%+8.9%+9.4%
GLOBRevenue+1.2%+5.3%+5.9%
EPS+2.3%+6.0%+6.3%
GDYNRevenue+7.0%+10.5%+13.5%
EPS+13.4%+19.6%+21.3%

Forward fiscal years only. Blank means no analyst coverage for that year.

Ambarella's Rally Is an NXP Rumor, Not a Result; CEVA's Slide Isn't Royalties

Ambarella's 25% five-day surge traces to an unconfirmed NXP takeover report, not to earnings — reported revenue growth has roughly halved and inventory has swollen even as the stock pushes toward a rich forward multiple. CEVA's simultaneous slide traces to a chief operating officer exit and a sector-wide chip selloff, not to royalty deterioration — a possible dislocation, not a coherent 'edge AI' cohort turn.

AMBACEVANXPIEdge AI SemiconductorsSemiconductorsAI2: Edge Inference, Specialty Insurance & RiskSEMI: Fabless / Analog, Auto & Specialty
TickerCompanySegmentTrend30D1Y
AMBAAmbarellaSpecialty Semiconductors🟢 Cont. Bull+7.9%+34.4%
CEVACEVASpecialty Semiconductors🌱 Emerging Bull−26.9%+50.9%
NXPINXP SemiconductorsAnalog & Mixed-Signal🟢 Cont. Bull−18.3%+9.6%

12-month price & trend

AMBA
Ambarella
86.00
+11.91 (+16.08%)
vs. prior close
Price20d50d150d
AMBA 12-month price
Specialty Semiconductors
CEVA
CEVA
32.65
−0.24 (−0.73%)
vs. prior close
Price20d50d150d
CEVA 12-month price
Specialty Semiconductors
NXPI
NXP Semiconductors
229
−16.00 (−6.53%)
vs. prior close
Price20d50d150d
NXPI 12-month price
Analog & Mixed-Signal

What actually moved these stocks

Ambarella, a fabless designer of low-power vision chips used in security cameras, robotics and automotive driver-assistance systems, closed at $86.00 on July 31, up roughly 24.6% over five sessions and 16.1% in a single day. The move was not an earnings beat or a design-win conversion — it followed a Financial Times report, relayed by SiliconAngle, that NXP Semiconductors is in preliminary talks to acquire Ambarella, discussions the report itself called unconfirmed and possibly going nowhere. Coverage of the same report noted NXP's automotive business already accounts for roughly half its $15.1B revenue, and NXP shares fell on the news while Ambarella's jumped. Ambarella's own Q1 FY2027 results, reported in late May, showed revenue growth decelerating to 16.9% year over year from 37% for the prior full fiscal year, with inventory days ballooning to 145 from 99 on a pre-build ahead of expected memory-chip price hikes — the opposite of what a demand inflection should look like.

CEVA, a fabless licensor of digital-signal-processor and AI inference IP that earns royalties across consumer, automotive and robotics chips rather than selling silicon directly, fell roughly 18-19% into July 29 before a partial recovery. That drop coincided with disclosure that chief operating officer Michael Boukaya agreed to step down from his operating role effective August 1, even as CEVA's own reporting showed royalty revenue flat year over year with smart-edge royalties up 8% and a new NeuPro-M AI licensing deal signed with a major platform partner in the same window — no sign of the unit-volume or royalty-rate deterioration that would justify the drop on fundamentals alone.

The wider chip market, and where the two names sit

Both declines landed atop a broader rout: chip stocks including SK Hynix, Samsung and SoftBank shed more than $1 trillion in market value the week of July 28-29 on AI-debt jitters and China chipmaking progress, a move Bloomberg framed as a deepening rotation away from AI-exposed tech. AMBA and CEVA actually tracked each other through most of the spring and summer — both sat in sustained uptrends simultaneously from late May through late July — so the split the hypothesis flags is confined to the final week and traces to two unrelated headlines, not a genuine cohort turn. Socket competition is real regardless: Qualcomm's 2026 Dragonwing IQ10 launch was explicitly positioned as a power-efficient alternative to NVIDIA Jetson for the same edge-vision workloads both companies depend on.

On valuation, Ambarella trades near 98x forward non-GAAP earnings and about 6.8x forward sales against roughly 13% consensus growth, with trailing price-to-sales at 7.72x — a multiple a July fundamentals memo pegged as fair value below $60, well under the current print. CEVA's trailing price-to-sales sits near 10.09x; its forward multiple could not be independently confirmed this cycle, so its valuation picture is directionally a possible dislocation — a falling price with no visible fundamental deterioration — rather than a fully quantified one.

The setup

Where it stands — AMBA rallied on unconfirmed M&A talk while revenue growth decelerated and inventory built; CEVA fell on a COO exit and sector selloff despite flat-to-rising royalties. Would confirm — A completed or formally confirmed NXP-Ambarella transaction, or Ambarella's next quarterly revenue reaccelerating above 20% YoY. Would invalidate — NXP or Ambarella confirming no deal is proceeding, or Ambarella's inventory days failing to normalize toward 100 next quarter. Watch next — Ambarella's Q2 FY2027 results, due roughly late August 2026, the first since the NXP report. Valuation — AMBA near 98x forward EPS and 6.8x forward sales versus a memo-cited fair value below $60; CEVA near 10x trailing sales, forward multiple unconfirmed.

Valuation & fundamentals

TickerMkt capP/EP/E fwdP/SP/S fwdEV/EBITDAFCF yld
AMBA$3.8Bn/m108.8x9.3x8.5xn/m0.7%
CEVA$909.6Mn/m61.5x8.1x7.4xn/m-0.6%
NXPI$73.6B27.8x19.9x5.8x5.2x18.1x4.0%

Consensus projections

TickerFY2026EFY2027EFY2028E
AMBARevenue+39.8%+13.2%+12.9%
EPS−310.8%+32.6%+36.5%
CEVARevenue+12.3%+13.7%+11.8%
EPS+27.5%+54.9%+23.5%
NXPIRevenue+14.6%+10.6%+8.1%
EPS+24.5%+19.5%+16.8%

Forward fiscal years only. Blank means no analyst coverage for that year.

Cactus's Earnings Beat, Not a Sector Rebound, Drove the Wellhead Rally

A 30-day gain across three wellhead and pressure-control equipment names looks like a broad, gradual re-rating, but nearly all of it landed in two trading days: Cactus (WHD) beat Q2 estimates and jumped 18.5% in a session, while Innovex (INVX) and HMH Holding (HMH) rallied in apparent sympathy before either had reported its own quarter. The result is a valuation split — WHD now trades far richer than HMH despite similar price moves — against a US land-activity backdrop that is still flat to softening.

WHDINVXHMHWTTREnergy > Oil & Gas Equipment & Services > Wellhead & Pressure ControlNATGAS: OFS / Water, Sand & Proppant Logistics
TickerCompanySegmentTrend30D1Y
WHDCactusWellhead & Pressure Control🌱 Emerging Bull+28.8%+64.7%
INVXInnovex InternationalWellhead & Pressure Control🟢 Cont. Bull+18.9%+75.7%
HMHHMHWellhead & Pressure Control🔴 Cont. Bear+13.2%+7.8%
WTTRSelect Water SolutionsWater Services & Energy Solutions🟢 Cont. Bull+2.3%+109.4%

12-month price & trend

WHD
Cactus
65.01
+3.01 (+4.85%)
vs. prior close
Price20d50d150d
WHD 12-month price
Wellhead & Pressure Control
INVX
Innovex International
28.08
+1.52 (+5.72%)
vs. prior close
Price20d50d150d
INVX 12-month price
Wellhead & Pressure Control
HMH
HMH
20.79
+0.67 (+3.33%)
vs. prior close
Price20d50d150d
HMH 12-month price
Wellhead & Pressure Control
WTTR
Select Water Solutions
18.52
+0.36 (+1.98%)
vs. prior close
Price20d50d150d
WTTR 12-month price
Water Services & Energy Solutions

Cactus, Inc. (WHD), which designs, manufactures and rents wellhead and pressure-control equipment for onshore unconventional wells in the US, Australia, China and Saudi Arabia, posted Q2 2026 revenue of $449.5M against a $399.3M consensus estimate, with adjusted EPS of $0.93 and operating income up 68% year over year. Its Pressure Control segment grew 14.6% sequentially on Middle East shipments and Cactus International backlog execution, and its Flexsteel spoolable-pipe unit grew 17.4% sequentially. That print, released around July 29, produced an 18.5% one-session jump in the stock and effectively accounts for the entire 30-day gain attributed to the wider segment.

The other two names swept into the "quiet compounder" framing did not confirm anything of their own. Innovex International (INVX), formed via the 2024 Innovex/Dril-Quip merger and now drawing roughly 43% of revenue from international and offshore subsea work, rallied 9.5% over the same window even though its Q2 release was not scheduled until August 3 — after the price move. HMH Holding (HMH), a roughly $969M maker of engineered drilling and pressure-control equipment, gained 10.2% even though its own Q2 print was set for August 5, and its most recent reported quarter showed revenue down 13.7% year over year. Neither the 30-day nor the 90-day window shows a uniform advance: HMH was actually down 6.4% over 90 days before the late-July pop, and only WHD had moved into an uptrend on its own trend signal by month-end, with INVX and HMH still reading as neutral rather than bullish.

Valuation is where the split sharpens. WHD's trailing price-to-earnings ratio stood near 48.6x just before its earnings pop — already well above the roughly 23x level cited in prior coverage — and has since expanded further. HMH, despite its own rally, trades at 22.3x trailing and 15.0x forward earnings, with an EV/EBITDA multiple of 8.0x, cheaper than WHD across every comparable measure even after both moved. On growth, the businesses are diverging as much as the multiples: WHD's revenue accelerated to +38.5% year over year in its most recent quarters with expanding operating margins, while HMH's revenue is still contracting and INVX remains loss-making pending its own print. Business momentum explains WHD's advance; it does not yet explain INVX's or HMH's.

The activity backdrop cuts against a segment-wide re-rating story. US land rig count held near 572 for the week of July 24, essentially flat, while the US frac-spread count fell to 196 active crews, down nine over two weeks. Halliburton described its North America business as recovering on pricing but said its completions strategy remains "on returns, not share," with a high bar for fleet reactivation — majors are not chasing volume. Gas-basin activity is the partial offset: Haynesville gas-directed drilling hit a 32-month high in February 2026 as Golden Pass LNG's Train 1 began production in March, ramping feedgas demand, though Haynesville rig counts have since pulled back again. Select Water Solutions (WTTR), an oilfield-water infrastructure operator cited as sector corroboration, has held a sustained uptrend for roughly seven months — a genuinely different, contracted-revenue business model from the cyclical equipment names, and its persistence does not by itself validate their move.

The setup

Where it stands — WHD's earnings-driven rally is confirmed by its own numbers; INVX and HMH rose in sympathy ahead of unreported quarters. Would confirm — INVX and HMH report Q2 revenue growth and margin expansion in line with WHD's beat, not just guided optimism. Would invalidate — INVX or HMH miss consensus or guide H2 aftermarket ramp lower when they report August 3 and August 5. Watch next — INVX earnings August 3 and HMH earnings August 5, 2026, plus the next Baker Hughes frac-spread count. Valuation — WHD near 48.6x trailing (expanding further post-beat); HMH 22.3x trailing / 15.0x forward vs an 8.0x EV/EBITDA anchor.

Valuation & fundamentals

TickerMkt capP/EP/E fwdP/SP/S fwdEV/EBITDAFCF yld
WHD$4.0B53.7x22.6x3.3x2.5x11.5x7.7%
INVX$1.9B37.2x19.0x2.0x1.9x8.8x7.6%
HMH$969.3M22.3x15.0x1.2x1.2x8.0x7.2%
WTTR$2.0B96.7x36.6x1.4x1.4x8.3x-4.8%

Consensus projections

TickerFY2026EFY2027EFY2028E
WHDRevenue+45.2%+7.1%+4.7%
EPS−0.7%+33.1%+26.1%
INVXRevenue+4.7%+10.1%+2.4%
EPS+32.4%+26.5%+14.6%
HMHRevenue+0.2%+14.8%+5.6%
EPS+52.7%+10.9%
WTTRRevenue+5.5%+5.2%+3.9%
EPS+112.0%+36.1%+59.7%

Forward fiscal years only. Blank means no analyst coverage for that year.

Physical-AI Basket's 80% Year Is Mostly a Teradyne Chip-Test Story

The watchlist's four-name "Robotics & Physical AI" bucket looks like a unified bull cohort at the index level, but the one-year gain is carried almost entirely by Teradyne's semiconductor-test boom — while Symbotic has fallen 24% and sat in a sustained downtrend since May even as its backlog, margins and revenue growth all improved, a genuine split between the tape and the fundamentals ahead of both companies' Aug 5 earnings.

TERCGNXROKSYMOUSTAI2: Robotics & Physical AIVision / Sensing & PerceptionNUCLEAR: Adjacent / Cybersecurity, Robotics & IsotopesData Center: Semiconductor Test (ATE)SEMI: Equipment / Test & Back-EndData Center: Logistics, Telecom & AdjacentNATGAS: Automation / Industrial Process ControlNUCLEAR: Components / Pumps, Valves & Instrumentation
TickerCompanySegmentTrend30D1Y
TERTeradyneSemiconduct Equipment🟢 Cont. Bull−3.1%+248.6%
CGNXCognexPrecision Motion & Sensors🟢 Cont. Bull−6.1%+58.3%
ROKRockwell AutomationIndustrial Automation & Controls🟢 Cont. Bull−0.6%+38.6%
SYMSymboticIndustrial Automation & Controls⚠️ Emerging Bear−3.2%−23.9%
OUSTOusterSpecialty Manufacturing & Components🌱 Emerging Bull−21.7%+63.3%

12-month price & trend

TER
Teradyne
368
+2.20 (+0.60%)
vs. prior close
Price20d50d150d
TER 12-month price
Semiconduct Equipment
CGNX
Cognex
65.24
+2.62 (+4.18%)
vs. prior close
Price20d50d150d
CGNX 12-month price
Precision Motion & Sensors
ROK
Rockwell Automation
480
+9.07 (+1.93%)
vs. prior close
Price20d50d150d
ROK 12-month price
Industrial Automation & Controls
SYM
Symbotic
43.05
+0.11 (+0.26%)
vs. prior close
Price20d50d150d
SYM 12-month price
Industrial Automation & Controls
OUST
Ouster
39.01
+3.48 (+9.79%)
vs. prior close
Price20d50d150d
OUST 12-month price
Specialty Manufacturing & Components

The four-stock "AI2: Robotics & Physical AI" bucket — Symbotic (SYM), Rockwell Automation (ROK), Cognex (CGNX) and Teradyne (TER) — has returned roughly 80% on average over the past year, a number that reads like a broad physical-AI re-rating. It isn't. Teradyne, which makes automated test equipment for chips and also owns the Universal Robots and MiR collaborative-robot brands, is up 248% over the same stretch, single-handedly dragging the average; Cognex, which sells machine-vision sensors and software used in factory and logistics automation, is up a more modest 58%, and Rockwell Automation, the industrial-controls and automation-systems maker, is up 37%. Symbotic, which builds robotic warehouse-automation systems and derives more than 84% of revenue from Walmart, is down 24% over the same year — the opposite direction from the label the bucket carries.

The chip-test cycle, not robotics

Teradyne's Q2 2026 revenue hit a record $1.33B, up 104% year over year, and the company beat its own guidance for a second straight record quarter. That was driven almost entirely by Semiconductor Test, which posted $1.12B, up 128% YoY and 84% of total sales, on HBM and DRAM test demand. The robotics arm did grow — Universal Robots and MiR posted a first-ever $100M quarter, up 33% YoY — but at roughly 7.5% of revenue it is a rounding error next to the test business. Business momentum genuinely explains the move, but the price has run ahead: Teradyne trades near 81x trailing earnings and 18x trailing sales, both expanding even as an earnings-tracking recap flags sequentially declining Q3 guidance after two record quarters — growth confirms, but the multiple leaves little room for a stumble.

Cognex and Rockwell: a genuine, if pricier, industrial turn

Cognex's Q1 2026 revenue grew 24% YoY, with logistics posting its ninth straight quarter of double-digit growth; it has held a sustained uptrend on its price chart since late April, with its next print due Aug 5. At roughly 75x trailing earnings, the user's own research notes call the multiple a stretch that needs sustained double-digit EPS growth to justify, and flag Keyence and Chinese entrants gaining share in North American machine vision — a risk the price trend doesn't capture. Rockwell posted 9% organic sales growth with North America organic orders up 10% and a longer-cycle book-to-bill of 1.07, against a US manufacturing PMI that sat at 53.8 in July — expansionary, not soft. Rockwell reports Q3 on Aug 4, with book-to-bill again the number analysts are watching. Both names confirm on fundamentals; both are also priced near the high end of their own multiple history.

The real divergence: Symbotic and Ouster

Symbotic is the outlier. Its backlog stood at $22.7B and revenue grew 29% YoY with a first double-digit EBITDA margin, guidance for its Aug 5 print calls for $700-720M revenue — yet the stock has fallen 24% over the year and its trend has read persistently negative since May, its multiple compressing from over 14x to under 10x sales on unchanged or improving fundamentals. The overhang is more than 84% Walmart revenue concentration and a still-live SEC investigation tied to a 2024 revenue-recognition restatement. Ouster, the overlapping lidar-sensor maker paired with Cognex in the vision bucket, shows the same tape-lags-reality pattern in reverse: Q1 2026 revenue grew 49% YoY but gross margin fell to 43% from 60% the prior quarter, even as its price trend has not yet turned down despite a 22% monthly decline.

The setup

Where it stands — Cohort gain is concentrated in Teradyne's chip-test cycle; Symbotic diverges from its own improving fundamentals, trading down while backlog and margins rise. Would confirm — Symbotic's Aug 5 print shows backlog growth continuing and Walmart concentration declining toward diversified customers. Would invalidate — Teradyne's Q3 guide confirms a sequential revenue decline with Semiconductor Test book-to-bill falling back toward 1.0. Watch next — Cognex and Symbotic both report Aug 5, 2026; Rockwell reports Aug 4, 2026. Valuation — TER ~81x trailing P/E; CGNX ~75x; ROK ~50x, near its historical high; SYM unprofitable at ~9.9x trailing sales, down from 14.5x in May.

Valuation & fundamentals

TickerMkt capP/EP/E fwdP/SP/S fwdEV/EBITDAFCF yld
TER$57.6B50.2x39.9x12.9x11.2x39.4x1.6%
CGNX$10.9B75.9x43.6x10.4x9.8x43.4x2.2%
ROK$53.4B49.7x36.8x6.1x6.0x34.5x2.5%
SYM$27.6Bn/m84.0x11.0x9.9x2.7%
OUST$2.2Bn/m12.0x10.1xn/m-3.1%

Consensus projections

TickerFY2026EFY2027EFY2028E
TERRevenue+67.0%+22.9%+22.9%
EPS+158.9%+27.6%+31.5%
CGNXRevenue+13.2%+8.9%+10.4%
EPS+55.4%+20.6%+22.8%
ROKRevenue+9.1%+5.6%+6.1%
EPS+29.7%+12.1%+11.4%
SYMRevenue+25.1%+28.9%+26.1%
EPS+110.9%+62.5%+9.3%
OUSTRevenue+48.9%+36.4%+34.1%
EPS−19.1%−76.5%−2236.4%

Forward fiscal years only. Blank means no analyst coverage for that year.

Containership Lessors Compound Cheap as Legacy Charters Roll Off Into Delivery Wave

The container-shipping category's +53.5% one-year gain blends a genuine, still-cheap three-name lessor rally (Costamare, Danaos, Global Ship Lease) with a merger-arbitrage stock (ZIM), a tariff-driven volume story (Matson), and a mislabeled LNG carrier (CCEC). The lessor trio's advance tracks earnings rather than multiple expansion, but management is already flagging legacy high-rate charters re-fixing lower just as a record delivery wave and Red Sea normalization approach.

CCECCMREDACGSLMATXZIMIndustrials > Marine Shipping > Container ShippingNATGAS: LNG / Marine Shipping
TickerCompanySegmentTrend30D1Y
CCECCapital Clean Energy CarriersContainer Shipping🟢 Cont. Bull+1.4%+0.1%
CMRECostamareContainer Shipping⚠️ Emerging Bear+8.4%+49.1%
DACDanaosContainer Shipping🟢 Cont. Bull+13.8%+54.6%
GSLGlobal Ship LeaseContainer Shipping🟢 Cont. Bull+13.7%+63.4%
MATXMatsonContainer Shipping🌱 Emerging Bull−0.9%+88.5%
ZIMZIM Integrated Shipping ServicesContainer Shipping🟢 Cont. Bull+6.2%+65.2%

12-month price & trend

CCEC
Capital Clean Energy Carriers
22.28
−0.11 (−0.49%)
vs. prior close
Price20d50d150d
CCEC 12-month price
Container Shipping
CMRE
Costamare
15.58
+0.09 (+0.58%)
vs. prior close
Price20d50d150d
CMRE 12-month price
Container Shipping
DAC
Danaos
142
−1.31 (−0.92%)
vs. prior close
Price20d50d150d
DAC 12-month price
Container Shipping
GSL
Global Ship Lease
44.34
−0.13 (−0.29%)
vs. prior close
Price20d50d150d
GSL 12-month price
Container Shipping
MATX
Matson
203
−1.06 (−0.52%)
vs. prior close
Price20d50d150d
MATX 12-month price
Container Shipping
ZIM
ZIM Integrated Shipping Services
25.19
+0.46 (+1.86%)
vs. prior close
Price20d50d150d
ZIM 12-month price
Container Shipping

A category average hiding four different stories

The containership tonnage lessors are the actual story here: Costamare (CMRE), a Monaco-based owner of containerships and dry-bulk vessels chartered out under fixed-rate contracts; Danaos (DAC), a Piraeus-based owner-operator that charters its containerships to liner companies; and Global Ship Lease (GSL), a London-based owner of mid-size boxships under long-term charters. All three moved together rather than one carrying the average — CMRE up 9.3% over 30 days and 51.6% over a year, DAC up 15.8% and 55.3%, GSL up 16.3% and 57.0%. None of that gain came from multiple expansion: CMRE trades at a trailing price-to-earnings ratio of 6.00x against a forward multiple of 6.75x (forward above trailing implies falling consensus earnings), DAC at 4.56x trailing versus 4.67x forward, and GSL at 3.52x trailing — all with free-cash-flow yields near 12-13%. The rally has tracked cash generation, not a re-rating.

Growth is cushioned, not accelerating

Business momentum only partly explains the advance. Costamare's Q4 2025 call described "a fully employed market" with 96% of 2026 fleet-days and 92% of 2027 already fixed and $3.4bn of contracted revenue, but its own CFO had cautioned a quarter earlier that recent freight strength looked like tariff "front running" whose durability he couldn't forecast, and consensus now models CMRE revenue falling 14.6% into 2026. Danaos was blunter: management said on its Q1 2026 call that containership-segment revenue fell year over year specifically because legacy 2021-22 high-rate charters are rolling off and re-fixing at lower contracted rates — quarterly revenue growth there has flattened from 6.4% to essentially zero over four quarters. Near-term coverage is airtight (96-100% fixed for 2026 across the trio), but it thins fast — Danaos's 2028 coverage is only 65% — just as the orderbook-to-fleet ratio near 31.6% pushes deliveries from 1.7m to 2.8m to 3.5m TEU across 2026-2028, and as Red Sea transits cautiously resume, a shift that could release roughly 6% of global fleet capacity if it becomes wholesale, with long-haul Asia-Europe rates already down about 25% in three months. Global capacity is projected to grow 36% through 2027 even as reopening trims 2026 demand modestly. That is the divergence: valuations near historic lows, business momentum decelerating rather than confirming the price move — a supported advance heading into a tougher stretch, not a stretched one. GSL is hedging the gap anyway, locking in 10 new mid-size newbuilds worth about $917m already backed by multi-year charters, funded off a balance sheet where debt fell to $657.8m from $777.7m.

The misfits

ZIM Integrated Shipping, an Israeli container liner rather than a tonnage owner, has left this story entirely: Hapag-Lloyd agreed in February to acquire it for $35.00 a share cash, and its ~$25.19 close sits roughly 28% below deal value, pricing merger-completion risk rather than freight fundamentals; it will report Q2 without an earnings call given the pending deal. Matson (MATX), running Jones Act-protected US domestic trade alongside China transpacific volume, is a volume story: China container volume rose 15.2% year over year largely against last year's tariff shock, and it trades near 13.5-15x trailing earnings — a non-distressed multiple sharing none of the lessors' charter cushion. CCEC, despite the database label, is an LNG and multi-gas carrier, not a box-ship owner; it sits flat over the year and turned into a sustained downtrend on a documented LNG-rate glut.

The setup

Where it stands — CMRE, DAC and GSL hold near-full 2026 charter coverage at sub-6x earnings multiples that haven't expanded despite the rally. Would confirm — 2027-28 charter re-fixings holding near current rates rather than stepping down further. Would invalidate — 2028 coverage (currently 65% at DAC) filling at materially lower rates as deliveries surge. Watch next — ZIM's Aug 19, 2026 Q2 print and the Hapag-Lloyd deal's expected Q4 2026 close. Valuation — DAC 4.56x trailing/4.67x forward; CMRE 6.00x trailing/6.75x forward; both near multi-year lows, not re-rated.

Valuation & fundamentals

TickerMkt capP/EP/E fwdP/SP/S fwdEV/EBITDAFCF yld
CCEC$1.3B23.1x12.3x6.2x2.7x20.5x-0.3%
CMRE$2.1B6.0x6.7x2.4x2.6x5.2x12.7%
DAC$2.4B4.6x4.7x2.3x2.3x3.4x12.6%
GSL$1.5B3.5x4.2x1.9x2.0x3.3x24.4%
MATX$5.4B12.7x12.9x1.6x1.6x7.7x7.7%
ZIM$3.1B6.4x0.4x0.5x3.4x65.0%

Consensus projections

TickerFY2026EFY2027EFY2028E
CCECRevenue+12.3%+38.8%+6.4%
EPS−10.7%+53.1%+28.9%
CMRERevenue−14.6%+2.0%−4.0%
EPS−8.0%+0.6%−24.2%
DACRevenue+5.0%+7.1%+9.5%
EPS+6.3%−1.7%+4.3%
GSLRevenue−0.2%−5.1%−6.6%
EPS−4.2%−4.3%−4.8%
MATXRevenue+2.7%+4.4%+5.6%
EPS+7.5%+8.3%+12.0%
ZIMRevenue−12.1%−7.2%−1.1%
EPS−157.4%+58.2%+13.3%

Forward fiscal years only. Blank means no analyst coverage for that year.

Nitrogen Rally Splits: CF Holds Uptrend as Peers Slip on Fading Hormuz Windfall

The nitrogen/methanol chemicals bucket's headline +11% month and +41% year conceal a split: only CF Industries holds a confirmed uptrend while Nutrien, Methanex and LSB Industries have all rolled into bear-trend readings, and the price windfall behind the rally — a Strait of Hormuz supply shock — is already reversing as Methanex guides Q3 prices lower and 2026 US corn acreage contracts.

CFNTRMEOHLXUNATGAS: Chemicals / Nitrogen, Ammonia & Methanol
TickerCompanySegmentTrend30D1Y
CFCF IndustriesNitrogen Fertilizers🟢 Cont. Bull+10.6%+36.0%
NTRNutrienFertilizer Distribution & Retail⚠️ Emerging Bear+7.0%+17.8%
MEOHMethanexBasic Chemicals & Intermediates🟢 Cont. Bull+26.8%+70.0%
LXULSB IndustriesBasic Chemicals & Intermediates⚠️ Emerging Bear+1.0%+40.0%

12-month price & trend

CF
CF Industries
125
−0.58 (−0.46%)
vs. prior close
Price20d50d150d
CF 12-month price
Nitrogen Fertilizers
NTR
Nutrien
69.07
−1.65 (−2.33%)
vs. prior close
Price20d50d150d
NTR 12-month price
Fertilizer Distribution & Retail
MEOH
Methanex
55.55
+0.35 (+0.63%)
vs. prior close
Price20d50d150d
MEOH 12-month price
Basic Chemicals & Intermediates
LXU
LSB Industries
10.88
−0.16 (−1.45%)
vs. prior close
Price20d50d150d
LXU 12-month price
Basic Chemicals & Intermediates

The nitrogen, ammonia and methanol producers that convert cheap North American natural gas into fertilizer and industrial chemicals have posted a real cross-stock rally — roughly 11% over the past month and 41% over the past year across CF Industries, Nutrien, Methanex and LSB Industries — but the trend data underneath that average is more fractured than the headline suggests.

CF Industries, North America's largest nitrogen fertilizer producer, is the only one of the four currently holding a confirmed uptrend. Nutrien, the world's largest potash producer and a major crop-nutrient retailer; Methanex, the world's largest methanol producer and distributor; and LSB Industries, a smaller US nitrogen producer pivoting toward clean ammonia, have all rolled into bear-classified trend readings even after the recent 30-day bounce. LSB's swing is the most extreme: its one-year gain has cooled from as much as 174% to roughly 44% as the stock unwound from a stretched valuation.

The rally's real driver looks less like a demand inflection than a supply shock. Commercial shipping through the Strait of Hormuz has been severely disrupted since late February 2026 amid the Iran-Israel-US conflict, stranding over a million metric tons of fertilizer cargo in the Gulf. That squeeze widened the feedstock-cost gap in North American producers' favor: European benchmark gas hit $16.3/MMBtu in mid-July while Henry Hub fell to $2.9/MMBtu over the same week, according to a weekly gas-price tracker — a cost advantage that does nothing on its own to fix the ag-demand picture.

CF's ammonia segment reported $627M of Q1 2026 net sales at a 36.2% gross margin, expansion the company attributed to a 25% jump in average selling prices rather than volume. Methanex posted a record $577M in Q2 Adjusted EBITDA as its realized methanol price more than doubled sequentially from $351/tonne in Q1 to $529/tonne, a windfall it ties to Middle East supply disruption that idled its own Trinidad Titan plant, even as its Geismar site produced over a million tonnes — some real volume growth alongside the price spike. But management is already signaling the reversal, having guided Q3 realized prices down to roughly $460-485/tonne with lower Adjusted EBITDA expected. Nutrien posted 19% revenue growth and record potash volumes in Q1 but missed on EPS and the stock slid 7%, then fell further in July on competition fears tied to a new $500M USDA FIELDS program meant to expand domestic fertilizer capacity.

Valuation reads name-by-name rather than as one category verdict. CF's trailing multiple compressed from roughly 13-14x in May to about 9.5x by late June even as the stock rose — earnings caught up faster than price, a supported advance. Nutrien looks closer to a possible dislocation: EBITDA grew and the multiple fell to about 12.4x from 15.6x, yet the stock dropped into bear territory on a policy scare rather than any business deterioration. LSB unwound from an extended near-44x multiple in May to about 17x by late June as its price decline caught up with reality — a justified de-rating. Methanex's picture is incomplete, with its trailing P/E not meaningful amid the cyclical trough and the Q3 guide-down still working through the numbers.

Underneath all of it, the agricultural demand base has not inflected. US farmers are expected to plant roughly 95 million acres of corn in 2026, down 3-5% from 2025 — corn absorbs roughly half of US synthetic nitrogen demand — while a broad urea benchmark, though up 16% on the month, still sits 8.7% below year-ago levels. China has meanwhile begun issuing fresh urea export quotas for June-August 2026, loosening a restriction that had helped keep global supply tight. Longer-dated capacity such as CF's Blue Point low-carbon ammonia project and LSB's El Dorado carbon-capture plan, both eligible for federal 45Q credits, remain years from contributing cash flow.

The setup

Where it stands — CF alone holds a confirmed uptrend among the four; Nutrien, Methanex and LSB Industries sit in bear-classified trend readings despite the recent bounce. Would confirm — Methanex's realized price holding near or above its $460-485/tonne Q3 guide, and the Henry Hub-TTF spread staying wide. Would invalidate — Resumed full Strait of Hormuz shipping or expanding Chinese urea export volumes that compress ammonia and urea benchmark prices further. Watch next — CF Industries reports Q2 2026 earnings on August 5, 2026, testing whether ammonia margin expansion persists or fades. Valuation — CF near 9.5x trailing earnings versus 13-14x in May; Nutrien near 12.4x versus 15.6x; LSB near 17x versus a stretched 44x; Methanex's multiple not meaningful mid-cycle.

Valuation & fundamentals

TickerMkt capP/EP/E fwdP/SP/S fwdEV/EBITDAFCF yld
CF$19.2B11.2x7.5x2.6x2.3x5.6x8.4%
NTR$33.2B14.0x12.5x1.2x1.2x7.3x6.7%
MEOH$4.3B52.4x6.0x1.0x0.9x6.4x17.2%
LXU$782.7M21.8x10.5x1.2x1.2x8.2x28.2%

Consensus projections

TickerFY2026EFY2027EFY2028E
CFRevenue+22.1%−14.6%−6.7%
EPS+87.5%−34.2%−18.0%
NTRRevenue+7.0%−2.4%−1.5%
EPS+19.7%−6.9%−11.7%
MEOHRevenue+29.8%−16.3%−2.3%
EPS+205.1%−38.8%−27.2%
LXURevenue+11.0%−4.8%−0.3%
EPS+201.3%−31.6%+9.2%

Forward fiscal years only. Blank means no analyst coverage for that year.

Private Capital's Slump Diverges From Its Own Earnings

Alternative & Private Capital managers are down ~24% over a year while Diversified Asset Managers are up ~28%, but for Blackstone, KKR, Ares and Blue Owl the price damage has outrun what's visible in core fee earnings — a possible dislocation — while Carlyle's decline matches genuine earnings deterioration. Neither cohort's trend signal has confirmed the past month's bounce.

APOARESBXKKROWLCGHLNEGCMGBLKAMGAPAMBENFHIIVZJHGAlternative & Private CapitalDiversified Asset ManagersFinancial Services > Asset Management > Alternative & Private CapitalFinancial Services > Asset Management > Diversified Asset ManagersData Center: Financing — PE, Banks, Private Credit
TickerCompanySegmentTrend30D1Y
APOApollo Global ManagementAlternative & Private Capital🔴 Cont. Bear+2.8%−10.5%
ARESAres ManagementAlternative & Private Capital🔴 Cont. Bear+5.1%−30.3%
BXBlackstoneAlternative & Private Capital🔴 Cont. Bear+3.5%−23.5%
KKRKKRAlternative & Private Capital🔴 Cont. Bear+5.7%−29.8%
OWLBlue Owl CapitalAlternative & Private Capital🔴 Cont. Bear+8.5%−44.3%
CGThe CarlyleAlternative & Private Capital⚠️ Emerging Bear+4.5%−22.4%
HLNEHamilton Lane IncorporatedAlternative & Private Capital🔴 Cont. Bear+7.8%−40.3%
GCMGGCM GrosvenorAlternative & Private Capital🌱 Emerging Bull−8.3%+7.5%
BLKBlackRockDiversified Asset Managers⚠️ Emerging Bear+7.8%−0.8%
AMGAffiliated ManagersDiversified Asset Managers🟢 Cont. Bull+2.8%+71.0%
APAMArtisan Partners Asset ManagementDiversified Asset Managers🔴 Cont. Bear+8.5%−7.5%
BENFranklin ResourcesDiversified Asset Managers🟢 Cont. Bull−1.7%+40.5%
FHIFederated HermesDiversified Asset Managers🟢 Cont. Bull+3.5%+20.7%
IVZInvescoDiversified Asset Managers🟢 Cont. Bull+6.4%+44.8%
JHGJanus HendersonDiversified Asset Managers🟢 Cont. Bull+22.6%

12-month price & trend

APO
Apollo Global Management
126
+5.34 (+4.44%)
vs. prior close
Price20d50d150d
APO 12-month price
Alternative & Private Capital
ARES
Ares Management
128
+3.97 (+3.20%)
vs. prior close
Price20d50d150d
ARES 12-month price
Alternative & Private Capital
BX
Blackstone
128
−0.32 (−0.25%)
vs. prior close
Price20d50d150d
BX 12-month price
Alternative & Private Capital
KKR
KKR
101
+0.45 (+0.45%)
vs. prior close
Price20d50d150d
KKR 12-month price
Alternative & Private Capital
OWL
Blue Owl Capital
10.30
+0.14 (+1.38%)
vs. prior close
Price20d50d150d
OWL 12-month price
Alternative & Private Capital
CG
The Carlyle
46.02
+0.66 (+1.46%)
vs. prior close
Price20d50d150d
CG 12-month price
Alternative & Private Capital
HLNE
Hamilton Lane Incorporated
88.91
−0.04 (−0.04%)
vs. prior close
Price20d50d150d
HLNE 12-month price
Alternative & Private Capital
GCMG
GCM Grosvenor
12.48
+0.05 (+0.40%)
vs. prior close
Price20d50d150d
GCMG 12-month price
Alternative & Private Capital
BLK
BlackRock
1,090
−11.97 (−1.09%)
vs. prior close
Price20d50d150d
BLK 12-month price
Diversified Asset Managers
AMG
Affiliated Managers
367
−5.67 (−1.52%)
vs. prior close
Price20d50d150d
AMG 12-month price
Diversified Asset Managers
APAM
Artisan Partners Asset Management
39.24
−0.59 (−1.48%)
vs. prior close
Price20d50d150d
APAM 12-month price
Diversified Asset Managers
BEN
Franklin Resources
33.86
+1.01 (+3.07%)
vs. prior close
Price20d50d150d
BEN 12-month price
Diversified Asset Managers
FHI
Federated Hermes
59.96
+0.49 (+0.82%)
vs. prior close
Price20d50d150d
FHI 12-month price
Diversified Asset Managers
IVZ
Invesco
29.60
+0.33 (+1.13%)
vs. prior close
Price20d50d150d
IVZ 12-month price
Diversified Asset Managers
JHG
Janus Henderson
Price20d50d150d
JHG 12-month price
Diversified Asset Managers

What's happening

Two adjacent slices of the asset-management sector have moved in opposite directions over the past year. Alternative & Private Capital firms — private-equity, credit and infrastructure managers including Apollo Global Management (APO), Ares Management (ARES), Blackstone (BX), KKR, Blue Owl Capital (OWL), Carlyle (CG), Hamilton Lane (HLNE) and GCM Grosvenor (GCMG) — are down roughly 24% on average over the trailing year, with seven of eight names in double-digit declines. Diversified Asset Managers — BlackRock (BLK), the roughly $15 trillion-AUM industry leader; Affiliated Managers Group (AMG); Artisan Partners (APAM); Franklin Resources (BEN), which trades as Franklin Templeton; Federated Hermes (FHI); Invesco (IVZ); and Janus Henderson (JHG) — are up roughly 28% on average, though unevenly: AMG has surged 77% while BLK is roughly flat and APAM is down 12.5%.

The alts decline traces to a specific, dated credit event rather than a broad collapse in earnings power. Non-traded BDC redemption requests topped $20 billion in Q1 2026, with Apollo's ADS, Ares' ASIF and Blue Owl's OCIC/OTIC vehicles all capping withdrawals at 5% after requests ran two to four times that level. Non-accruals followed: the BDC-industry weighted-average non-accrual rate rose to 1.99% in Q1 2026 from 1.42% the prior quarter, FS KKR's net asset value per share fell nearly 10%, and Blue Owl's OBDC cut its dividend 16%. As recently as late July, Ares' $29 billion flagship private credit fund reported a fresh uptick in troubled investments tied to AI-disruption-exposed borrowers, and KKR executives said tight spreads and choosy buyers made the first quarter challenging at Global Atlantic, its $150 billion insurance affiliate.

Where the two verdicts diverge

But the price damage has run ahead of core fee earnings for most of the group. Trailing price/earnings multiples for Ares, Blackstone, KKR and Blue Owl have compressed sharply since May even as prices only partly recovered — Ares from roughly 65x to 50x, KKR from roughly 42x to 31x, Blue Owl from roughly 89x to 71x — a pattern that, on flat-to-falling prices, implies earnings grew rather than shrank. Apollo's first-quarter fee-related earnings were $728 million and it crossed $1 trillion in assets under management, with analyst consensus ahead of its August 4 print still pointing to 13-19% year-over-year earnings growth. That gap — business momentum holding up while the share price fell faster — reads as a possible dislocation for Blackstone and KKR, whose trailing multiples in the high-20s/low-30s sit well below Blue Owl's 71x and Ares' 50x, both still stretched even after the crash. Carlyle is the exception: its multiple rose as its price fell, the signature of genuine earnings deterioration, consistent with the weaker fundraising momentum flagged in prior coverage.

On the diversified side, the gains are not simply beta riding a rising index. AMG's 77% year rests on record inflows — roughly $35 billion in first-half net client cash flows and $942 billion in AUM, with alternative-strategy affiliates driving about $58 billion of that inflow. Franklin Resources' rally reflects a specific product win, with active strategies making up 70% of first-quarter net flows via its active-ETF push. BlackRock's own record — $15.34 trillion in AUM, up 22% year over year, with $192 billion of quarterly inflows — is genuine, but the stock is roughly flat, so growth hasn't yet reached the share price. Invesco's 44% year carries a competitive threat: BlackRock has filed for a Nasdaq-100 ETF that would directly challenge Invesco's QQQ franchise. Artisan Partners looks like the diversified group's own possible dislocation: $295.4 million in quarterly revenue and a 19.6% net margin against a trailing price/earnings ratio near 8.4x and a stock still down 12.5% on the year.

Neither cohort's trend signal has confirmed the past month's move. Trend bands for Ares, Blue Owl, Apollo, Blackstone, Carlyle and KKR remained in bear territory through the end of July even as the group rallied roughly 7% on average over 30 days, outpacing the diversified cohort's roughly 6% bounce — price moving before the underlying trend measure has turned, on both sides of the divide.

The setup

Where it stands — Alts names trade well below where price/earnings compression suggests fee earnings sit; Carlyle alone shows matching earnings deterioration. Would confirm — BDC non-accrual rates and NAV cuts continue rising through Q2/Q3 2026 prints across Apollo, Ares, KKR, Blue Owl. Would invalidate — Trend bands flip from bear to neutral/bull for Blackstone or KKR alongside stabilizing redemption and non-accrual data. Watch next — Apollo reports Q2 2026 results on August 4, with consensus EPS growth of 13-19% year over year. Valuation — Blue Owl (~71x) and Ares (~50x) trailing price/earnings remain stretched; Blackstone (~29x) and KKR (~31x) sit far below their May levels of 31x and 42x.

Valuation & fundamentals

TickerMkt capP/EP/E fwdP/SP/S fwdEV/EBITDAFCF yld
APO$72.4B37.0x14.2x2.4x3.1x6.4x8.3%
ARES$42.1B56.7x21.7x6.7x7.5x22.7x3.8%
BX$154.3B28.4x21.5x9.6x10.5x19.7x1.6%
KKR$91.1B30.2x16.3x4.3x8.6x14.5x7.6%
OWL$16.1B83.9x11.6x5.4x5.7x19.1x8.2%
CG$16.6B30.2x12.6x4.2x4.6x28.1x-5.5%
HLNE$4.7B13.5x14.3x6.2x5.6x10.7x7.5%
GCMG$2.0B12.9x12.2x3.6x3.7x11.3x9.6%
BLK$167.9B26.9x20.4x6.5x6.0x17.7x2.1%
AMG$7.8B10.4x8.5x3.3x3.3x6.7x13.8%
APAM$2.6B8.4x9.5x2.1x2.1x5.2x7.6%
BEN$16.5B20.3x11.6x1.8x2.4x16.0x5.6%
FHI$4.1B9.8x10.5x2.2x2.1x7.0x7.4%
IVZ$12.0Bn/m10.5x1.8x2.3x16.7x13.2%
JHG$8.0B10.0x12.2x2.5x3.3x8.1x7.8%

Consensus projections

TickerFY2026EFY2027EFY2028E
APORevenue+27.5%+15.7%+13.6%
EPS+11.4%+20.6%+17.2%
ARESRevenue+23.0%+19.9%+9.6%
EPS+17.8%+23.8%+17.4%
BXRevenue+15.0%+24.4%+4.9%
EPS+10.7%+25.2%+10.8%
KKRRevenue+33.9%+17.8%+32.9%
EPS+26.0%+18.0%+15.7%
OWLRevenue+5.9%+10.5%+16.1%
EPS+7.9%+11.4%+14.5%
CGRevenue−4.3%+41.3%+7.2%
EPS−8.7%+39.7%+15.1%
HLNERevenue+12.1%+11.2%+17.9%
EPS+20.3%−1.0%+19.9%
GCMGRevenue−0.3%+15.5%
EPS+11.9%+20.5%
BLKRevenue+16.7%+10.9%+13.2%
EPS+12.5%+14.1%+15.0%
AMGRevenue+12.0%+10.6%+11.2%
EPS+35.0%+14.5%+18.4%
APAMRevenue+3.1%+4.5%+5.9%
EPS+2.1%+4.6%+2.9%
BENRevenue+6.0%+6.2%+6.7%
EPS+28.6%+6.8%+7.3%
FHIRevenue+9.5%+5.3%+4.1%
EPS+3.8%+9.9%+13.4%
IVZRevenue+10.7%+6.0%+2.9%
EPS+29.0%+14.5%+12.3%
JHGRevenue−6.5%+4.8%+11.0%
EPS+5.3%+8.9%+5.7%

Forward fiscal years only. Blank means no analyst coverage for that year.

Gas-producer bounce runs into unconfirmed bands and a storage surplus

Expand Energy, Range Resources, EQT, Antero and Devon posted a 30-day bounce, but every one remains locked in a bearish trend band, Henry Hub storage sits 6.4% above its five-year average, and the gain is concentrated in just two names (Devon and Range) — a divergence between price action and both the tape and the commodity fundamentals, not a confirmed cohort turn.

EXERRCEQTARDVNARX.TONatural GasUpstream E&PEnergyILTB Ep 483: Gas Thesis / Upstream ProducersILTB Ep 483: Natural Gas / Upstream — Other Named ProducersNATGAS: E&P / Appalachian Gas Pure-PlaysData Center: Natural Gas, Pipelines & Water UtilitiesILTB Ep 483: Natural Gas / Upstream — Highest-Conviction LongsILTB Ep 483: Winners / Gas Producers
TickerCompanySegmentTrend30D1Y
EXEExpand EnergyAppalachian Shale Gas⚠️ Emerging Bear+5.8%−4.1%
RRCRange ResourcesAppalachian Shale Gas🔴 Cont. Bear+7.6%+15.8%
EQTEQTAppalachian Shale Gas⚠️ Emerging Bear+3.1%+3.6%
ARAntero ResourcesAppalachian Shale Gas🔴 Cont. Bear+4.2%+9.4%
DVNDevon EnergyDiversified Onshore & Conventional⚠️ Emerging Bear+11.8%+43.9%
ARX.TOARX.TO🌱 Emerging Bull+12.3%+25.8%

12-month price & trend

EXE
Expand Energy
94.03
+1.61 (+1.74%)
vs. prior close
Price20d50d150d
EXE 12-month price
Appalachian Shale Gas
RRC
Range Resources
40.14
+0.59 (+1.49%)
vs. prior close
Price20d50d150d
RRC 12-month price
Appalachian Shale Gas
EQT
EQT
53.29
+0.58 (+1.10%)
vs. prior close
Price20d50d150d
EQT 12-month price
Appalachian Shale Gas
AR
Antero Resources
36.14
+0.84 (+2.38%)
vs. prior close
Price20d50d150d
AR 12-month price
Appalachian Shale Gas
DVN
Devon Energy
45.13
+0.96 (+2.17%)
vs. prior close
Price20d50d150d
DVN 12-month price
Diversified Onshore & Conventional
ARX.TO
ARX.TO
33.53
+0.55 (+1.67%)
vs. prior close
Price20d50d150d
ARX.TO 12-month price

The bounce isn't the cohort's story — the disagreement is

Five US natural-gas producers tied to a watchlist thesis built around LNG-export and datacenter power demand have all gained over the past month, yet all five remain in trend bands their own price action hasn't broken. Expand Energy, the Haynesville-focused gas driller formed from the Chesapeake–Southwestern merger, has sat in a downtrend continuously since April 14 — 109 straight days. Range Resources, an Appalachian gas-and-NGL producer, and EQT, the largest US natural-gas producer with an integrated Appalachian gathering-and-pipeline business, both flipped from an uptrend to a downtrend between late May and mid-June and stayed there through the rally. Devon Energy, a multi-basin operator with heavy Permian associated-gas exposure, turned bearish on its trend band in the same window it posted the cohort's largest one-month gain (+12.1%). No member crossed out of a downtrend into neutral or higher this period.

The gain itself is lopsided: Devon (+12.1%) and Range (+8.6%) carried the month, while EQT (+1.5%) and Antero Resources, an Appalachian gas producer with a meaningful natural-gas-liquids mix (+3.5%), barely moved. All five are still down over the trailing 90 days (roughly -6% to -11%), meaning the bounce sits inside a deeper drawdown rather than reversing it. ARC Resources, the Canadian gas-and-condensate producer in the sister bucket, is the one name actually trading in an uptrend — but that reflects Shell's pending C$22B/US$13.6B all-stock-and-cash acquisition, approved by 99.5% of shareholders on July 14 and expected to close in the second half of 2026, not a gas-fundamentals signal.

On valuation, the cohort is dispersed. Expand Energy trades at roughly 6.7x trailing earnings, the cheapest of the group, alongside a Q2 beat, $343M of free cash flow and $1.3B of year-to-date debt paydown that cut net debt to about 0.5x EBITDAX, per its Q2 2026 earnings call. EQT is the priciest at roughly 12.3x trailing earnings while carrying the sharpest trend downgrade — and it just raised full-year 2026 production guidance by ~90 Bcfe, adding volume into a rally rather than showing the restraint its bull case needs. Antero's most recent read (~19x earnings) is rich for the peer set even after record Q2 production and a 57% EBITDA gain — a result driven by volume and liquids, not by gas price, since Henry Hub was down 16% year over year. Range guided full-year capex of $650-700M against 2.35-2.40 Bcfe/d of production.

The commodity backdrop hasn't confirmed any of it. Working gas storage stood 185 Bcf above the five-year average as of late July, and Henry Hub futures fell below $2.70/MMBtu, a three-month low, even as summer power burn set a record ~40.3 Bcf/d. Permian associated gas is the offset: Waha basis averaged -$2.19/MMBtu in H1, with relief not expected until new pipeline capacity lands later in 2026. Devon's own guidance flags 10-15% residual Waha exposure even after that capacity arrives — and its Q2 results, due August 4, hadn't printed as this month's move occurred.

So the cohort shows genuine execution improvement — Expand's debt paydown, Antero's production beat, Range's steady realizations — running against a commodity tape that hasn't turned and trend bands that haven't confirmed. That's the split worth watching, not the headline monthly number.

The setup

Where it stands — Cohort up 5-8% over 30 days, but every US member remains in a downtrend band and 90-day returns are still negative. Would confirm — Two or more members crossing from a downtrend into neutral or higher within a staggered multi-week window. Would invalidate — Storage surplus versus the five-year average widens further or Henry Hub sets a fresh multi-month low into autumn. Watch next — Devon Energy's Q2 2026 earnings, scheduled August 4, the first fundamental print since this month's rally began. Valuation — Expand ~6.7x, Range ~10.5x, EQT ~12.3x, Antero ~19x trailing earnings; no forward multiples available in this pack.

Valuation & fundamentals

TickerMkt capP/EP/E fwdP/SP/S fwdEV/EBITDAFCF yld
EXE$22.1B7.9x10.7x1.7x1.6x3.8x11.5%
RRC$9.3B11.0x9.7x2.8x2.6x7.2x12.6%
EQT$32.9B11.6x12.5x3.5x3.5x6.2x11.5%
AR$11.8B12.3x8.7x2.2x1.7x7.6x15.0%
DVN$30.8B13.6x9.2x1.8x1.3x4.9x8.7%
ARX.TO

Consensus projections

TickerFY2026EFY2027EFY2028E
EXERevenue+22.6%−3.0%+5.5%
EPS+44.6%−6.6%+14.5%
RRCRevenue+17.6%+2.9%+6.9%
EPS+41.5%−3.3%+16.3%
EQTRevenue+12.6%−0.3%+9.3%
EPS+43.2%−4.7%+31.4%
ARRevenue+32.3%+1.4%+5.0%
EPS+143.6%+7.3%+11.8%
DVNRevenue+42.1%+10.1%+4.9%
EPS+35.0%−1.0%+8.2%

Forward fiscal years only. Blank means no analyst coverage for that year.

Space Builders' 'Emerging Bull' Signal Is a Mirage, Bands Say

The starred small-cap space-hardware cohort (YSS, RDW, LUNR) is not flashing an emerging-bull turn — trend bands rolled from a spring rally into bearish territory in mid-July, clustered within a two-week window, and the roughly 31% average monthly decline traces to dilutive stock offerings, analyst downgrades and a sector-wide reversal after SpaceX's IPO rather than a bottoming inflection. Fundamentals diverge sharply underneath: York Space Systems looks like operational execution outrunning a falling price, while Redwire and Intuitive Machines show real dilution and guidance risk behind theirs.

YSSRDWLUNRMNTSSPACE: Satellite Manufacturers & Spacecraft BuildersSPACE: Micro-Cap & Speculative Space
TickerCompanySegmentTrend30D1Y
YSSYork Space SystemsCommunication Equipment🔴 Cont. Bear−37.5%−56.2%
RDWRedwireSpace Systems & Launch🌱 Emerging Bull−24.1%−41.6%
LUNRIntuitive MachinesSpace Systems & Launch🟢 Cont. Bull−34.7%+10.2%
MNTSMomentusAerospace & Defense🌱 Emerging Bull−38.4%−80.6%

12-month price & trend

YSS
York Space Systems
14.73
−0.53 (−3.47%)
vs. prior close
Price20d50d150d
YSS 12-month price
Communication Equipment
RDW
Redwire
8.62
+0.15 (+1.77%)
vs. prior close
Price20d50d150d
RDW 12-month price
Space Systems & Launch
LUNR
Intuitive Machines
12.34
+0.09 (+0.73%)
vs. prior close
Price20d50d150d
LUNR 12-month price
Space Systems & Launch
MNTS
Momentus
4.05
−0.47 (−10.40%)
vs. prior close
Price20d50d150d
MNTS 12-month price
Aerospace & Defense

The premise doesn't hold

A hypothesis built on this cohort catching an early bottom runs into the data: as of July 31, York Space Systems, Redwire and Intuitive Machines were not carrying an emerging-bull signal. Trend-band history shows all three — plus Momentus, the roughly $32M in-space-transportation company down 80.3% over twelve months — ran a sustained uptrend from April through late June, then rolled into bearish bands in a tightly clustered breakdown between July 6 and July 17. That is a synchronized reversal, not a synchronized turn.

What actually drove the drop

York Space Systems, which builds standardized satellite buses for the Pentagon's proliferated missile-warning constellation, fell after Raymond James downgraded the stock to Market Perform in mid-July, citing estimate risk into 2027-28 — even as the company confirmed successful contact with all 21 satellites in its second production lot on July 16. Redwire, which makes space avionics, solar arrays and, since acquiring Edge Autonomy, defense drones, fell roughly 43% in eight trading days after filing to sell up to $500M in stock, and separately posted a widened FY2025 net loss of $226.6M. Intuitive Machines, the NASA-contracted lunar-lander builder now expanding into satellite buses via its Lanteris acquisition, announced its second major capital raise in six months and saw short interest climb to roughly 29% of float, with Deutsche Bank cutting its price target to $20 from $34. Layered on top, the whole small-cap 'new space' group sold off after SpaceX's June 12 IPO, with Rocket Lab, AST SpaceMobile and SpaceX itself each down over 30% in July — this cohort's decline is largely riding that same wave, not diverging from it.

The fundamentals split three ways

York's FY2025 revenue grew 52% year over year to $386M with gross margin widening from 12.7% to 19.5%, and it holds a funded $617M Space Development Agency award for 62 satellites — distinct from the marquee July 13 Golden Dome contract, which went to L3Harris and Sierra Space, not this cohort. Its stock is still down roughly 55% from early May despite that execution — a case where the tape has moved further than the visible business. Redwire's backlog stood at $411M in early May against a 2026 guide of $450-500M, but its Q1 2026 loss of $76.5M and the new $500M offering point to a de-rating with real fundamental teeth, not just sentiment. Intuitive Machines' 2026 guide of $900M-$1B leans heavily on the Lanteris deal even as FY2025 organic revenue fell 8%; its $4.82B NASA Near Space Network award is a task-order ceiling, not guaranteed revenue. NASA's FY2027 budget request cuts science funding 23% while raising Artemis funding roughly 10% — a mixed signal that favors lunar-exploration work over science payloads.

The setup

Where it stands — All three names sit in bearish trend bands after a synchronized mid-July breakdown from a spring rally, not an emerging bottom. Would confirm — Two or more names posting a sustained band improvement alongside a funded (not IDIQ-ceiling) contract award within 90 days. Would invalidate — Further ATM/convertible issuance at RDW or LUNR without a matching backlog or book-to-bill improvement. Watch next — Redwire and Intuitive Machines Q3 2026 earnings, expected around November, for backlog and dilution updates. Valuation — Price-to-sales in May stood at RDW 5.36x, LUNR 18.72x, YSS 10.55x; all three trade far below those levels now given subsequent price declines.

Valuation & fundamentals

TickerMkt capP/EP/E fwdP/SP/S fwdEV/EBITDAFCF yld
YSS$3.7Bn/m20.3x6.5xn/m0.7%
RDW$2.1Bn/m5.7x4.5xn/m-7.4%
LUNR$5.4Bn/m16.2x5.7xn/m-2.5%
MNTS$31.9Mn/m8.0x0.2xn/m-78.9%

Consensus projections

TickerFY2026EFY2027EFY2028E
YSSRevenue+47.9%+54.7%+27.3%
EPS−91.2%−1022.3%+77.8%
RDWRevenue+42.8%+20.3%+17.6%
EPS−56.0%−34.2%−50.9%
LUNRRevenue+329.6%+21.3%+23.6%
EPS−29.4%−117.9%+736.8%
MNTSRevenue+1970.0%
EPS+139.6%

Forward fiscal years only. Blank means no analyst coverage for that year.

Nuclear/SMR Complex Rolls Over Together — But Fuel-Cycle Names Aren't All Equal

BWXT, CCJ, SMR, OKLO, LEU and UUUU flipped from bull to strongly bearish bands within a tight four-week window in June-July 2026, confirming a real thesis-level de-rating in the AI-nuclear trade rather than isolated stock news — but FRVO (geothermal, not nuclear) and FRMI's steep declines trace to unrelated, idiosyncratic catalysts, and BWXT's order book is actually growing even as its stock craters.

FRVOFRMIOKLOCCJBWXTSMRLEUNNNNUUUUUtilities > Regulated Electric > Emerging & Specialized EnergyAI2: Power Generation & Grid / Switchgear & TransformersGeothermal: US-Listed Pure-PlaysNuclearNUCLEAR: Reactors / OEMs & SMR DevelopersData Center: SMR / Advanced Nuclear & UraniumAI2: Nuclear Fuel Cycle & SMRNUCLEAR: Uranium / Miners & ExplorersILTB Ep 483: Nuclear / Large-Scale Reactor BuildoutILTB Ep 483: Nuclear / AP1000 & Fuel CycleSPACE: Propulsion & Launch StructuresNUCLEAR: Fuel / Fabrication & Advanced FuelsNUCLEAR: Uranium / Conversion & EnrichmentAI2: Critical Minerals / Metallization & Compound Semi Inputs
TickerCompanySegmentTrend30D1Y
FRVOFervo EnergyEmerging & Specialized Energy🔴 Cont. Bear−19.2%−38.3%
FRMIFermiEmerging & Specialized Energy🔴 Cont. Bear−30.7%−82.5%
OKLOOkloEmerging & Specialized Energy⚠️ Emerging Bear−25.1%−49.2%
CCJCamecoUranium⚠️ Emerging Bear−11.4%+15.0%
BWXTBWX TechnologiesNaval & Shipbuilding⚠️ Emerging Bear−14.3%+9.6%
SMRNuScale PowerAdvanced Nuclear🔴 Cont. Bear−12.4%−80.6%
LEUCentrus EnergyUranium⚠️ Emerging Bear+1.5%−15.8%
NNNNAnbio Biotechnology Class A Ordinary SharesDiagnostics & Blood Management🔴 Cont. Bear−17.8%−76.8%
UUUUEnergy FuelsUranium⚠️ Emerging Bear−16.9%+17.7%

12-month price & trend

FRVO
Fervo Energy
22.54
+0.24 (+1.08%)
vs. prior close
Price20d50d150d
FRVO 12-month price
Emerging & Specialized Energy
FRMI
Fermi
5.69
−1.04 (−15.45%)
vs. prior close
Price20d50d150d
FRMI 12-month price
Emerging & Specialized Energy
OKLO
Oklo
38.83
−2.26 (−5.50%)
vs. prior close
Price20d50d150d
OKLO 12-month price
Emerging & Specialized Energy
CCJ
Cameco
86.38
−1.85 (−2.10%)
vs. prior close
Price20d50d150d
CCJ 12-month price
Uranium
BWXT
BWX Technologies
169
+3.11 (+1.88%)
vs. prior close
Price20d50d150d
BWXT 12-month price
Naval & Shipbuilding
SMR
NuScale Power
8.42
−0.18 (−2.09%)
vs. prior close
Price20d50d150d
SMR 12-month price
Advanced Nuclear
LEU
Centrus Energy
177
+0.18 (+0.10%)
vs. prior close
Price20d50d150d
LEU 12-month price
Uranium
NNNN
Anbio Biotechnology Class A Ordinary Shares
9.90
−0.85 (−7.91%)
vs. prior close
Price20d50d150d
NNNN 12-month price
Diagnostics & Blood Management
UUUU
Energy Fuels
11.44
−0.27 (−2.31%)
vs. prior close
Price20d50d150d
UUUU 12-month price
Uranium

A synchronized rollover, not scattered noise

Band-transition data shows six adjacent nuclear-complex names — LEU, SMR, OKLO, CCJ, BWXT and UUUU — rolled from bullish trend bands into strongly bearish within roughly a four-week window between late May and early July 2026 (LEU from 5/29, SMR from 6/10, CCJ confirmed 7/7, BWXT confirmed 7/8, UUUU from 6/25). That clustering is the strongest piece of evidence here: it looks like a thesis-level repricing, not six unrelated stock stories. The catalyst dates to the mid-to-late July "AI hype rotation," when Oklo, X-Energy, NuScale, Nano Nuclear and Uranium Energy Corp each fell 8-9% in a single session as investors began demanding proof of licensing, financing and construction rather than rewarding announcement-stage hype.

The pre-revenue tail has real fundamentals behind the sell-off

The pullback isn't purely sentiment. Oklo remains pre-revenue, was down 27.9% over the trailing month even after a $200M federal reactor-acceleration award, has built its $2.5B cash pile via a $1.18B dilutive ATM raise and just filed a fresh $1B equity shelf, and its Aurora reactor still lacks NRC design certification even as ancillary isotope-licensing milestones clear. Uranium spot has also cooled, pulling back to ~$71.45/lb from a seven-month high of $79/lb in mid-June, while the term price held near $80/lb — a real but moderate correction, not a collapse in physical contracting.

The fuel-cycle leg is not one story

This is where the "dragged down by speculative peers" framing breaks. BWXT's backlog reached ~$8.65B, up 77% year-over-year, supporting the case that its equity de-rating is multiple compression, not fundamentals. Cameco, by contrast, missed Q2 EPS by roughly 50% on weaker Westinghouse equity income and trimmed 2026 delivery guidance — a direct hit to its large-reactor bull case. Centrus, meanwhile, heads into its August 5 print with consensus estimates cut sharply.

Two names don't belong in this story

FRVO is a geothermal developer, not nuclear, and its single-session flip to strongly bearish on July 29 — weeks after the main cluster — traces to widening losses and a flagged cash-runway concern, not sector contagion. FRMI's sharpest leg down followed its own $375M convertible note pricing and a director resignation, before a Mizuho price-target cut and a turbine-delivery bounce tied to its hybrid gas-nuclear Project Matador campus — a story with little to do with uranium fundamentals.

Valuation & fundamentals

TickerMkt capP/EP/E fwdP/SP/S fwdEV/EBITDAFCF yld
FRVO$8.4B
FRMI$4.2Bn/m91.3xn/m49.1xn/m-13.3%
OKLO$6.8Bn/mn/mn/m-2.3%
CCJ$37.6B148.0x52.9x15.2x10.7x61.0x1.0%
BWXT$15.5B44.7x35.8x4.6x4.1x29.8x2.1%
SMR$2.5Bn/m134.6x58.0xn/m-30.0%
LEU$3.4B53.8x67.3x7.4x7.2x30.1x-1.8%
NNNN$1.2B164.5x121.3x181.4x0.1%
UUUU$4.6Bn/m54.2x31.1xn/m-2.1%

Consensus projections

TickerFY2026EFY2027EFY2028E
FRMIRevenue+429.7%+1509.1%+182.2%
EPS−177.1%+1513.1%+194.1%
OKLORevenue+359.5%+731.8%
EPS+20.1%+13.8%+10.2%
CCJRevenue+2.8%+10.7%+9.4%
EPS+13.8%+62.5%+20.5%
BWXTRevenue+19.7%+9.4%+7.5%
EPS+23.2%+11.1%+11.2%
SMRRevenue+3.5%+263.3%+80.2%
EPS−73.9%+26.1%−20.2%
LEURevenue+3.5%+4.3%−12.9%
EPS−41.4%+1.3%−24.1%
UUUURevenue+153.3%+60.0%+52.0%
EPS−54.1%−162.7%+363.4%

Forward fiscal years only. Blank means no analyst coverage for that year.