

Kinder Morgan Now Trades Like a Data-Center Stock, Not a Pipeline Toll Collector
Hypothesis Opus 5 · Research Opus 5 · Writing Opus 5 · Prompt v1.5
Kinder Morgan raised its full-year profit guidance in July, cleared federal permits for a 3.4 billion cubic feet a day expansion in early August, and its shares have fallen 7.5% in three months. The reason is not the bond market and not the gas price. It is the customer: on 21 August the gas pipeline companies that sell their backlog as a data-center story fell with the utilities that serve data centers, while the midstream partnerships hauling the same gas — Energy Transfer, Enterprise Products, Targa — barely moved.
Three days earlier Pennsylvania's governor stripped large data centers of fast-track permitting and a tax break. At Kinder Morgan and Williams the numbers contradict the selling — Williams lifted operating margin to 38.7% from 32.0%. At DT Midstream they do not: revenue growth halved to 11% and it still trades at 14.8x enterprise value to EBITDA.
| Ticker | Company | Segment | Trend · 13mo | 30D | 1Y |
|---|---|---|---|---|---|
| The subject · what this brief is about | |||||
KMI | Kinder Morgan | Natural Gas Pipelines & Transmission | 🟢 Cont. Bull | −5.5% | +18.5% |
WMB | The Williams Companies | Natural Gas Pipelines & Transmission | 🟢 Cont. Bull | −6.3% | +26.5% |
DTM | DT Midstream | Natural Gas Pipelines & Transmission | 🟢 Cont. Bull | −8.2% | +27.3% |
| Compared against · context, not the story | |||||
ET | Energy Transfer | Natural Gas Pipelines & Transmission | 🟢 Cont. Bull | +5.3% | +26.2% |
TRP | TC Energy | Natural Gas Pipelines & Transmission | 🟢 Cont. Bull | −10.4% | +23.7% |
AROC | Archrock | Compression & Gas Processing | 🟢 Cont. Bull | −9.9% | +28.1% |
TRGP | Targa Resources | Natural Gas Gathering & Processing | 🟢 Cont. Bull | +15.8% | +87.7% |
OKE | ONEOK | Natural Gas Gathering & Processing | 🌱 Emerging Bull | +6.1% | +29.6% |
MPLX | MPLX | Natural Gas Gathering & Processing | 🟢 Cont. Bull | −1.4% | +19.8% |
EPD | Enterprise Products Partners | Crude Oil & NGL Pipelines | 🟢 Cont. Bull | −0.7% | +24.4% |
LNG | Cheniere Energy | LNG Export & Infrastructure | 🌱 Emerging Bull | +3.4% | +19.0% |
AEP | American Electric Power | Vertically Integrated Utilities | 🟢 Cont. Bull | −9.1% | +7.8% |
DUK | Duke Energy | Vertically Integrated Utilities | 🟢 Cont. Bull | −7.3% | −1.9% |
SRE | Sempra | US Electric & Gas Utilities | ⚠️ Emerging Bear | −8.5% | +2.2% |
NEE | NextEra Energy | Vertically Integrated Utilities | ⚠️ Emerging Bear | −6.3% | +12.0% |
D | Dominion Energy | Vertically Integrated Utilities | 🟢 Cont. Bull | −4.9% | +12.1% |
PWR | Quanta Services | Electrical & Power Infrastructure | 🟢 Cont. Bull | +11.0% | +72.0% |
VST | Vistra | Integrated Retail & Generation | 🔴 Cont. Bear | −8.4% | −28.2% |
GEV | GE Vernova | GE Vernova Integrated | 🟢 Cont. Bull | −7.0% | +58.2% |
ETN | Eaton | Power & Propulsion Systems | 🟢 Cont. Bull | +8.5% | +21.3% |
SPY | State Street SPDR S&P 500 ETF Trust | Asset Management | 🟢 Cont. Bull | +3.2% | +19.5% |
NG=F | Natural Gas Sep 26 | — | 🔴 Cont. Bear | −3.5% | +4.3% |
ORCL | Oracle | Cloud Infrastructure & Platforms | 🔴 Cont. Bear | +21.2% | −38.0% |
AVGO | Broadcom | Semiconductor Subsystems | 🟢 Cont. Bull | −3.3% | +26.0% |
12-month price & trend
| Ticker | Mkt cap | P/E | P/E fwd | P/S | P/S fwd | P/GP | P/GP fwd | EV/EBITDA | FCF yld |
|---|---|---|---|---|---|---|---|---|---|
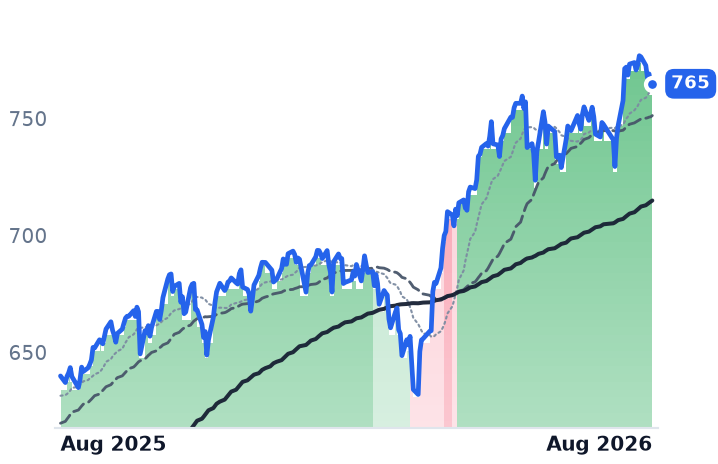
KMI | $69.0B | 19.9x | 20.4x | 3.8x | 3.8x | 7.0x | 6.9x | 12.5x | 5.6% |
WMB | $86.2B | 28.0x | 28.7x | 7.1x | 7.0x | 9.6x | 9.5x | 15.7x | -0.2% |
DTM | $12.9B | 27.6x | 26.8x | 9.9x | 9.6x | 15.6x | 15.2x | 14.8x | 3.7% |
| Ticker | Mkt cap | P/E | P/E fwd | P/S | P/S fwd | P/GP | P/GP fwd | EV/EBITDA | FCF yld |
|---|---|---|---|---|---|---|---|---|---|
ET | $72.1B | 13.0x | 13.4x | 0.7x | 0.7x | 2.9x | 2.7x | 9.7x | 7.2% |
TRP | $66.2B | 26.6x | 16.9x | 5.8x | 4.1x | 11.2x | 8.0x | 13.8x | 4.4% |
AROC | $5.6B | 17.1x | 18.5x | 3.7x | 3.7x | 6.4x | 6.3x | 9.8x | 5.2% |
| Ticker | Mkt cap | P/E | P/E fwd | P/S | P/S fwd | P/GP | P/GP fwd | EV/EBITDA | FCF yld |
|---|---|---|---|---|---|---|---|---|---|
TRGP | $64.2B | 28.4x | 26.6x | 3.8x | 3.4x | 10.5x | 9.2x | 17.5x | 1.2% |
OKE | $58.8B | 16.1x | 16.2x | 1.5x | 1.4x | 6.8x | 6.3x | 11.6x | 4.9% |
MPLX | $59.7B | 12.6x | 13.6x | 4.6x | 4.7x | 8.9x | 8.9x | 11.5x | 7.4% |
| Ticker | Mkt cap | P/E | P/E fwd | P/S | P/S fwd | P/GP | P/GP fwd | EV/EBITDA | FCF yld |
|---|---|---|---|---|---|---|---|---|---|
EPD | $81.7B | 13.1x | 13.0x | 1.4x | 1.4x | 10.5x | 10.6x | 7.9x | 1.8% |
LNG | $56.9B | 20.1x | — | 2.6x | 2.6x | 4.8x | 4.8x | 10.0x | 12.4% |
AEP | $65.8B | 20.8x | 19.0x | 2.9x | 2.8x | 6.0x | 5.7x | 13.8x | 13.6% |
| Ticker | Mkt cap | P/E | P/E fwd | P/S | P/S fwd | P/GP | P/GP fwd | EV/EBITDA | FCF yld |
|---|---|---|---|---|---|---|---|---|---|
DUK | $96.6B | 18.6x | 18.5x | 2.9x | 2.9x | 4.2x | 4.2x | 11.6x | 1.6% |
SRE | $54.2B | 23.9x | 16.2x | 4.0x | 4.0x | 9.6x | 9.5x | 13.9x | -10.9% |
NEE | $174.5B | 18.7x | 20.8x | 6.0x | 5.6x | 8.4x | 7.8x | 15.9x | -5.8% |
| Ticker | Mkt cap | P/E | P/E fwd | P/S | P/S fwd | P/GP | P/GP fwd | EV/EBITDA | FCF yld |
|---|---|---|---|---|---|---|---|---|---|
D | $58.6B | 23.0x | 18.6x | 3.2x | 3.2x | 6.5x | 6.5x | 15.2x | -11.7% |
PWR | $96.1B | 72.3x | 38.2x | 2.9x | 2.4x | 20.3x | 16.9x | 33.7x | 2.5% |
VST | $45.9B | 22.7x | 15.4x | 2.9x | 2.0x | 22.2x | 15.5x | 10.1x | 3.0% |
| Ticker | Mkt cap | P/E | P/E fwd | P/S | P/S fwd | P/GP | P/GP fwd | EV/EBITDA | FCF yld |
|---|---|---|---|---|---|---|---|---|---|
GEV | $254.8B | 27.1x | 31.1x | 6.2x | 5.5x | 30.5x | 27.3x | 28.4x | 4.9% |
ETN | $162.8B | 42.5x | 31.0x | 5.4x | 5.0x | 15.1x | 13.8x | 28.4x | 2.8% |
SPY | $773.0B | — | — | — | — | — | — | — | — |
| Ticker | Mkt cap | P/E | P/E fwd | P/S | P/S fwd | P/GP | P/GP fwd | EV/EBITDA | FCF yld |
|---|---|---|---|---|---|---|---|---|---|
NG=F | — | — | — | — | — | — | — | — | — |
ORCL | $433.0B | 25.3x | 18.7x | 6.4x | 4.8x | 9.8x | 7.3x | 17.4x | -5.5% |
AVGO | $1.8T | 59.5x | 31.8x | 23.2x | 16.6x | 34.7x | 24.8x | 42.8x | 1.9% |
Consensus projections
| Ticker | FY2026E | FY2027E | FY2028E | |
|---|---|---|---|---|
KMI | Revenue | +8.7% | +2.0% | +5.9% |
| EPS | +18.5% | +0.7% | +8.5% | |
WMB | Revenue | +7.8% | +13.8% | +14.7% |
| EPS | +15.6% | +5.5% | +17.7% | |
DTM | Revenue | +7.9% | +4.6% | +9.9% |
| EPS | +7.9% | +6.0% | +11.6% | |
ET | Revenue | +35.3% | +1.9% | +4.9% |
| EPS | +16.7% | +3.6% | +7.4% | |
TRP | Revenue | +6.7% | +4.4% | +5.3% |
| EPS | +7.3% | +5.4% | +6.2% | |
AROC | Revenue | +1.8% | +7.7% | +7.6% |
| EPS | +9.4% | +19.2% | +15.9% | |
TRGP | Revenue | +11.9% | +20.7% | +11.6% |
| EPS | +31.9% | +9.5% | +21.0% | |
OKE | Revenue | +27.2% | −5.3% | +1.1% |
| EPS | +6.8% | +8.2% | +11.3% | |
MPLX | Revenue | −1.0% | +6.7% | +5.0% |
| EPS | −6.7% | +11.9% | +6.5% | |
EPD | Revenue | +12.8% | +5.4% | +5.7% |
| EPS | +11.6% | +9.6% | +8.3% | |
LNG | Revenue | +11.9% | +6.0% | +3.4% |
| EPS | −141.4% | −345.2% | −8.0% | |
AEP | Revenue | +9.5% | +5.9% | +7.6% |
| EPS | +7.9% | +7.6% | +10.7% | |
DUK | Revenue | +5.8% | +4.6% | +4.2% |
| EPS | +6.3% | +6.9% | +7.0% | |
SRE | Revenue | −3.7% | −1.8% | +1.7% |
| EPS | +11.6% | +8.1% | +8.4% | |
NEE | Revenue | +10.4% | +9.9% | +8.6% |
| EPS | +9.0% | +9.2% | +8.3% | |
D | Revenue | +13.3% | +6.3% | +5.7% |
| EPS | +5.0% | +6.3% | +7.0% | |
PWR | Revenue | +40.6% | +16.7% | +12.5% |
| EPS | +57.5% | +17.8% | +16.7% | |
VST | Revenue | +18.9% | +9.1% | +4.6% |
| EPS | +85.4% | +19.1% | +17.0% | |
GEV | Revenue | +23.9% | +14.7% | +15.2% |
| EPS | +323.0% | −19.0% | +39.9% | |
ETN | Revenue | +19.6% | +10.6% | +9.4% |
| EPS | +12.2% | +18.2% | +16.4% | |
ORCL | Revenue | +17.8% | +33.2% | +45.5% |
| EPS | +25.3% | +7.6% | +35.6% | |
AVGO | Revenue | +66.8% | +66.1% | +34.5% |
| EPS | +71.8% | +68.7% | +34.8% |
Forward fiscal years only. Blank means no analyst coverage for that year.
The customer became the risk
On 18 August Pennsylvania Governor Josh Shapiro signed Executive Order 2026-05, pulling every data-center proposal out of the state's Permit Fast Track Program and making any project drawing more than 25 megawatts ineligible for the state's data-center sales-tax exemption unless its developer makes legally binding commitments on energy affordability and obtains local approval. Shapiro had previously stood alongside Amazon to announce a $20bn state investment; he now calls some developers predatory.
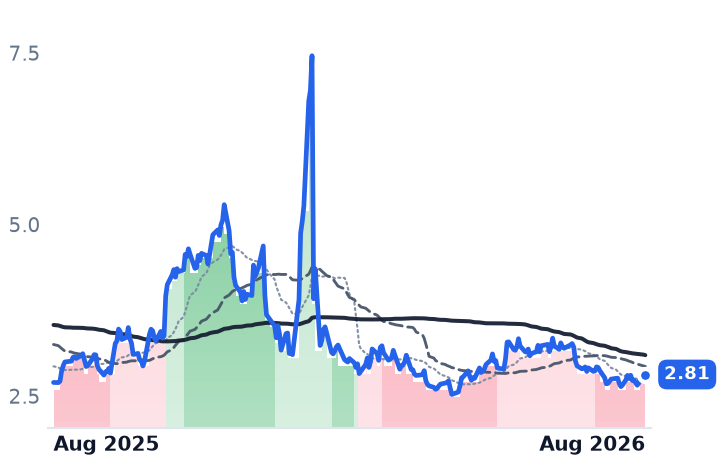
Three days later, the natural-gas pipeline owners whose equity story is that their construction backlog is contracted to that load fell together. Kinder Morgan, a Houston operator of roughly 83,000 miles of pipe that carries about 40% of American gas, closed down 2.9%. Williams, owner of Transco, the largest US interstate gas line by volume, fell 3.9%. DT Midstream, a pure-play gas carrier moving Appalachian and Haynesville supply, fell 4.1%. The S&P 500 rose that day, and front-month gas rose 1.1% to $2.81 per million British thermal units.
What matters is the company they fell in. The regulated utilities most exposed to data-center growth dropped hard — Sempra 5.4%, American Electric Power 4.1%, Duke Energy 2.3%. The midstream partnerships and processors that move the identical molecules did not move at all: Energy Transfer rose 0.4%, Enterprise Products 0.2%, Targa 0.6% and Cheniere 1.0%. Over 30 days the split widens — Kinder Morgan down 4.7% and DT Midstream down 11.6%, against Energy Transfer up 4.4% and Targa up 6.5%.
The obvious alternative explanation does not fit. The 30-year Treasury yield topped 5.33% on 18 August, a 19-year high, then eased to 5.23% — long yields were falling into the drawdown, not rising. A bond-proxy de-rating would also have taken the partnerships with it. What was repriced was the political durability of the demand, in a week CNBC described as the worst of the year for artificial-intelligence data-center names. National opposition to local data centers has risen from 42% to 63% of voters since December.
Two of the three businesses got better
Kinder Morgan's second quarter is the cleanest contradiction. Revenue rose 10.8% to $4.48bn, operating income rose 17.8% and net income rose 21.3% to $867m, lifting operating margin to 30.1% from 28.3%. Management told investors on 22 July that full-year adjusted EBITDA would land at least 5% above budget, about $430m of incremental earnings, and raised the dividend. The sanctioned backlog stands at $9.6bn, of which more than 60% supports power generation and local gas distribution. In early August federal regulators granted certificates for Mississippi Crossing and the $3.5bn South System Expansion 4 — a combined 3.4 billion cubic feet a day. Leverage fell to 3.6 times EBITDA. The permitting risk cleared and the shares fell anyway.
Williams is the more expensive counter-case and it also improved. Revenue rose 10.2% but operating income rose 33.3% and net income 51.5%, taking operating margin to 38.7% from 32.0%. It raised full-year EBITDA guidance to $8.3–8.5bn and its 2025–30 growth target to more than 11% a year. Its behind-the-meter answer to the electricity interconnection queue is built, not promised: Socrates Phase 1, a 200-megawatt plant, entered service on time in 18 months, and Blackstone, Apollo and KKR vehicles committed $5.34bn for 49% of five such projects at a capped 6.35% cost of equity. Its $5.5bn purchase of Momentum Midstream pushes it directly into DT Midstream's Haynesville corridor.
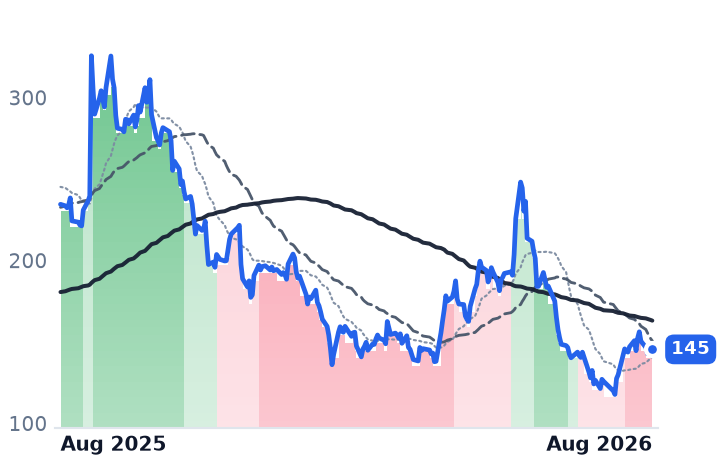
DT Midstream is where the price and the business agree. Revenue growth halved from 27.3% year over year in late 2025 to 11.0%, net income growth collapsed to 4.7%, quarterly EBITDA of $305m slipped $3m sequentially, guidance was reaffirmed rather than raised and the third quarter was guided lower. Mizuho cut it to Neutral with a $147 target. Its data-center content is genuine but small — over 500 million cubic feet a day of new demand on the NEXUS system, roughly a third of that one pipeline.
Where the multiples sit
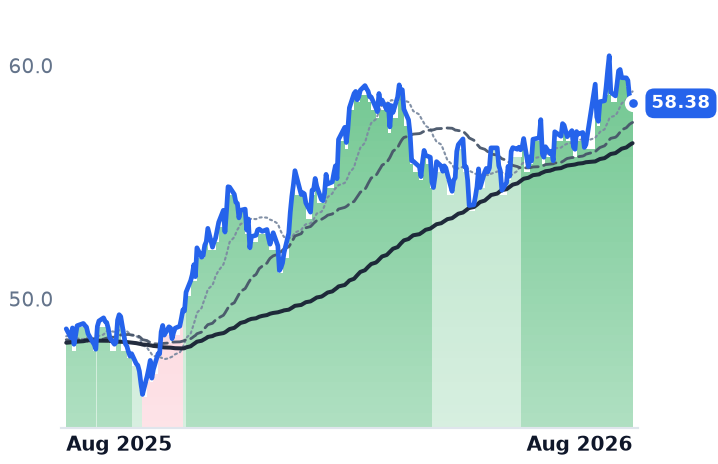
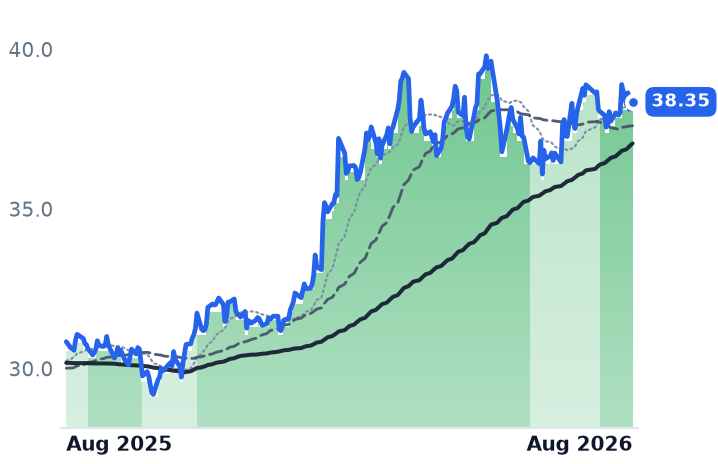
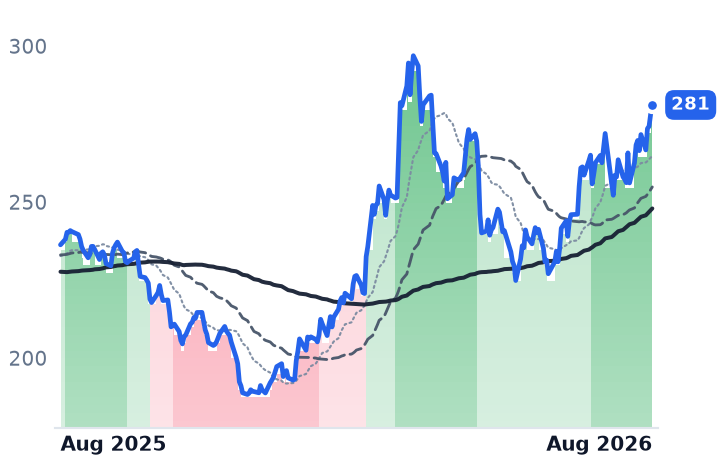
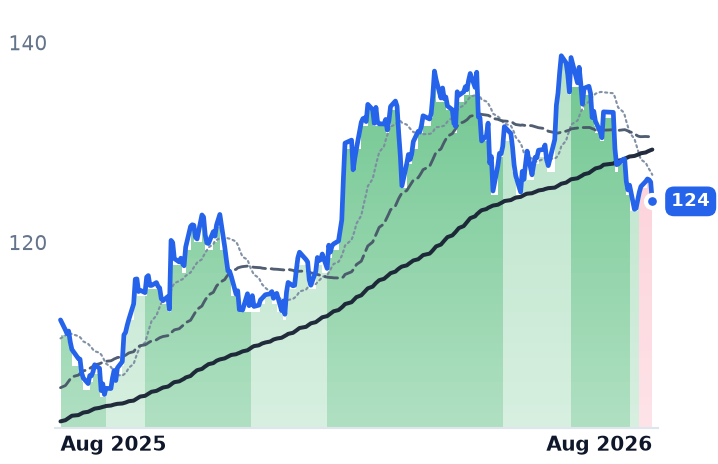
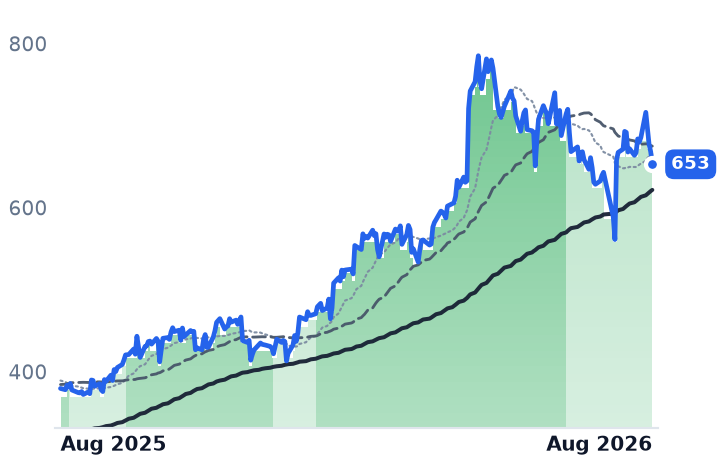
On trailing enterprise value to EBITDA, the lens that respects the debt these systems carry, Kinder Morgan trades at 12.5x, Williams at 15.7x and DT Midstream at 14.8x. Kinder Morgan's trailing price/earnings ratio has fallen to 19.9x from 21.7x in mid-May on materially higher earnings, with a 5.6% free-cash-flow yield. Williams has worked off part of a premium — 28.0x trailing against 34.1x in early May — but its free-cash-flow yield is negative, at -0.2%, because growth capital exceeds operating cash. DT Midstream is the outlier: 26.8x forward earnings on decelerating growth, with consensus penciling 2027 revenue growth of 4.6%.
The risk the political story makes concrete is timing, not demand. Energy Transfer's Transwestern line for Oracle's New Mexico campus slipped to February 2027 from August 2026 after the state land commissioner refused a right-of-way. Contracted molecules still need a permitted route.
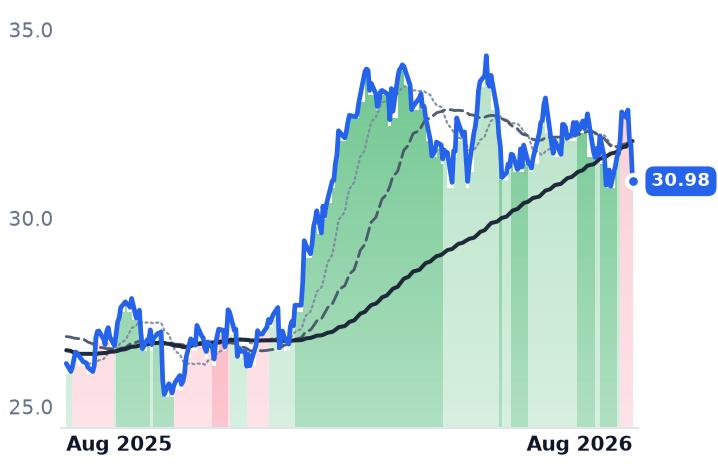
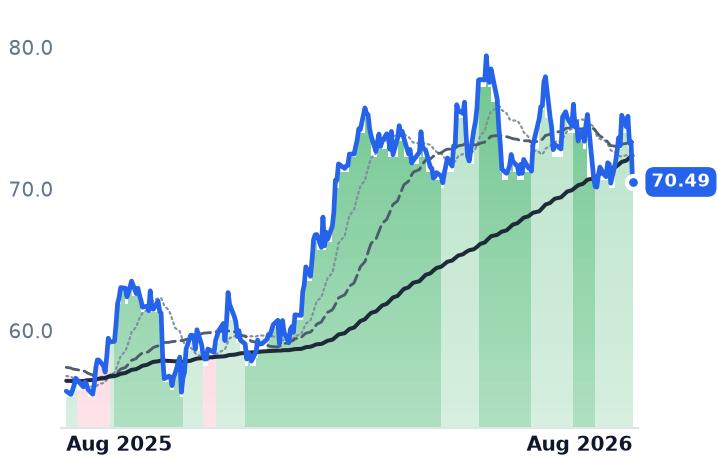
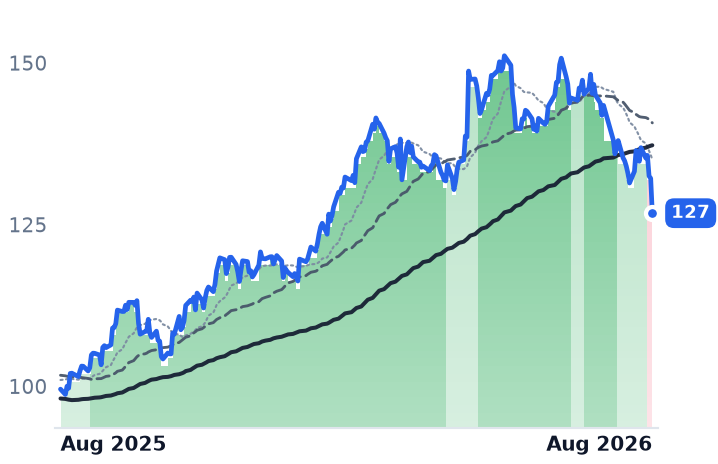
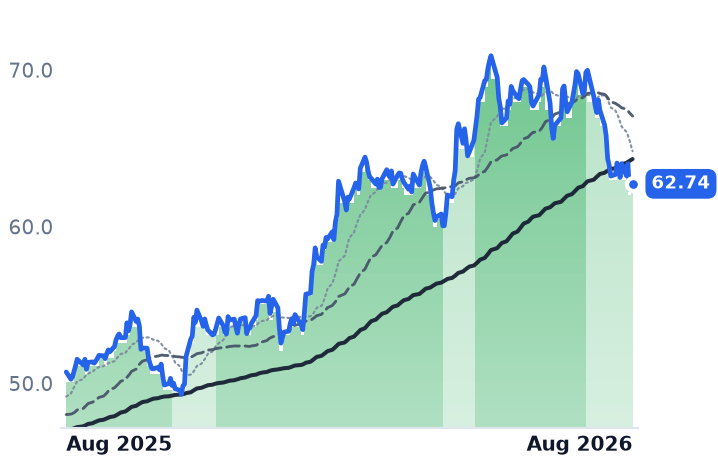
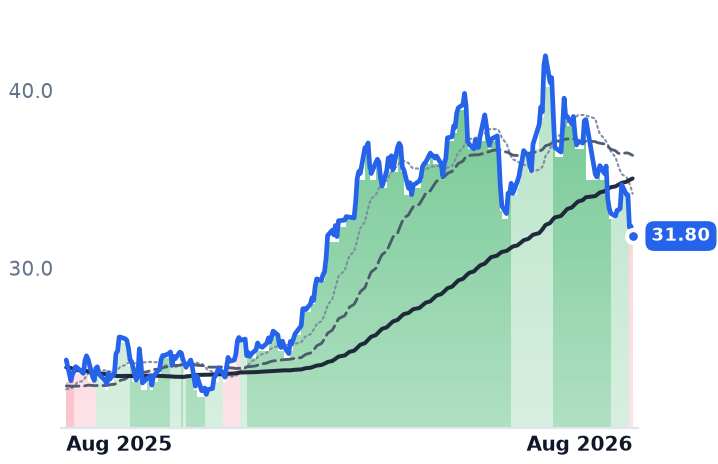
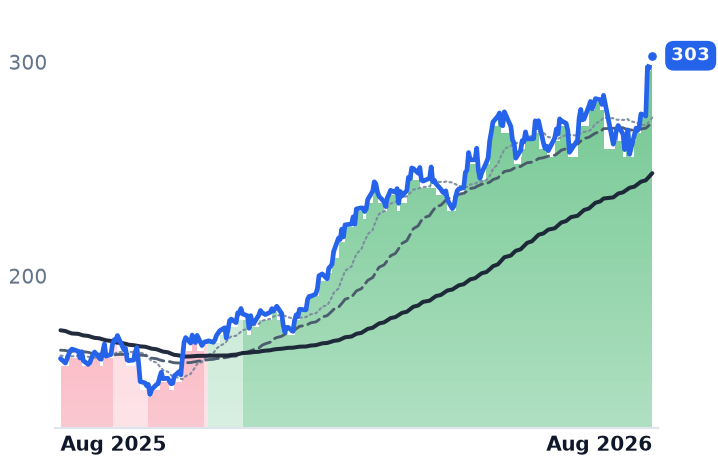
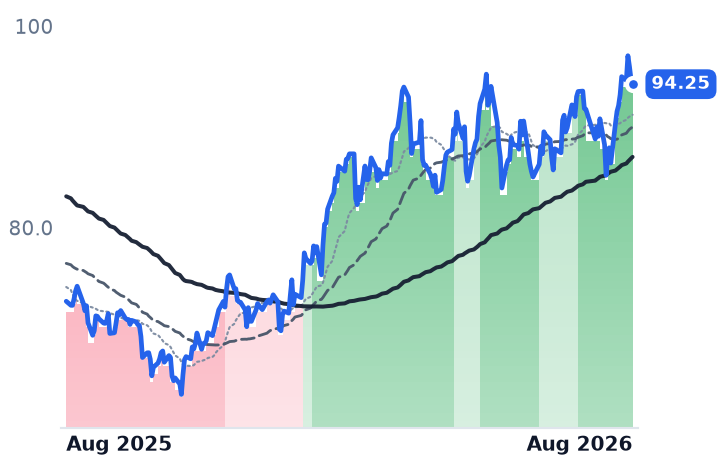
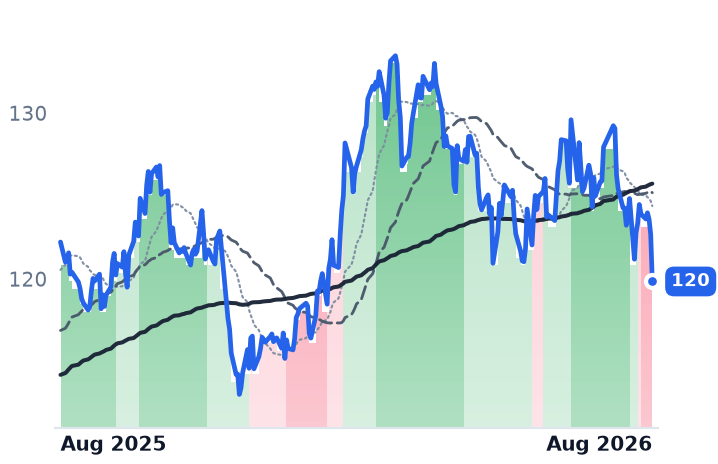
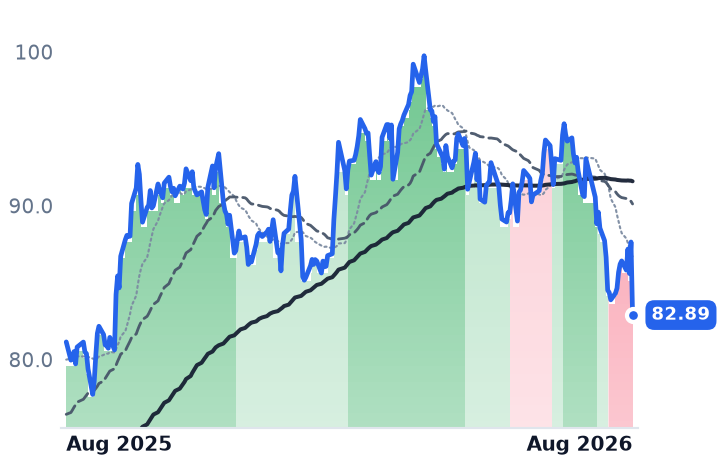
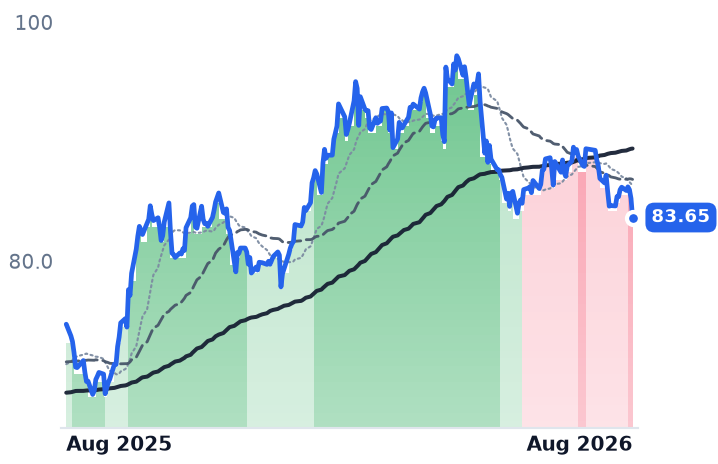
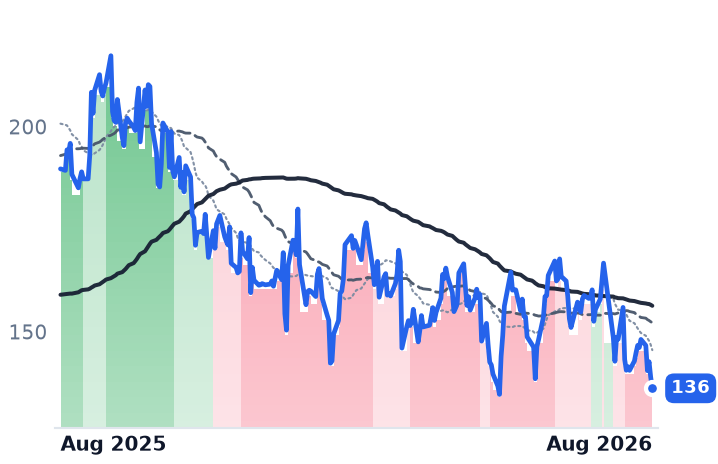
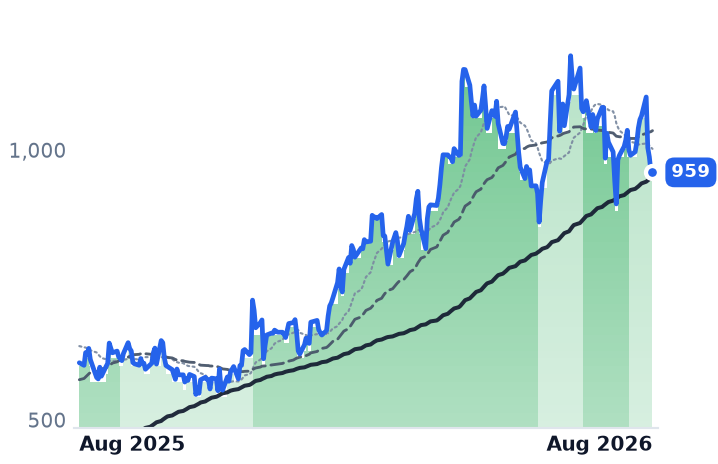
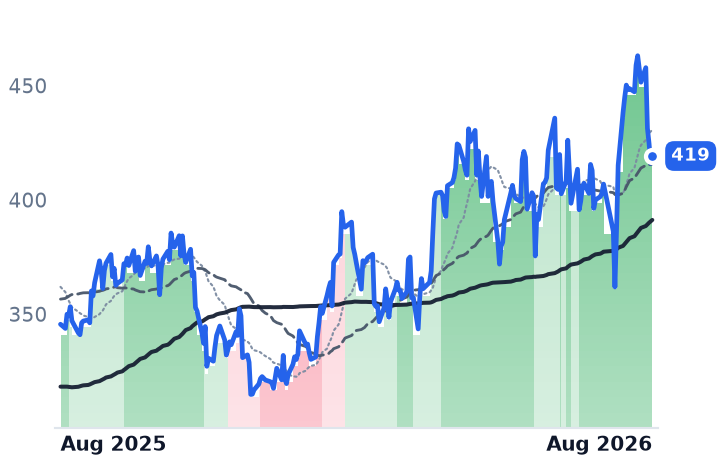
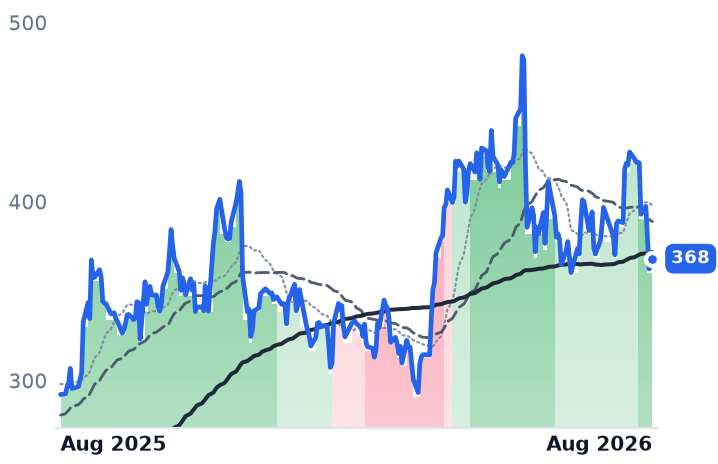
All three had traded above their long-run averages for most of the year; that broke on 21 August for Kinder Morgan and Williams, and on 18 August for DT Midstream. Each remains higher over twelve months. Consensus still has Kinder Morgan earning $1.53 a share in 2027 against $1.52 this year — no growth at all in the year the backlog is meant to convert.
The setup
Where it stands — Kinder Morgan's earnings, backlog and permits improved through the summer while its multiple compressed alongside data-center-exposed utilities. Would confirm — Kinder Morgan adds the promised $1bn-plus to its sanctioned backlog in the second half of 2026. Would invalidate — A power or data-center customer cancels or defers a contracted Kinder Morgan project, cutting the $9.6bn backlog. Watch next — Third-quarter results in late October, and whether Pennsylvania's order is copied in Ohio or Virginia. Valuation — Kinder Morgan at 12.5x trailing enterprise value to EBITDA, 19.9x trailing and 20.4x forward earnings, against 21.7x in mid-May.