

ESAB's Sales Hit a Record; Operating Income Fell 27.8% as the $1.45bn Eddyfi Deal Closed
Hypothesis Opus 5 · Research Opus 5 · Writing Opus 5 · Prompt v1.6
A welding maker that raised its full-year profit guidance in August has lost roughly a third of its value over twelve months, and the reason is not demand. ESAB's second-quarter sales grew 12.9% but only 2.5% before acquisitions and currency, and the debt and equity raised to buy the inspection business Eddyfi cost $0.16 a share — more than Eddyfi itself contributed.
Lincoln Electric, the closest comparable, reported its first volume growth in nine quarters and says the Americas industrial recovery is durable. Arc time in North American fab shops is expanding. ESAB trades at 13.7x forward earnings against Lincoln's 24.4x, and what the market is repricing sits below the gross-profit line.
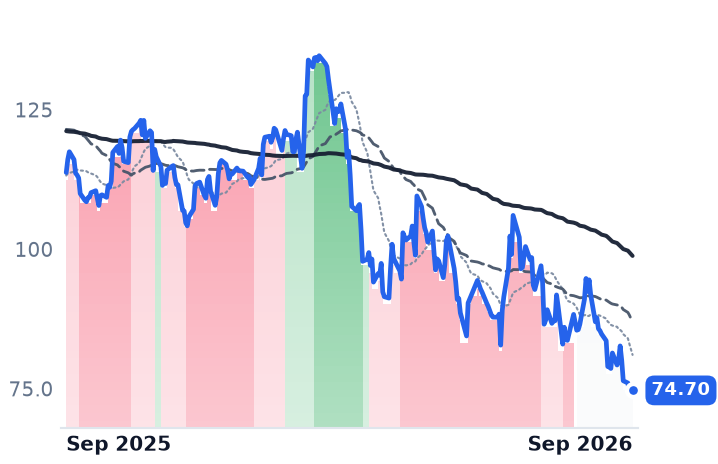
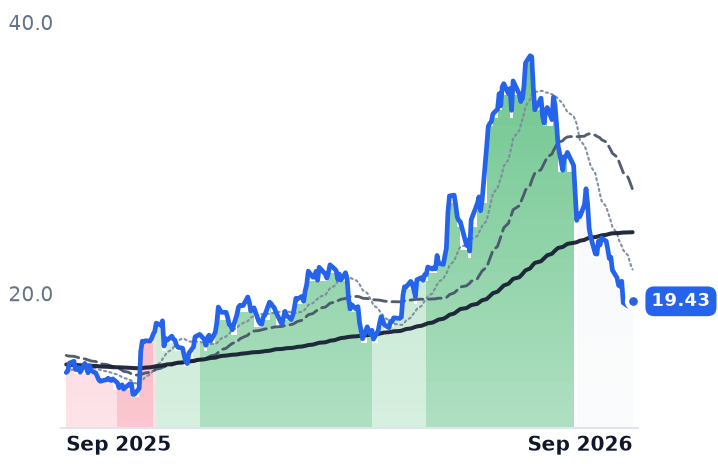
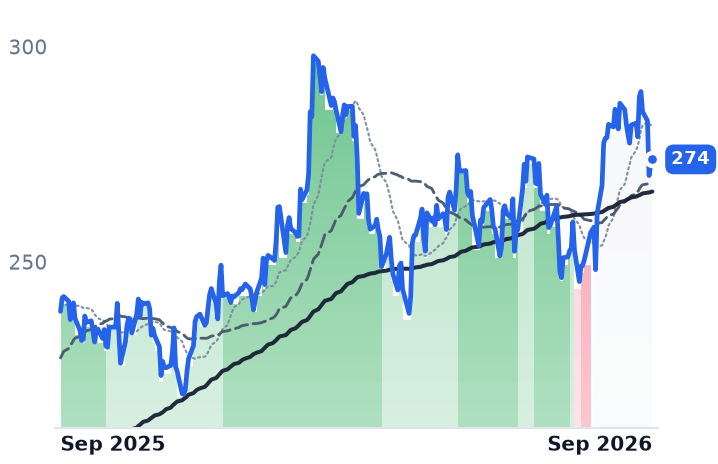
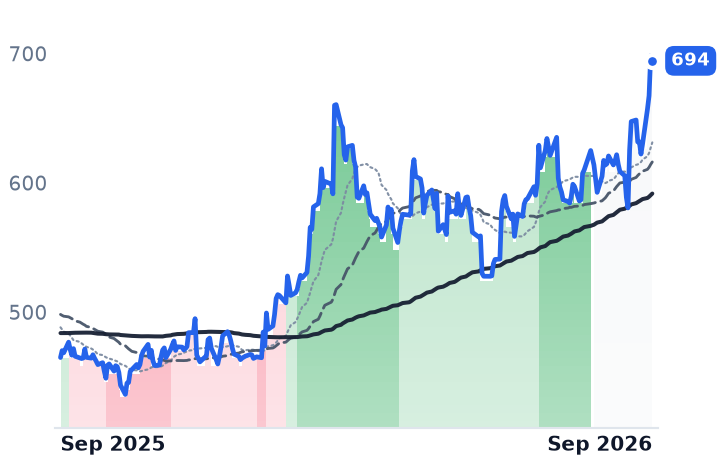
| Ticker | Company | Segment | Trend · 13mo | 30D | 1Y |
|---|---|---|---|---|---|
| The subject · what this brief is about | |||||
ESAB | ESAB | Welding & Cutting Solutions | 🔴 Cont. Bear | −21.2% | −34.3% |
MEC | Mayville Engineering | Welding & Cutting Solutions | 🟢 Cont. Bull | −29.9% | +37.0% |
| Compared against · context, not the story | |||||
LECO | Lincoln Electric | Welding & Cutting Equipment | 🟢 Cont. Bull | −1.4% | +14.8% |
DE | Deere | Agricultural Tractors & Equipment | 🌱 Emerging Bull | +12.5% | +49.4% |
AGCO | AGCO | Agricultural Tractors & Equipment | ⚠️ Emerging Bear | +17.4% | +17.4% |
ITW | Illinois Tool Works | Specialty Components & Systems | ⚠️ Emerging Bear | −7.9% | +6.0% |
KMT | Kennametal | Metal Cutting Tools | ⚠️ Emerging Bear | −18.4% | +39.8% |
CMI | Cummins | Power & Propulsion Systems | 🟢 Cont. Bull | −14.2% | +40.2% |
PCAR | PACCAR | Specialty Components & Systems | 🟢 Cont. Bull | −8.4% | +32.2% |
NPO | EnPro Industries | Specialty Components & Systems | 🟢 Cont. Bull | −11.8% | +39.8% |
NUE | Nucor | Integrated Steelmakers | 🟢 Cont. Bull | −4.2% | +82.7% |
12-month price & trend
| Ticker | Mkt cap | P/E | P/E fwd | P/S | P/S fwd | P/GP | P/GP fwd | EV/EBITDA | FCF yld |
|---|---|---|---|---|---|---|---|---|---|
ESAB | $4.5B | 27.4x | 13.7x | 1.5x | 1.5x | 4.2x | 4.2x | 15.2x | 4.3% |
MEC | $408.4M | n/m | 75.1x | 0.7x | 0.6x | 8.1x | 7.5x | 23.2x | -1.1% |
LECO | $14.9B | 27.1x | 24.4x | 3.3x | 3.2x | 9.3x | 8.8x | 17.8x | 3.5% |
| Ticker | Mkt cap | P/E | P/E fwd | P/S | P/S fwd | P/GP | P/GP fwd | EV/EBITDA | FCF yld |
|---|---|---|---|---|---|---|---|---|---|
DE | $151.8B | 31.5x | 31.4x | 3.3x | 3.7x | 9.3x | 10.3x | 18.0x | 2.4% |
AGCO | $8.2B | 10.7x | 18.9x | 0.8x | 0.8x | 3.2x | 3.1x | 7.2x | 6.7% |
ITW | $71.3B | 22.8x | 21.9x | 4.4x | 4.3x | 10.0x | 9.7x | 17.2x | 3.8% |
| Ticker | Mkt cap | P/E | P/E fwd | P/S | P/S fwd | P/GP | P/GP fwd | EV/EBITDA | FCF yld |
|---|---|---|---|---|---|---|---|---|---|
KMT | $2.6B | 19.3x | 9.4x | 1.2x | 1.1x | 3.9x | 3.6x | 9.0x | 2.8% |
CMI | $81.1B | 29.9x | 19.9x | 2.3x | 2.2x | 9.2x | 8.5x | 17.4x | 4.2% |
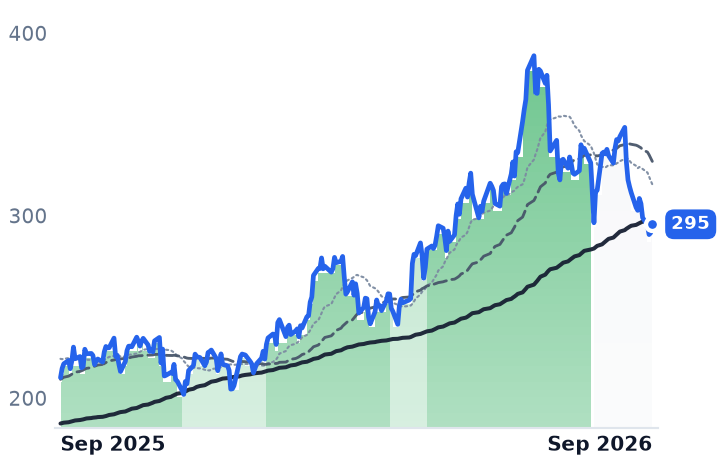
PCAR | $58.1B | 23.5x | 19.4x | 2.1x | 2.0x | 14.1x | 13.4x | 20.0x | 5.6% |
| Ticker | Mkt cap | P/E | P/E fwd | P/S | P/S fwd | P/GP | P/GP fwd | EV/EBITDA | FCF yld |
|---|---|---|---|---|---|---|---|---|---|
NPO | $6.6B | 151.6x | 33.8x | 5.6x | 5.1x | 13.2x | 12.1x | 35.4x | 2.6% |
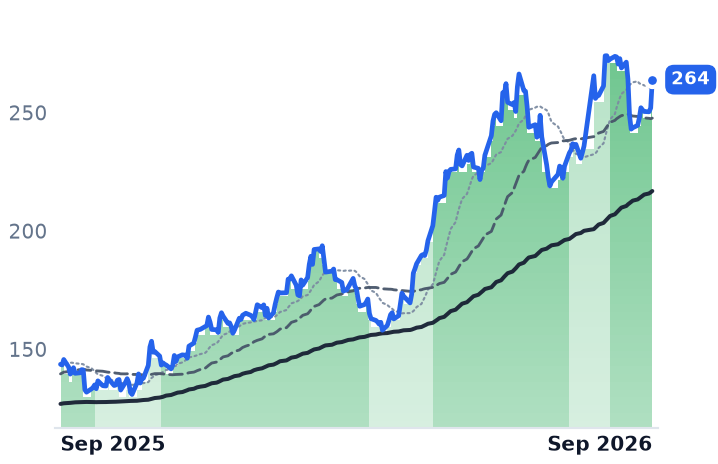
NUE | $51.7B | 22.3x | 15.9x | 1.5x | 1.4x | 10.8x | 9.7x | 11.5x | 1.0% |
Consensus projections
| Ticker | FY2026E | FY2027E | FY2028E | |
|---|---|---|---|---|
ESAB | Revenue | +13.3% | +9.2% | +4.2% |
| EPS | +3.2% | +18.3% | +13.5% | |
MEC | Revenue | +16.5% | +14.1% | +8.1% |
| EPS | +121.9% | +293.2% | +40.4% | |
LECO | Revenue | +10.7% | +6.2% | +6.3% |
| EPS | +14.9% | +11.7% | +9.8% | |
DE | Revenue | +7.8% | +9.5% | +9.7% |
| EPS | −3.0% | +28.7% | +22.8% | |
AGCO | Revenue | +7.9% | +5.4% | +5.7% |
| EPS | +20.5% | +34.1% | +28.7% | |
ITW | Revenue | +3.6% | +3.5% | +3.3% |
| EPS | +8.0% | +7.0% | +6.0% | |
KMT | Revenue | +17.3% | +11.9% | −0.6% |
| EPS | +165.5% | +4.0% | −40.5% | |
CMI | Revenue | +13.1% | +8.9% | +8.0% |
| EPS | +29.6% | +16.9% | +16.9% | |
PCAR | Revenue | +10.1% | +8.3% | +8.1% |
| EPS | +12.8% | +18.1% | +14.4% | |
NPO | Revenue | +13.6% | +6.3% | — |
| EPS | +17.5% | +12.5% | — | |
NUE | Revenue | +16.3% | +2.4% | +1.5% |
| EPS | +79.7% | +9.6% | +6.0% |
Forward fiscal years only. Blank means no analyst coverage for that year.
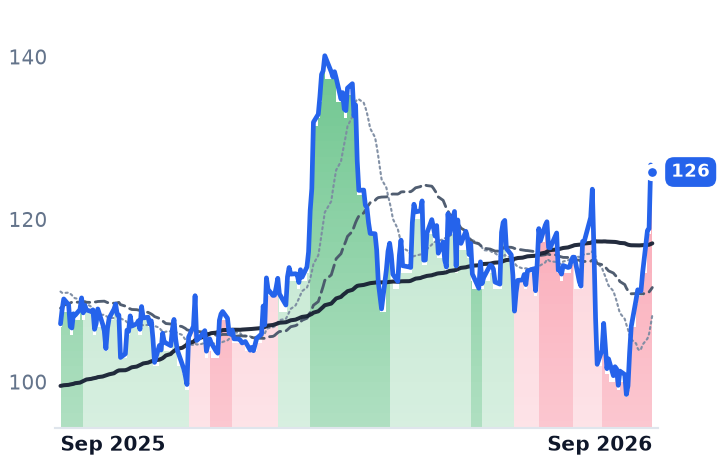
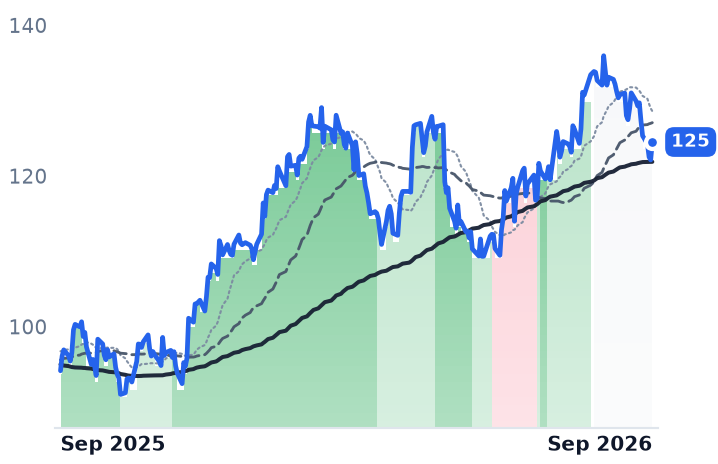
ESAB Corporation, which sells welding wire, electrodes, fluxes and cutting equipment through industrial distributors, reported record quarterly sales on 6 August and told investors it would make more money this year than it had previously promised. Sales reached $808m, up 12.9%, full-year core adjusted earnings before interest, taxes, depreciation and amortization guidance went up to $615–625m, and the shares then ground out one 52-week low after another — $89.06, then $83.14, then $82.15, most recently $77.28.
What is being repriced is a purchase, not a market. ESAB paid $1.45bn for Eddyfi Technologies, a non-destructive inspection business, closing 1 June, and the money to pay for it — pre-funded debt in March, mandatory convertible preferred stock, and 1.25m common shares issued in June — cost $0.16 a share in the quarter while Eddyfi's own contribution was $0.07.
The damage is below the gross line
ESAB's gross margin expanded 86 basis points to 38.0% and gross profit rose 15.5%. Operating income fell 27.8% to $78.7m and net income fell 51.6% to $32.4m. Nothing in that gap is pricing or input cost; it is acquisition, integration and financing charges. On the company's core adjusted basis, EBITDA of $150m rose 8% but margin slipped 90 basis points to 19.5%, and earnings of $1.33 a share were down 1%. Management carries roughly $15m of what it calls transitory price/cost drag, with pricing at 2% in the quarter and expected near 3% in the second half.
The organic softness is geographic. Americas sales of $316m grew 5% organically, with North American equipment and automation up double digits; Europe, the Middle East and Asia-Pacific grew 14% to $450m but just 1% organically, dragged by a Middle East business worth 7–8% of revenue that fell 10–11% as logistics costs into the region tripled. "Prior to the conflict, that region was growing high double digits for us, closer to 20%," chief executive Shyam Kambeyanda told investors on 6 August. Consumables — the by-the-pound annuity — grew low single digits globally; equipment grew double digits. "The ESAB you see today is a transformed enterprise with equipment now representing over 50% of our revenue," Kambeyanda said, against 38% a decade ago.
Lincoln Electric says the meter is running faster
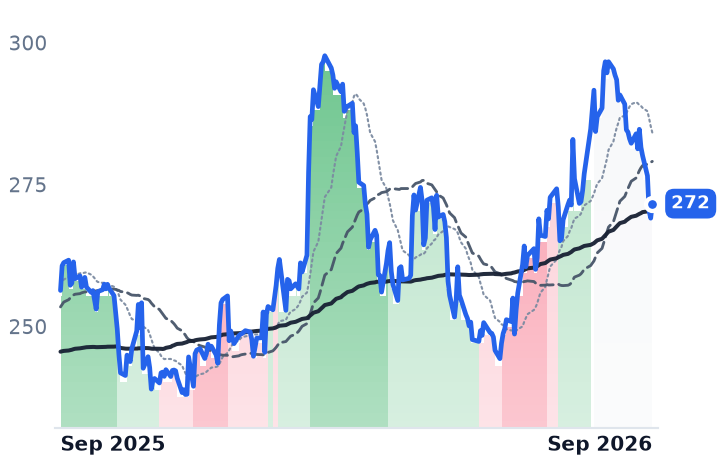
Lincoln Electric, the $14.9bn welding equipment and consumables maker that is ESAB's nearest direct competitor, grew organic sales 10% in its June quarter. Americas Welding rose 11% on seven points of volume, with general fabrication up 30%. "Second quarter marked a solid inflection to volume growth in the business after 9 quarters of compression," chairman and chief executive Steven Hedlund said on 30 July. Its International Welding segment shrank 4.5% on a roughly 5% volume decline in Europe — corroborating ESAB's flat continent rather than contradicting it. Lincoln also raised full-year guidance, and trades at 24.4x forward earnings against ESAB's 13.7x. A year ago, ESAB's own $114.06 share price implied about 20.9x the same $5.45 of 2026 consensus earnings.
The other name on the same shelf
Mayville Engineering, a $408m build-to-print contract fabricator that sells finished assemblies and no welding consumables at all, is filed under the same metal-fabrication label. It raised full-year revenue guidance to $620–650m on 5 August, grew data-center and critical-power sales 173% organically, and has still fallen 48% from a 29 June peak. Its de-rating has a ledger behind it: free cash flow guidance cut to $7–15m, net debt of $134.7m, leverage of 2.9x against a 2.5x target, and 75x forward earnings. Build rates are not the culprit for either company — July Class 8 truck orders rose 71% year over year with 2026 slots full.
What the decline earns
ESAB has earned part of its discount: 2.5% core organic growth against Lincoln's 10%, a flat Europe, a shrinking Middle East, and a margin line that pays for the deal before it collects on it. What nothing in the quarter earns is the roughly 44% gap to Lincoln's forward multiple, which prices Eddyfi's expected $50m of EBITDA and $20m-plus of targeted synergies as unlikely to arrive. ESAB's heaviest selling day came on 19 August, nearly two weeks after the print, with no discoverable announcement; the likelier reading is position liquidation rather than fresh news.
Management concedes Eddyfi is dilutive to neutral in the fourth quarter before turning positive in 2027. Until then ESAB is judged on a profit line carrying the price of the purchase and none of its earnings — in a welding market that, for the first time in more than two years, is growing again.