

UGP's +28% Is a Fuel-Formalization Trade, Not a Brazil Re-Rating
Prompt v1.0
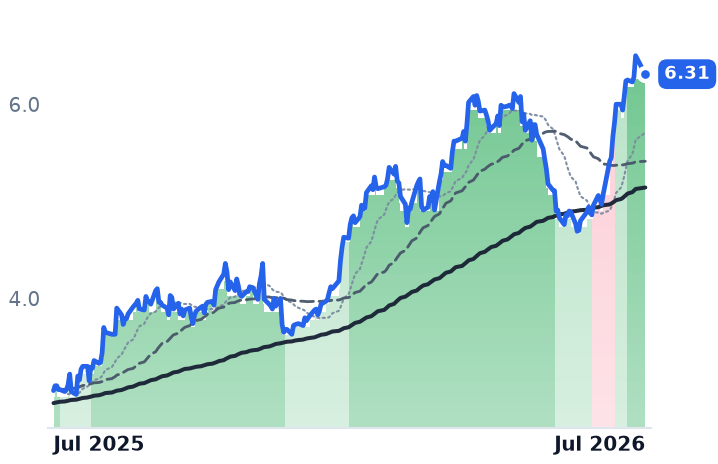
Ultrapar's gradual +28% one-month advance is the only Brazilian name in the watchlist's 30-day top-15 movers — and the cohort behind it is deteriorating, with EWZ downgraded to strongly bearish on 8 July and VALE on 21 July. The driver is record Ipiranga distribution margins after federal raids on illegal fuel operators, not a country-level re-rating.
| Ticker | Company | Segment | Trend · 13mo | 30D | 1Y |
|---|---|---|---|---|---|
UGP | Ultrapar Participações | Fuel Distributors & Retailers | 🟢 Cont. Bull | +24.7% | +106.9% |
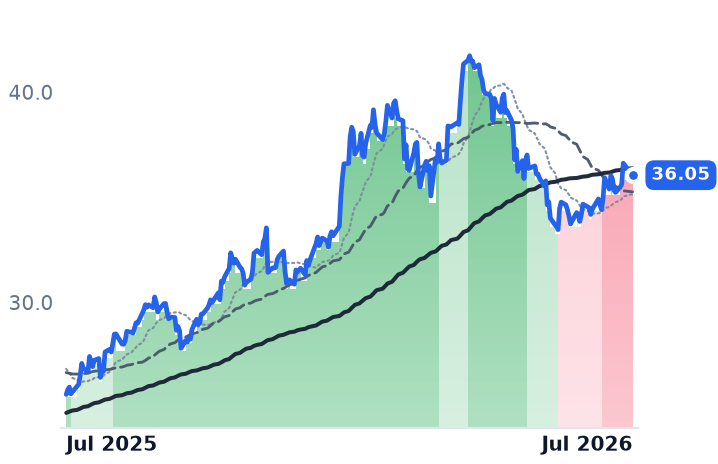
EWZ | iShares MSCI Brazil ETF | Asset Management | ⚠️ Emerging Bear | +4.3% | +40.7% |
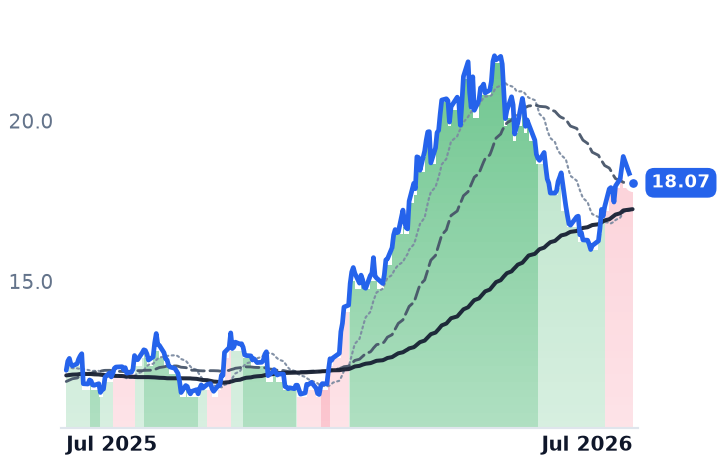
PBR | Petróleo Brasileiro S.A. - Petrobras | Upstream Exploration & Production | 🟢 Cont. Bull | +11.0% | +47.8% |
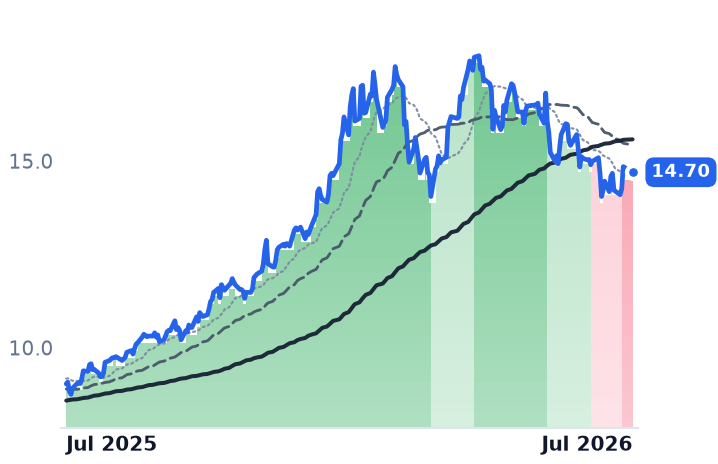
VALE | Vale | Major Diversified Mining | 🟢 Cont. Bull | −2.2% | +62.7% |
ITUB | Itaú Unibanco | Major International Banks | 🟢 Cont. Bull | +1.1% | +49.8% |
BBD | Banco Bradesco | Latin America & Caribbean Banks | ⚠️ Emerging Bear | +5.9% | +34.3% |
NU | Nu | Emerging Markets & Specialized Banking | ⚠️ Emerging Bear | +11.8% | +16.4% |
ABEV | Ambev | Global Brewers | 🟢 Cont. Bull | −1.6% | +37.5% |
SBS | Companhia de Saneamento Básico do Estado de São Paulo - SABESP | International & Diversified Water | ⚠️ Emerging Bear | −5.0% | −71.0% |
XP | XP | Diversified Financial Services | ⚠️ Emerging Bear | +3.0% | +4.6% |
CIG | Companhia Energética de Minas Gerais | Brazilian Integrated Utilities | ⚠️ Emerging Bear | +5.0% | +22.1% |
BSBR | Banco Santander (Brasil) | Latin America & Caribbean Banks | ⚠️ Emerging Bear | +4.8% | +17.9% |
EWZS | iShares MSCI Brazil Small-Cap ETF | Asset Management | ⚠️ Emerging Bear | +0.4% | +13.2% |
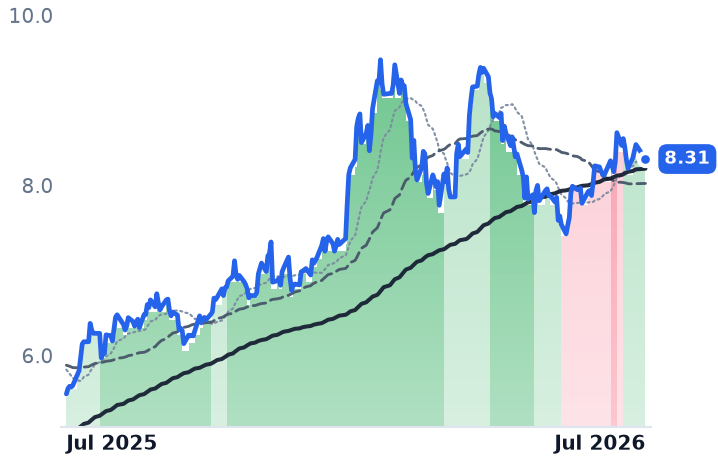
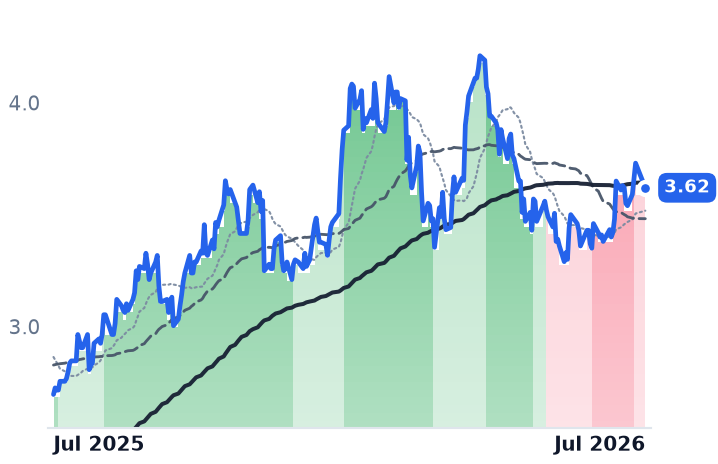
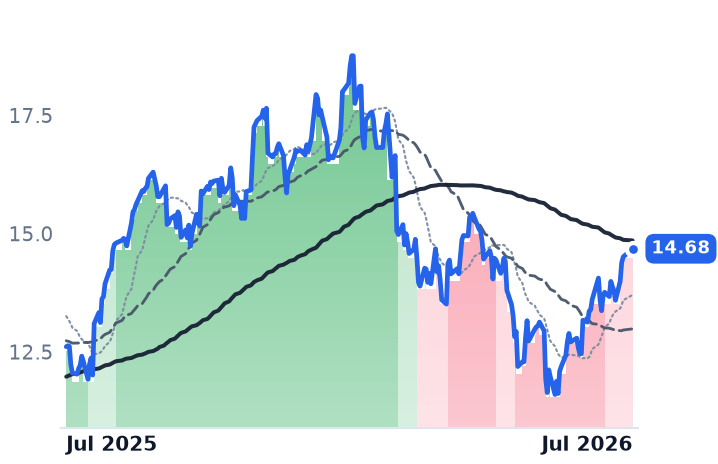
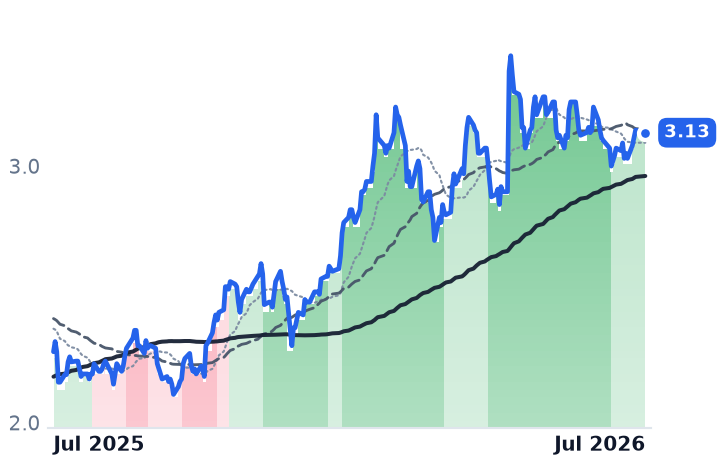
12-month price & trend
| Ticker | Mkt cap | P/E | P/E fwd | P/S | P/S fwd | P/GP | P/GP fwd | EV/EBITDA | FCF yld |
|---|---|---|---|---|---|---|---|---|---|
UGP | $6.2B | 10.4x | — | 0.2x | — | 3.0x | — | 6.7x | 10.8% |
EWZ | $7.4B | — | — | — | — | — | — | — | — |
PBR | $128.4B | 5.7x | 4.8x | 1.2x | 1.1x | 2.7x | 2.4x | 4.5x | 12.8% |
| Ticker | Mkt cap | P/E | P/E fwd | P/S | P/S fwd | P/GP | P/GP fwd | EV/EBITDA | FCF yld |
|---|---|---|---|---|---|---|---|---|---|
VALE | $69.6B | 24.3x | 8.1x | 1.8x | 1.7x | 5.2x | 4.9x | 6.2x | 4.8% |
ITUB | $86.4B | 9.5x | — | 1.1x | — | 3.3x | — | 24.2x | 8.0% |
BBD | $36.7B | 8.0x | — | 0.5x | — | 1.7x | — | 34.5x | 109.2% |
| Ticker | Mkt cap | P/E | P/E fwd | P/S | P/S fwd | P/GP | P/GP fwd | EV/EBITDA | FCF yld |
|---|---|---|---|---|---|---|---|---|---|
NU | $58.9B | 18.6x | 14.0x | 3.4x | 2.7x | 7.7x | 6.2x | 21.4x | 6.4% |
ABEV | $47.9B | 15.7x | — | 2.8x | — | 5.6x | — | 8.1x | 9.1% |
SBS | $19.5B | 11.7x | — | 2.6x | — | 7.0x | — | 9.1x | 7.6% |
| Ticker | Mkt cap | P/E | P/E fwd | P/S | P/S fwd | P/GP | P/GP fwd | EV/EBITDA | FCF yld |
|---|---|---|---|---|---|---|---|---|---|
XP | $9.2B | 9.0x | — | 2.5x | — | 3.8x | — | 19.3x | 25.1% |
CIG | $6.3B | 9.7x | — | 1.1x | — | 7.8x | — | 10.3x | 6.7% |
BSBR | $39.9B | 15.5x | — | 1.1x | — | 2.8x | — | 1.4x | 2.9% |
| Ticker | Mkt cap | P/E | P/E fwd | P/S | P/S fwd | P/GP | P/GP fwd | EV/EBITDA | FCF yld |
|---|---|---|---|---|---|---|---|---|---|
EWZS | $145.3M | — | — | — | — | — | — | — | — |
Consensus projections
| Ticker | FY2026E | FY2027E | FY2028E | |
|---|---|---|---|---|
UGP | Revenue | +15.0% | −0.4% | +0.2% |
| EPS | +17.4% | +3.9% | +18.2% | |
PBR | Revenue | +27.3% | −4.1% | −1.9% |
| EPS | +33.2% | −9.4% | −5.2% | |
VALE | Revenue | +8.3% | −0.4% | +2.6% |
| EPS | +0.3% | −4.0% | +0.4% | |
ITUB | Revenue | +8.3% | +8.5% | +7.1% |
| EPS | +9.7% | +11.3% | +9.9% | |
BBD | Revenue | +11.9% | +8.3% | +7.3% |
| EPS | +15.4% | +13.6% | +8.3% | |
NU | Revenue | +54.4% | +21.7% | +14.0% |
| EPS | +42.6% | +32.7% | +26.4% | |
ABEV | Revenue | +5.7% | +4.4% | +5.3% |
| EPS | +7.1% | +7.0% | +5.1% | |
SBS | Revenue | +11.4% | +18.9% | +10.4% |
| EPS | −1.5% | +27.5% | +12.6% | |
XP | Revenue | +17.2% | +13.8% | +12.0% |
| EPS | +14.0% | +14.3% | +14.3% | |
CIG | Revenue | −5.0% | −2.8% | +4.3% |
| EPS | −18.2% | −5.6% | +36.1% | |
BSBR | Revenue | +5.4% | +8.0% | +6.4% |
| EPS | +6.4% | +13.3% | +9.2% |
Forward fiscal years only. Blank means no analyst coverage for that year.
The move is real. The breadth is not.
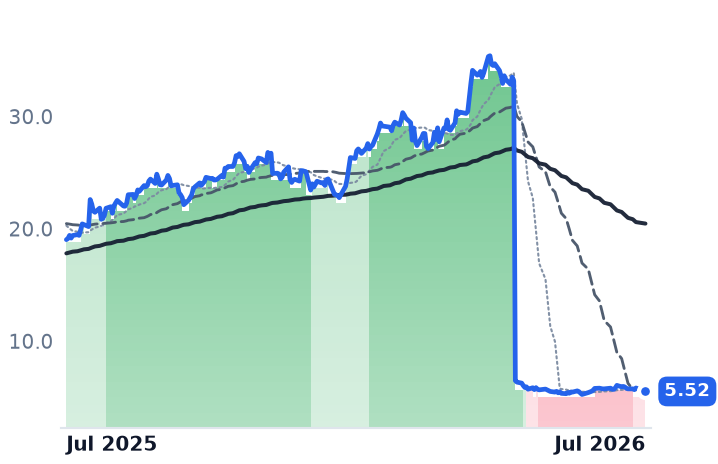
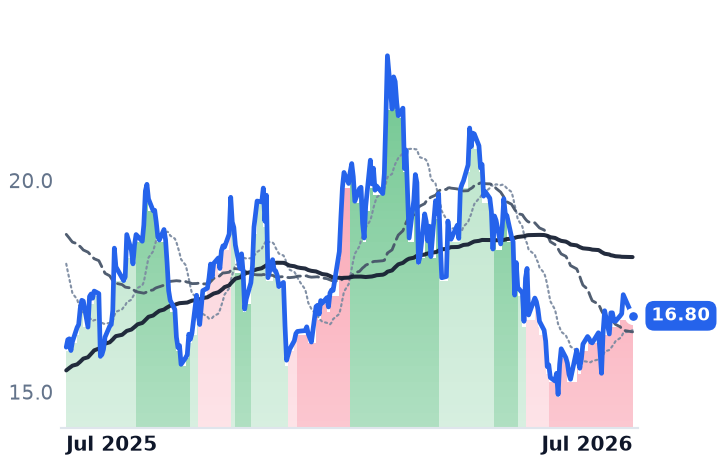
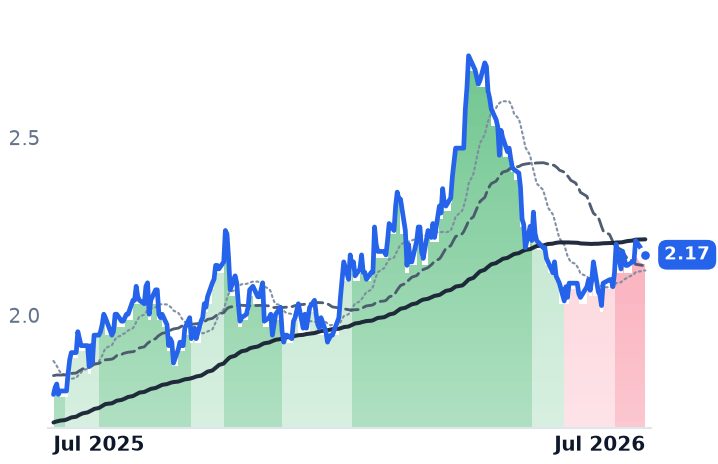
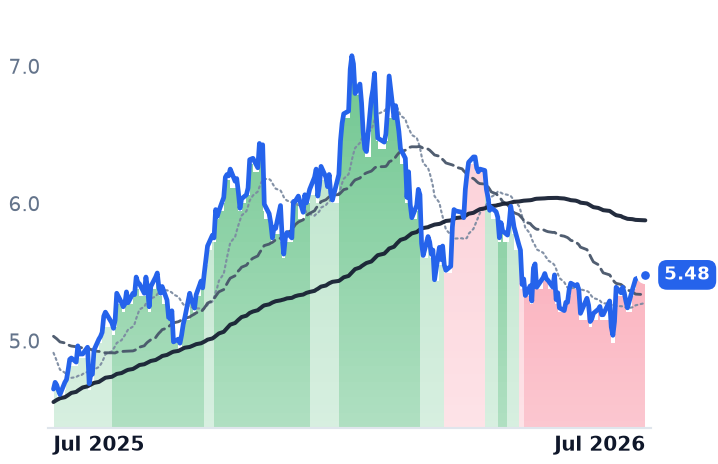
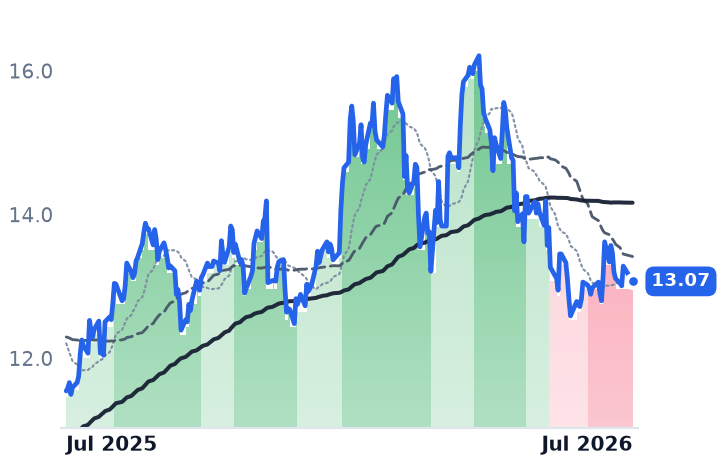
UGP ran from $5.06 on 29 June to $6.50 on 22 July — +28.5%, classified as gradual intensity, with no violent single-day pop. That part of the hypothesis holds. What does not hold is the country read behind it. Over the same 30 days the cohort rose far less (NU +13.4%, PBR +11.1%, BBD +8.7%, ITUB +6.9%, EWZ +6.9%, ABEV flat, VALE -5.5%), and over 90 days almost all of it is down: EWZ -8.7%, PBR -11.2%, XP -11.9%, VALE -13.4%, CIG -15.3%. The 30-day gain is a bounce off a common 8-June trough inside a 90-day drawdown.
Trend bands say the same thing more bluntly. Of 13 Brazil ADRs/ETFs, only UGP (strongly bullish, 17 July) and ITUB (mildly bullish, 14 July) sit in bull bands, plus defensive ABEV which never left. EWZ was downgraded to strongly bearish on 8 July and VALE on 21 July — the most recent index-level transitions are deteriorations, not exits. EWZ at $36.62 remains ~12% under its April high while UGP prints new period highs. UGP's own bull band is 11 days old, the newest in the group.
What is actually driving it
The story is sub-sector, not country. Ipiranga's Q1 EBITDA margin ran near R$240 per cubic metre against BTG's full-year expectation of R$165/m³ and 2025 actuals of R$140/m³. That followed 126 search-and-seizure warrants against a fuel-sector network owing over R$26bn and Ipiranga's CEO reporting a volume jump as ~7% of national distribution share moved into formal hands. Rival Vibra frames the same theme, estimating illegal distributors lost ~3.5pp of share in 2025. Q1 net income of R$914m, +151% y/y and a BofA upgrade to Buy on 8 July with a BRL 37 target date the inflection precisely. VALE's divergence is likewise idiosyncratic — Morgan Stanley cut it to Equalweight on iron-ore surplus.
The macro legs are two-sided
Copom did cut 25bp to 14.25% on 17 June, its third, but gave no forward guidance and stayed deliberately gradual. Foreign flows turned positive at ~R$4.2bn through 21 July, though JPMorgan called it "a respite that won't last", and those gains came on pandemic-low daily volume of R$6.03bn. Against that, a 25% Section 301 US tariff took effect 22 July — the 50% threat was dropped but the dispute is escalating into the October vote — the real gave back its move to 5.11/USD after the announcement, tariff hearings were cited in a 0.93% Ibovespa drop with the index ~12.5% off its high, and the election trade broke when Tarcísio declined to run and Lula regained his lead. Valuation runway survives — ~9x NTM P/E versus ~13x EM — but it is the only leg that does.
One housekeeping note: SBS's apparent -82% three-month print is a 1-for-5 ADR split artifact (R$33.16 to R$6.485 on 7 May, volume up ~5x), already documented by this desk on 10 May. It is not evidence of anything.