

Kinder Morgan Got Cheaper by Earning More; DT Midstream Got Cheaper by Slowing Down
Hypothesis Opus 5 · Research Opus 5 · Writing Opus 5 · Prompt v1.5
The tidy explanation for falling US gas-pipeline shares this month was the bond market: a 30-year Treasury yield at a 19-year high repricing anything that pays a distribution. That explanation broke on 18 August. As the long bond printed 5.33%, Kinder Morgan and Williams closed higher, both roughly 6% above their 7 August lows, while DT Midstream went sideways and TC Energy kept sliding.
What separates them is the business, not the discount rate. Kinder Morgan grew second-quarter adjusted EBITDA 12% and guided the full year at least 5% above budget; it trades at 12.8x trailing enterprise value to EBITDA, the cheapest of the three. DT Midstream's revenue growth halved to 11% year over year from 27%, quarterly EBITDA slipped sequentially, and it still carries 27.9x forward earnings. Williams is the awkward case: guidance raised, margins wider, shares down over three months.
| Ticker | Company | Segment | Trend · 13mo | 30D | 1Y |
|---|---|---|---|---|---|
| The subject · what this brief is about | |||||
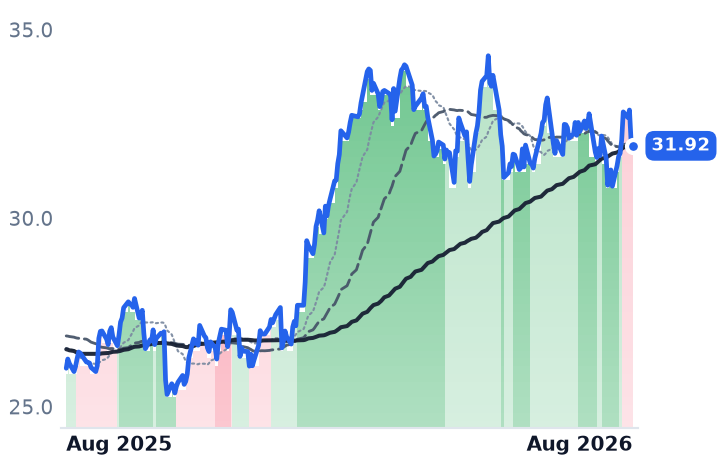
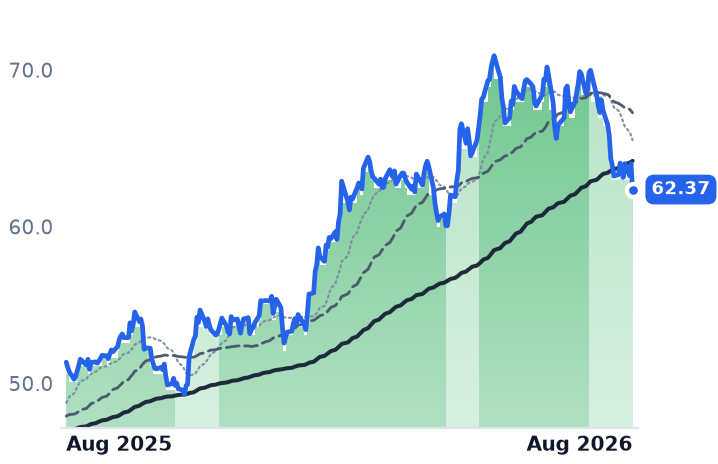
KMI | Kinder Morgan | Natural Gas Pipelines & Transmission | 🟢 Cont. Bull | −1.4% | +22.7% |
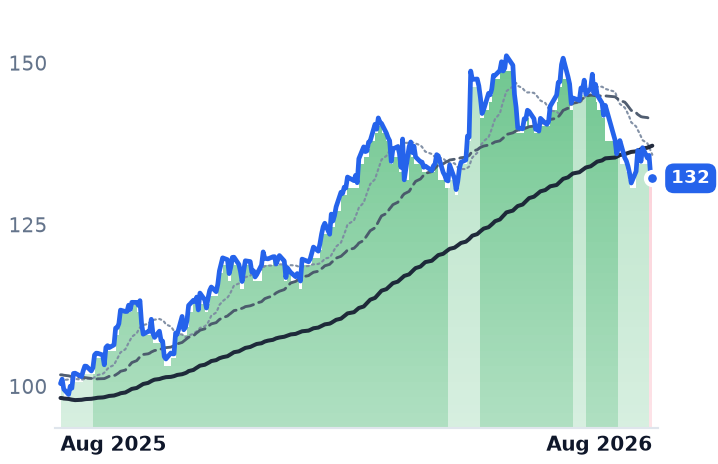
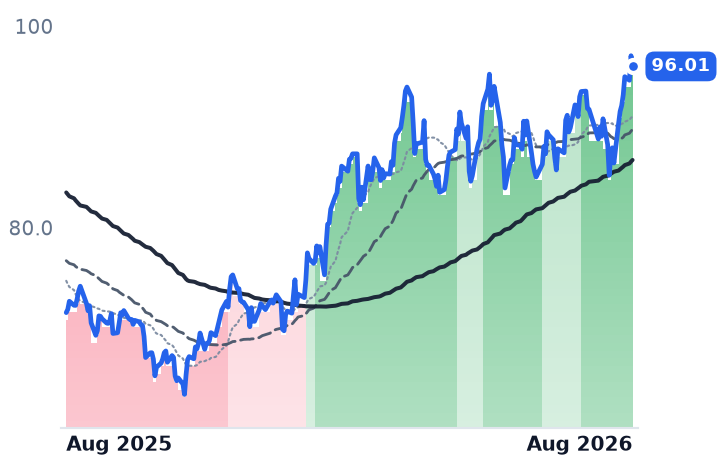
DTM | DT Midstream | Natural Gas Pipelines & Transmission | 🟢 Cont. Bull | −6.9% | +31.6% |
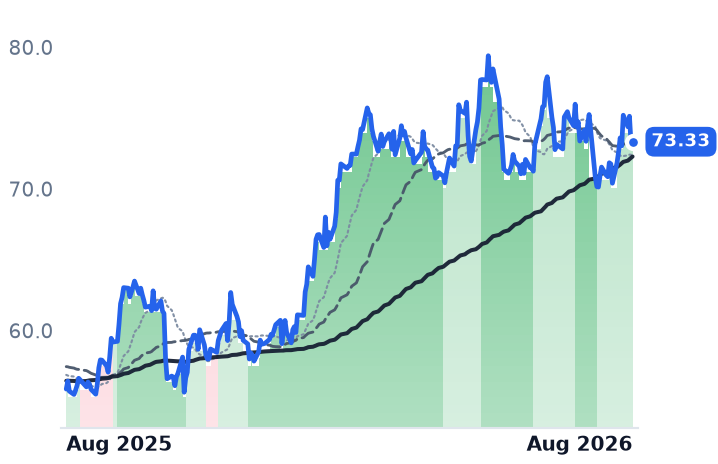
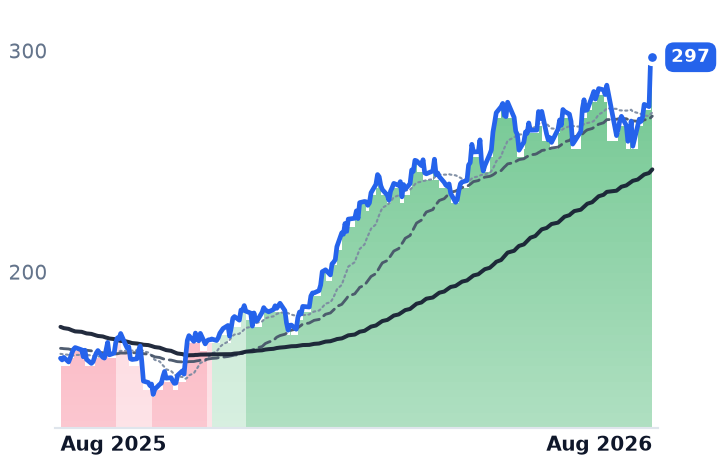
WMB | The Williams Companies | Natural Gas Pipelines & Transmission | 🟢 Cont. Bull | −0.0% | +31.3% |
| Compared against · context, not the story | |||||
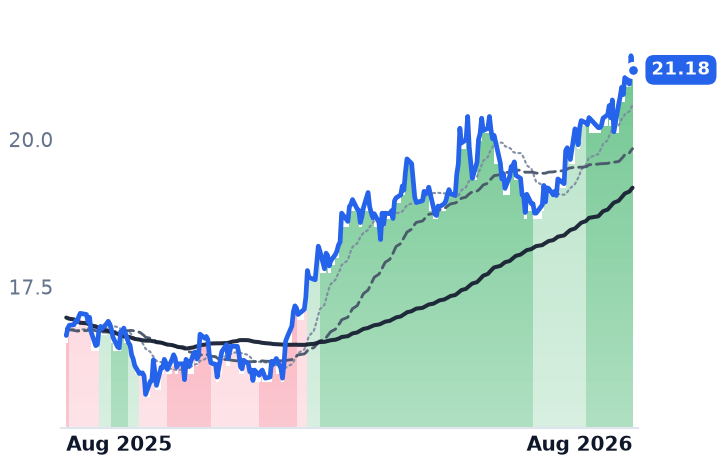
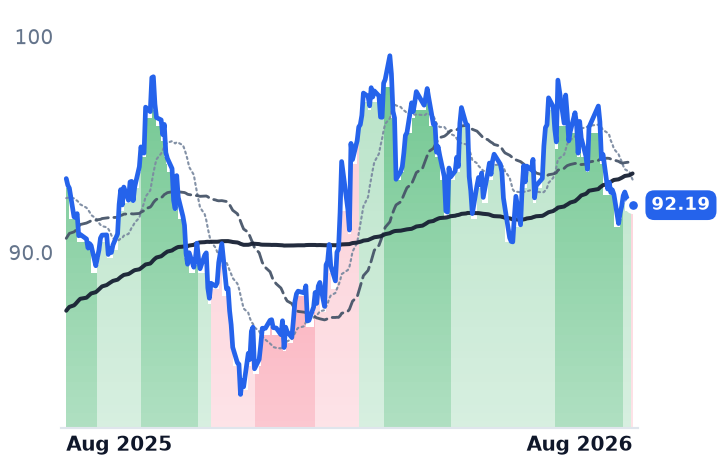
ET | Energy Transfer | Natural Gas Pipelines & Transmission | 🟢 Cont. Bull | +4.6% | +27.0% |
TRP | TC Energy | Natural Gas Pipelines & Transmission | 🟢 Cont. Bull | −9.2% | +21.5% |
OKE | ONEOK | Natural Gas Gathering & Processing | 🌱 Emerging Bull | +4.6% | +34.2% |
TRGP | Targa Resources | Natural Gas Gathering & Processing | 🟢 Cont. Bull | +6.0% | +84.5% |
SO | The Southern | Vertically Integrated Utilities | 🟢 Cont. Bull | −1.8% | −1.3% |
DUK | Duke Energy | Vertically Integrated Utilities | 🟢 Cont. Bull | −1.8% | +1.0% |
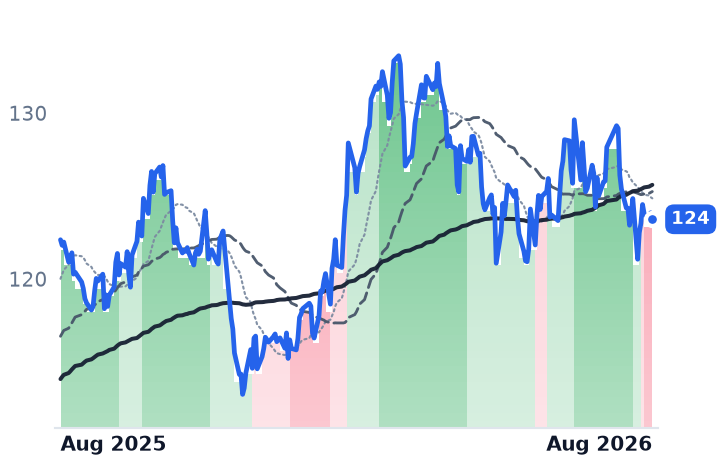
12-month price & trend
| Ticker | Mkt cap | P/E | P/E fwd | P/S | P/S fwd | P/GP | P/GP fwd | EV/EBITDA | FCF yld |
|---|---|---|---|---|---|---|---|---|---|
KMI | $71.1B | 20.5x | 21.0x | 4.0x | 3.9x | 7.2x | 7.1x | 12.8x | 5.4% |
DTM | $13.5B | 28.7x | 27.9x | 10.3x | 10.0x | 16.3x | 15.8x | 15.3x | 3.6% |
WMB | $89.7B | 29.1x | 30.1x | 7.3x | 7.3x | 10.0x | 9.9x | 16.1x | -0.2% |
| Ticker | Mkt cap | P/E | P/E fwd | P/S | P/S fwd | P/GP | P/GP fwd | EV/EBITDA | FCF yld |
|---|---|---|---|---|---|---|---|---|---|
ET | $72.1B | 13.0x | 13.4x | 0.7x | 0.7x | 2.9x | 2.7x | 9.7x | 7.2% |
TRP | $66.2B | 26.6x | 16.9x | 5.8x | 4.1x | 11.2x | 8.0x | 13.8x | 4.4% |
OKE | $54.5B | 14.9x | 15.1x | 1.4x | 1.3x | 6.3x | 6.0x | 11.0x | 5.3% |
| Ticker | Mkt cap | P/E | P/E fwd | P/S | P/S fwd | P/GP | P/GP fwd | EV/EBITDA | FCF yld |
|---|---|---|---|---|---|---|---|---|---|
TRGP | $55.1B | 24.4x | 23.6x | 3.3x | 2.8x | 9.0x | 7.6x | 15.5x | 1.1% |
SO | $106.6B | 22.2x | 20.2x | 3.5x | 3.5x | 8.1x | 8.0x | 12.7x | 2.4% |
DUK | $97.3B | 18.7x | 18.6x | 2.9x | 2.9x | 4.3x | 4.2x | 11.6x | 1.6% |
Consensus projections
| Ticker | FY2026E | FY2027E | FY2028E | |
|---|---|---|---|---|
KMI | Revenue | +8.7% | +2.0% | +5.9% |
| EPS | +18.4% | +0.7% | +8.6% | |
DTM | Revenue | +7.9% | +4.6% | +9.9% |
| EPS | +8.1% | +5.7% | +11.6% | |
WMB | Revenue | +7.8% | +13.8% | +14.7% |
| EPS | +15.0% | +6.6% | +17.7% | |
ET | Revenue | +35.3% | +1.9% | +4.9% |
| EPS | +16.7% | +3.6% | +7.4% | |
TRP | Revenue | +6.7% | +4.4% | +5.3% |
| EPS | +7.3% | +5.4% | +6.2% | |
OKE | Revenue | +25.2% | −5.2% | +2.7% |
| EPS | +6.0% | +9.1% | +10.8% | |
TRGP | Revenue | +16.8% | +16.2% | +10.1% |
| EPS | +27.5% | +14.5% | +17.8% | |
SO | Revenue | +7.7% | +5.5% | +6.1% |
| EPS | +6.8% | +7.5% | +9.2% | |
DUK | Revenue | +5.7% | +4.4% | +4.0% |
| EPS | +6.2% | +6.9% | +7.0% |
Forward fiscal years only. Blank means no analyst coverage for that year.
Kinder Morgan moves roughly 40% of the natural gas burned in the United States through some 83,000 miles of pipe, which makes it the default counterparty when a utility, a liquefied natural gas (LNG) terminal or a new gas-fired power plant needs an interconnect. In the second quarter it grew adjusted earnings before interest, taxes, depreciation and amortization (EBITDA) 12% year over year, lifted adjusted earnings per share 32%, and told investors the full year would come in at least 5% above internal budget — about $430m of incremental EBITDA. It raised the dividend 2%. Then a trend-following screen cut it to a bearish reading on 13 August, while the shares were rising.
The rates story failed a live test
The explanation on offer for a soft month in pipelines was the long end of the bond market. The 30-year Treasury yield topped 5.33% on 18 August, a 19-year high, which Bloomberg attributed to AI infrastructure spending and federal deficits — the same capex wave that fills pipeline backlogs, lifting the rate at which their cash flows are discounted.
It does not survive contact with the prices. Across the drawdown window the 30-year moved about 6 basis points, from 5.27% at the end of July. The yield ordering runs backwards: Energy Transfer, at roughly a 6.5% distribution yield, rose 4.4% over 30 days, while DT Midstream, yielding 2.7%, fell 7.9% and TC Energy fell 8.9%. Kinder Morgan (-1.5%) and Williams (-1.2%) sat closer to the regulated utilities Southern Co (-2.4%) and Duke Energy (-1.8%). Rates explain the shallow, uniform part of the move and none of the rest.
The cheapest name is the one compounding
Kinder Morgan's sanctioned project backlog was $9.6bn at the end of the second quarter, down only because completed projects entered service; gas is about 92% of it and more than 60% serves power generation and local gas utilities — a combined figure, with no separate data-center line disclosed. Federal regulators granted certificates on 31 July for Mississippi Crossing, 208 miles carrying up to 2.1 billion cubic feet a day into the Southeast: the group's largest permitting risk cleared while the shares fell. Transport volumes rose 7% and gathering 26%. Leverage fell to 3.6 times net debt to EBITDA.
Its trailing price-to-earnings ratio is 20.5x, against 21.7x in mid-May on a market capitalization essentially unchanged at $71.1bn. The multiple came down because earnings went up. Free cash flow yield is 5.4%.
DT Midstream earned its de-rating
DT Midstream is a $13.5bn pure-play gas midstream company with 588 employees, gathering Appalachian and Haynesville gas and moving it on the NEXUS and LEAP systems. Its revenue growth halved — 27% year over year in the fourth quarter of 2025, 11% in the second quarter of 2026. Adjusted EBITDA of $305m was $3m below the prior quarter, guidance was reaffirmed rather than raised, and the third quarter was guided lower. Consensus has 2027 revenue growing 4.6%.
The data-center content is real but small: more than 500 million cubic feet a day of demand pull added to NEXUS across two interconnects, roughly a third of that one pipeline and closer to a tenth of total system throughput. At 15.3x EV/EBITDA and 27.9x forward earnings it remains more expensive than Kinder Morgan on both. JPMorgan cut it to Neutral on valuation, with target cuts from Mizuho and Jefferies. Its uptrend broke on 18 August, the first non-bullish reading in some fifteen months — an analyst call and a growth curve, not a bond auction.
Williams is the contradiction
Williams owns Transco, the interstate line that feeds the eastern seaboard. Second-quarter operating margin reached 38.7%, from 32.0%; full-year adjusted EBITDA guidance went to $8.3-8.5bn and the 2025-30 growth target to 11%-plus, from 9% in May. Socrates Phase 1, a 200-megawatt plant sited behind the meter at a Meta campus in Ohio, was built in 18 months — against grid interconnection queues measured in years. Blackstone Credit & Insurance put $5.34bn into a power joint venture covering five projects, the largest 682 megawatts. The shares fell 7.8% over three months and the trailing multiple compressed from 34x to 29x on a flat market value.
The $5.5bn Momentum Midstream purchase adds more than 4,000 miles of pipe and roughly 4 billion cubic feet a day of take-or-pay capacity, making Williams the largest Haynesville gatherer tied to Transco — squarely into DT Midstream's LEAP corridor. Energy Transfer, the month's only riser, contracted about 0.9 billion cubic feet a day to three Oracle data centers. Scarcity is the shared mechanism: one large interstate line, Mountain Valley, has been completed in a decade, and new corridors take five to eight years, so only steel already in the ground serves the late-decade load.
The setup
Where it stands — Kinder Morgan raised guidance and trades at the group's lowest multiple; DT Midstream's growth halved and its premium has only partly gone. Would confirm — Kinder Morgan adding the promised $1bn-plus of sanctioned projects in the second half, and DT Midstream's third-quarter EBITDA printing below $305m. Would invalidate — DT Midstream raising 2026 guidance on new data-center contracts, or Kinder Morgan's backlog shrinking without offsetting in-service additions. Watch next — Third-quarter results: Kinder Morgan in mid-October, DT Midstream and Williams in late October and early November. Valuation — Kinder Morgan 12.8x trailing EV/EBITDA and 21.0x forward earnings; DT Midstream 15.3x and 27.9x; Williams 16.1x and 30.1x.