

Bentley Sells the Design Software for the Grid Buildout and Hasn't Moved Since July 28
Hypothesis Opus 5 · Research Opus 5 · Writing Opus 5 · Prompt v1.5
Three vertical software vendors — warehouse, civil-engineering and property-management specialists — each reported a stronger quarter in the past month. The market repriced only one of them, and the gap between the business news and the share prices is now wide enough to argue about.
Manhattan Associates gapped 33% around its July 28 results and now sits 5.8% below its 52-week high at 37.5x forward earnings, with gross margin down 355 basis points year over year. Bentley Systems, whose software designs transmission lines and data-center campuses, grew annual recurring revenue 12% to $1.536bn with 109% net revenue retention — and its shares closed August 19 within a cent of where they closed July 28, still a third below last year's level. AppFolio sits between them: revenue up 19.3%, operating margin widening, no rate squeeze on its payments float because the Federal Reserve has not cut in 2026.
| Ticker | Company | Segment | Trend · 13mo | 30D | 1Y |
|---|---|---|---|---|---|
| The subject · what this brief is about | |||||
MANH | Manhattan Associates | Specialized Enterprise Solutions | 🔴 Cont. Bear | +24.8% | −4.2% |
BSY | Bentley Systems, Incorporated | Specialized Enterprise Solutions | 🔴 Cont. Bear | +10.8% | −32.6% |
APPF | AppFolio | Specialized Enterprise Solutions | 🔴 Cont. Bear | +19.3% | −20.8% |
| Compared against · context, not the story | |||||
NOW | ServiceNow | Specialized Enterprise Solutions | 🔴 Cont. Bear | +21.5% | −28.3% |
DOCU | DocuSign | Specialized Enterprise Solutions | 🔴 Cont. Bear | +19.2% | −12.0% |
PAYC | Paycom Software | HR & Workforce Management | 🌱 Emerging Bull | +48.4% | −1.9% |
INTA | Intapp | Specialized Enterprise Solutions | 🔴 Cont. Bear | +37.6% | −5.6% |
WDAY | Workday | Enterprise Resource Planning | 🌱 Emerging Bull | +35.4% | −13.3% |
WK | Workiva | Security & Compliance | ⚠️ Emerging Bear | +31.7% | −2.3% |
VEEV | Veeva Systems | Life Sciences Software & Data | 🌱 Emerging Bull | +27.1% | −11.7% |
SPSC | SPS Commerce | Business Software & Automation | 🔴 Cont. Bear | +24.6% | −28.1% |
GWRE | Guidewire Software | Financial Services Software | 🔴 Cont. Bear | +22.2% | −14.6% |
TTAN | ServiceTitan | Vertical-Specific Solutions | 🔴 Cont. Bear | +19.1% | −9.0% |
SSNC | SS&C Technologies | Financial Services Software | ⚠️ Emerging Bear | +18.5% | −5.3% |
PCTY | Paylocity | HR & Workforce Management | 🔴 Cont. Bear | +17.3% | −16.1% |
NCNO | nCino | Financial Services Software | 🔴 Cont. Bear | +16.3% | −25.0% |
QTWO | Q2 | Financial Services Software | 🔴 Cont. Bear | +15.3% | −15.0% |
TOST | Toast | Point-of-Sale & Hospitality | 🔴 Cont. Bear | +14.0% | −16.3% |
TYL | Tyler Technologies | Financial Services Software | 🔴 Cont. Bear | +9.7% | −38.8% |
PEGA | Pegasystems | Low-Code & Process Automation | ⚠️ Emerging Bear | +6.8% | −35.2% |
DSGX | The Descartes Systems | Specialized Enterprise Solutions | 🔴 Cont. Bear | +5.3% | −21.5% |
BL | BlackLine | Financial Services Software | 🔴 Cont. Bear | +4.5% | −39.2% |
CRM | Salesforce | Customer Experience & CRM | 🔴 Cont. Bear | +18.6% | −15.7% |
MNDY | monday.com | Other | 🔴 Cont. Bear | +19.4% | −47.9% |
TEAM | Atlassian | Developer Tools & DevOps | 🔴 Cont. Bear | +80.7% | +4.8% |
MRNA | Moderna | RNA-Based Therapeutics | 🟢 Cont. Bull | +157.8% | +449.4% |
NIQ | NIQ Global Intelligence | Business Process & Analytics Services | 🔴 Cont. Bear | +70.5% | +8.1% |
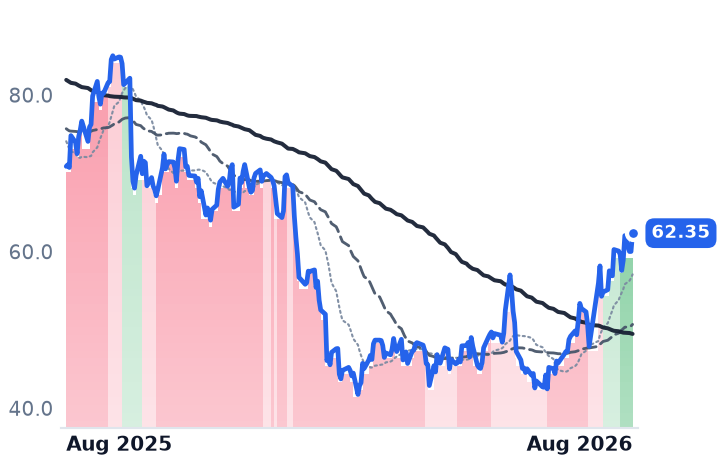
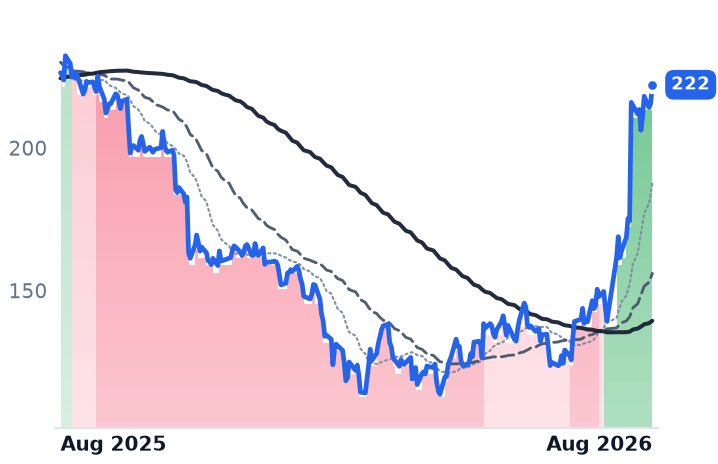
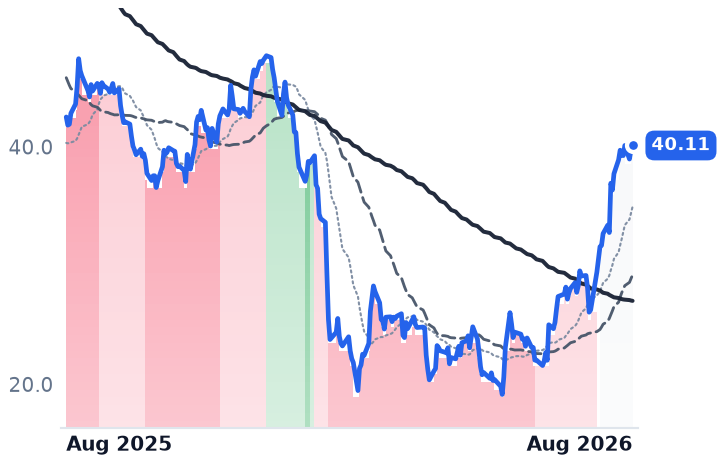
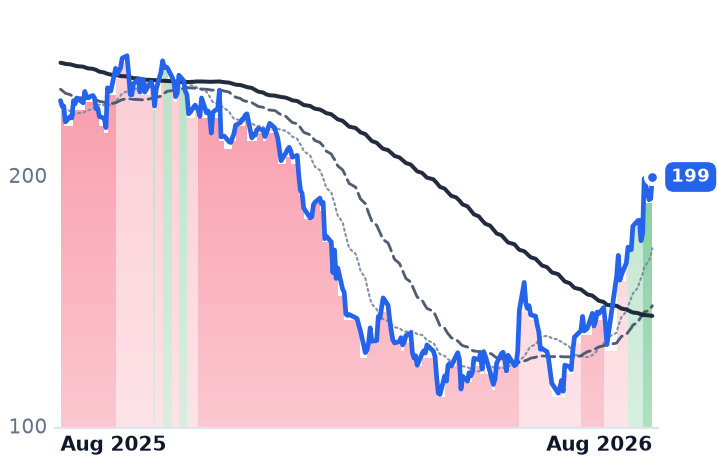
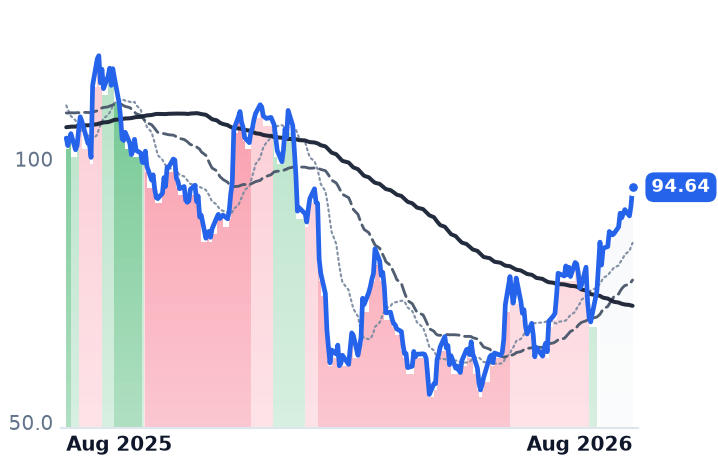
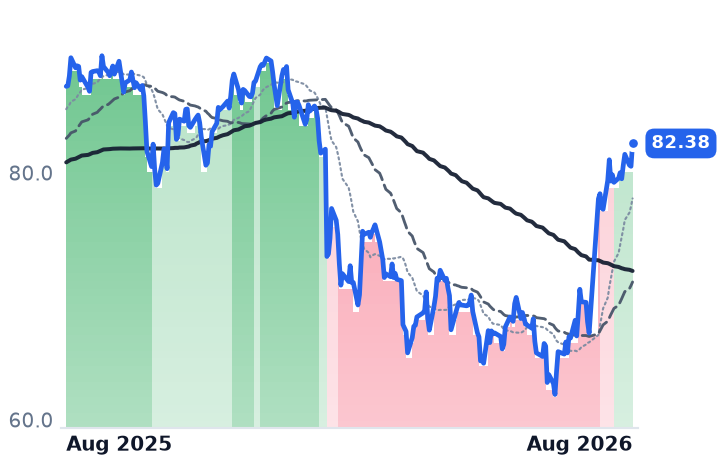
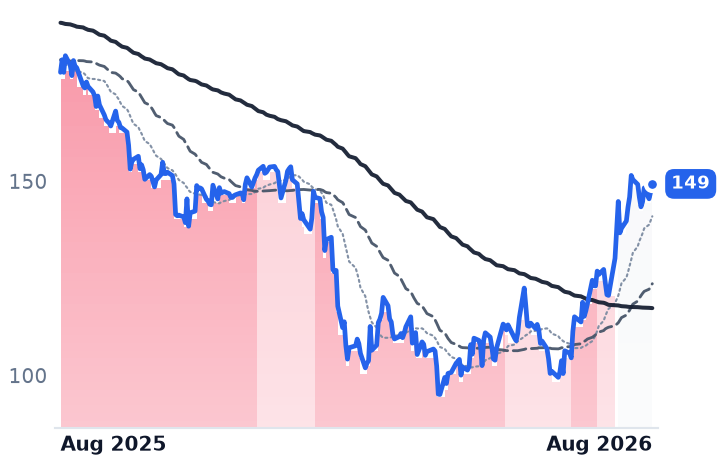
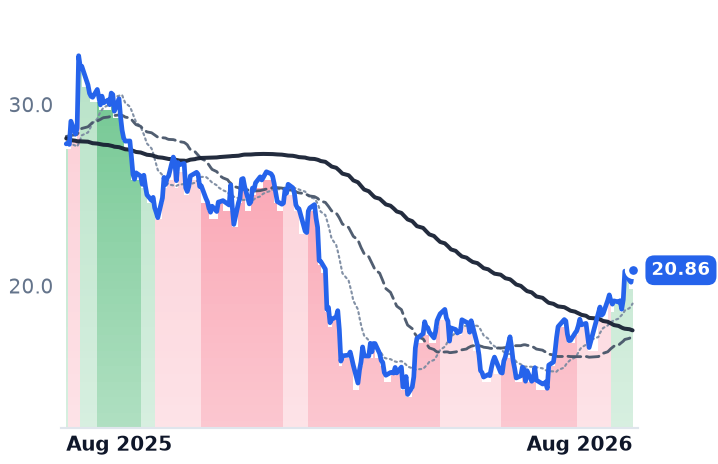
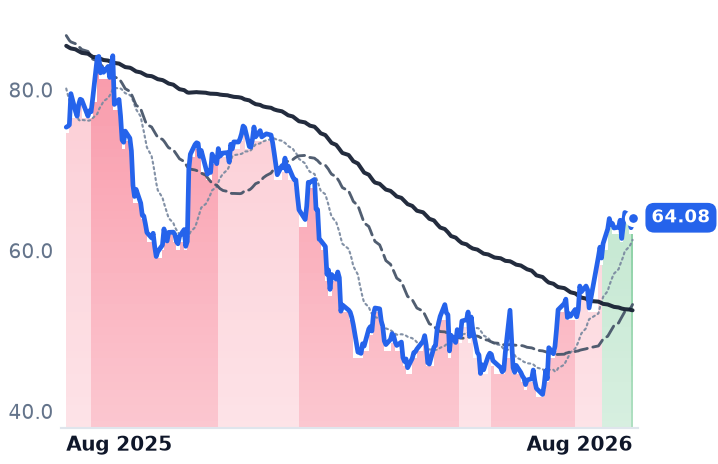
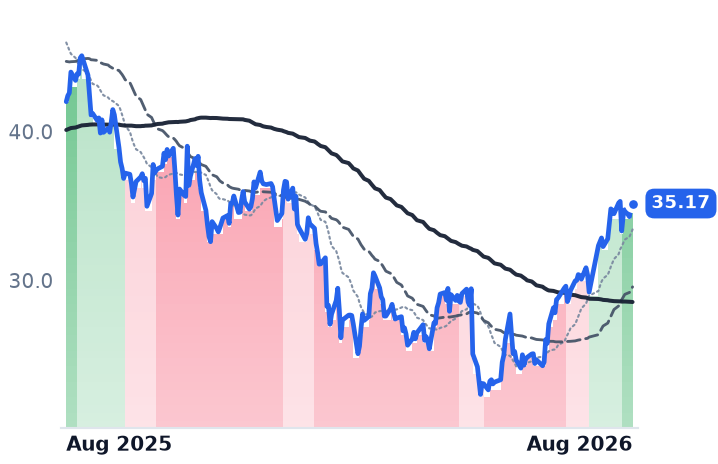
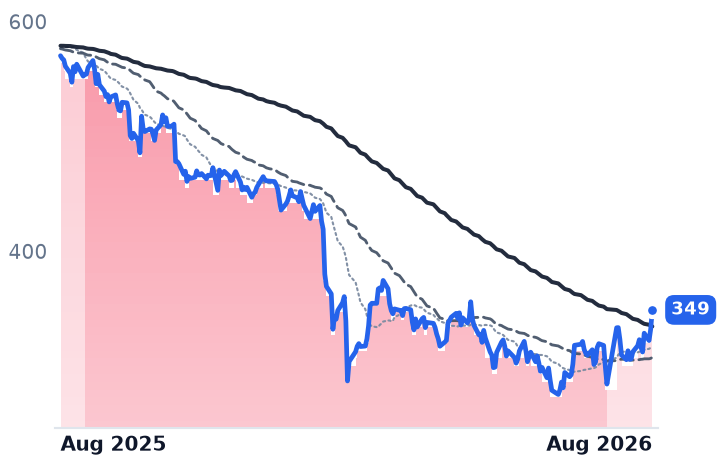
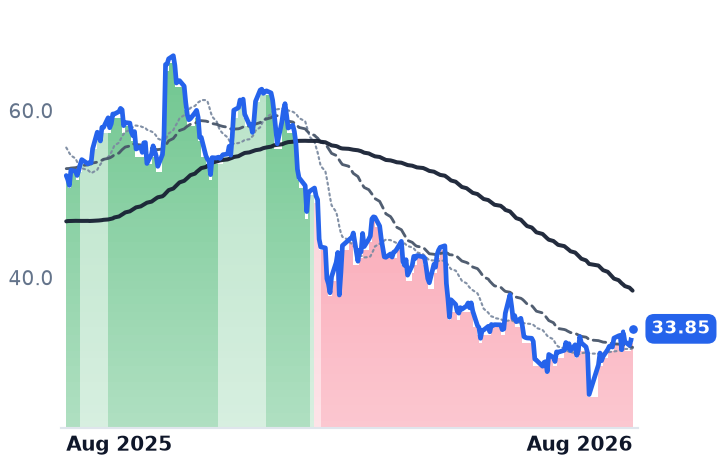
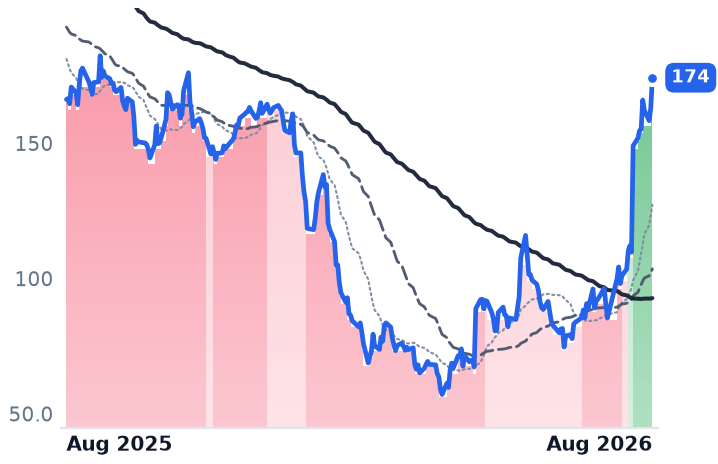
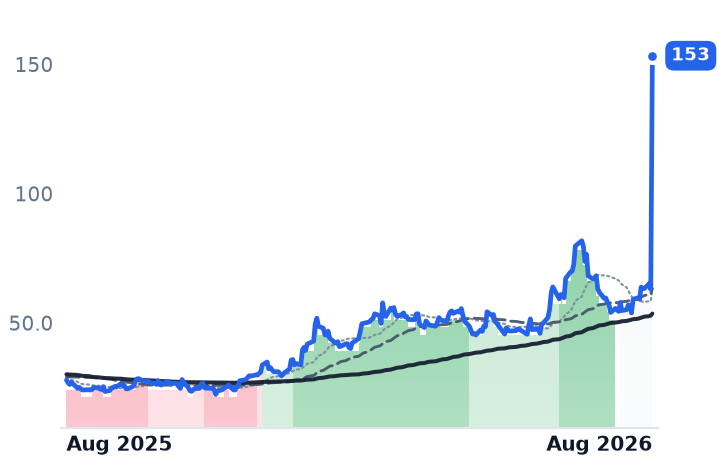
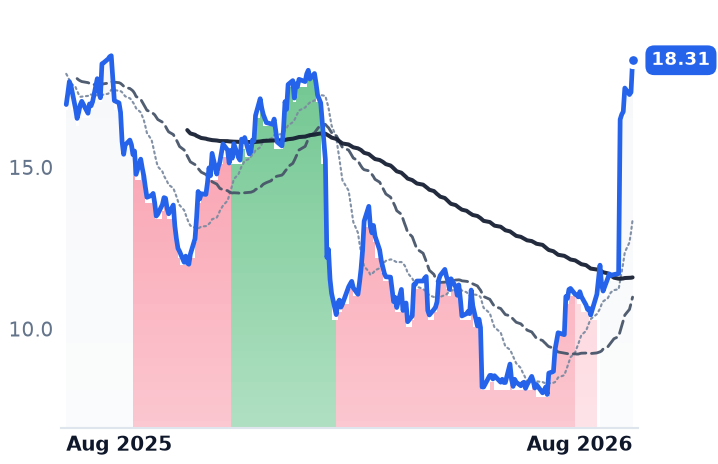
12-month price & trend
| Ticker | Mkt cap | P/E | P/E fwd | P/S | P/S fwd | P/GP | P/GP fwd | EV/EBITDA | FCF yld |
|---|---|---|---|---|---|---|---|---|---|
MANH | $12.0B | 58.5x | 37.5x | 10.7x | 10.3x | 19.5x | 18.9x | 41.0x | 3.3% |
BSY | $10.5B | 39.0x | 26.1x | 6.6x | 6.2x | 8.0x | 7.5x | 23.1x | 4.7% |
APPF | $7.7B | 48.8x | 31.2x | 7.4x | 6.8x | 11.7x | 10.9x | 36.2x | 3.5% |
| Ticker | Mkt cap | P/E | P/E fwd | P/S | P/S fwd | P/GP | P/GP fwd | EV/EBITDA | FCF yld |
|---|---|---|---|---|---|---|---|---|---|
NOW | $121.7B | 73.1x | 28.9x | 8.3x | 7.5x | 11.0x | 10.0x | 36.6x | 3.8% |
DOCU | $11.5B | 38.4x | 13.3x | 3.5x | 3.3x | 4.4x | 4.1x | 17.2x | 9.7% |
PAYC | $10.0B | 23.6x | 18.6x | 4.7x | 4.5x | 5.8x | 5.7x | 12.0x | 7.5% |
| Ticker | Mkt cap | P/E | P/E fwd | P/S | P/S fwd | P/GP | P/GP fwd | EV/EBITDA | FCF yld |
|---|---|---|---|---|---|---|---|---|---|
INTA | $1.6B | n/m | 17.0x | 2.9x | 2.8x | 3.9x | 3.7x | n/m | 7.5% |
WDAY | $47.1B | 55.8x | 16.7x | 4.8x | 4.4x | 6.3x | 5.8x | 30.0x | 6.3% |
WK | $2.7B | 189.9x | 16.3x | 2.9x | 2.6x | 3.6x | 3.2x | 95.9x | 6.5% |
| Ticker | Mkt cap | P/E | P/E fwd | P/S | P/S fwd | P/GP | P/GP fwd | EV/EBITDA | FCF yld |
|---|---|---|---|---|---|---|---|---|---|
VEEV | $39.4B | 42.1x | 26.8x | 11.9x | 10.8x | 15.9x | 14.4x | 29.0x | 4.2% |
SPSC | $2.8B | 36.7x | 15.7x | 3.6x | 3.5x | 5.1x | 5.0x | 14.1x | 7.2% |
GWRE | $11.1B | 58.3x | 37.0x | 8.2x | 7.7x | 12.9x | 12.0x | 57.6x | 2.8% |
| Ticker | Mkt cap | P/E | P/E fwd | P/S | P/S fwd | P/GP | P/GP fwd | EV/EBITDA | FCF yld |
|---|---|---|---|---|---|---|---|---|---|
TTAN | $5.6B | n/m | 45.5x | 5.8x | 5.0x | 8.3x | 7.1x | n/m | 1.5% |
SSNC | $15.6B | 19.3x | 9.3x | 2.4x | 2.3x | 5.1x | 4.8x | 10.6x | 11.0% |
PCTY | $8.0B | 29.9x | 16.9x | 4.5x | 4.2x | 6.5x | 6.1x | 15.7x | 5.6% |
| Ticker | Mkt cap | P/E | P/E fwd | P/S | P/S fwd | P/GP | P/GP fwd | EV/EBITDA | FCF yld |
|---|---|---|---|---|---|---|---|---|---|
NCNO | $2.0B | 143.2x | 14.6x | 3.3x | 3.2x | 5.5x | 5.2x | 31.5x | 5.4% |
QTWO | $4.0B | 43.7x | 22.2x | 4.8x | 4.6x | 8.4x | 8.0x | 27.4x | 5.0% |
TOST | $19.9B | 41.3x | 24.8x | 2.9x | 2.7x | 11.0x | 10.0x | 35.1x | 2.9% |
| Ticker | Mkt cap | P/E | P/E fwd | P/S | P/S fwd | P/GP | P/GP fwd | EV/EBITDA | FCF yld |
|---|---|---|---|---|---|---|---|---|---|
TYL | $12.8B | 41.0x | 23.9x | 5.3x | 5.1x | 11.3x | 11.0x | 28.0x | 5.6% |
PEGA | $5.6B | 17.8x | 13.8x | 3.2x | 3.0x | 4.2x | 3.9x | 27.7x | 9.0% |
DSGX | $5.8B | 35.4x | 29.2x | 8.0x | 7.2x | 10.7x | 9.7x | 17.7x | 4.5% |
| Ticker | Mkt cap | P/E | P/E fwd | P/S | P/S fwd | P/GP | P/GP fwd | EV/EBITDA | FCF yld |
|---|---|---|---|---|---|---|---|---|---|
BL | $1.6B | 60.9x | 11.0x | 2.2x | 2.1x | 3.0x | 2.8x | 19.3x | 10.3% |
CRM | $160.7B | 22.6x | 13.9x | 3.8x | 3.5x | 4.8x | 4.5x | 13.8x | 9.1% |
MNDY | $4.7B | 39.8x | 20.3x | 3.6x | 3.2x | 4.1x | 3.6x | 51.1x | 6.4% |
| Ticker | Mkt cap | P/E | P/E fwd | P/S | P/S fwd | P/GP | P/GP fwd | EV/EBITDA | FCF yld |
|---|---|---|---|---|---|---|---|---|---|
TEAM | $44.8B | n/m | 28.0x | 6.8x | 6.1x | 8.0x | 7.2x | 296.5x | 2.9% |
MRNA | $19.5B | n/m | — | 8.7x | 9.3x | — | — | n/m | -8.1% |
NIQ | $5.2B | n/m | 17.8x | 1.2x | 1.2x | 2.3x | 2.2x | 12.1x | 7.7% |
Consensus projections
| Ticker | FY2026E | FY2027E | FY2028E | |
|---|---|---|---|---|
MANH | Revenue | +8.2% | +8.5% | +8.9% |
| EPS | +10.3% | +11.5% | +15.7% | |
BSY | Revenue | +13.9% | +10.3% | +10.7% |
| EPS | +16.6% | +11.7% | +8.6% | |
APPF | Revenue | +18.5% | +17.3% | +17.8% |
| EPS | +33.8% | +22.1% | +24.5% | |
NOW | Revenue | +22.4% | +18.7% | +18.6% |
| EPS | +17.1% | +23.2% | +21.4% | |
DOCU | Revenue | +8.4% | +8.9% | +7.6% |
| EPS | +6.9% | +19.5% | +12.6% | |
PAYC | Revenue | +7.6% | +7.1% | +8.5% |
| EPS | +29.5% | +15.1% | +10.5% | |
INTA | Revenue | +14.7% | +14.1% | +14.6% |
| EPS | +36.9% | +25.7% | +26.0% | |
WDAY | Revenue | +13.4% | +11.8% | +11.0% |
| EPS | +26.5% | +18.5% | +17.3% | |
WK | Revenue | +17.9% | +15.6% | +17.5% |
| EPS | +77.9% | +20.3% | +33.4% | |
VEEV | Revenue | +16.3% | +15.1% | +12.0% |
| EPS | +22.7% | +14.1% | +10.7% | |
SPSC | Revenue | +5.1% | +6.4% | +7.5% |
| EPS | +17.9% | +8.9% | +13.3% | |
GWRE | Revenue | +21.9% | +15.8% | +15.1% |
| EPS | +43.5% | +21.2% | +26.6% | |
TTAN | Revenue | +24.9% | +17.3% | +14.1% |
| EPS | +424.0% | +37.7% | +25.3% | |
SSNC | Revenue | +8.2% | +5.1% | +4.1% |
| EPS | +14.0% | +8.8% | +5.3% | |
PCTY | Revenue | +11.1% | +7.5% | +7.6% |
| EPS | +15.4% | +9.0% | +9.7% | |
NCNO | Revenue | +9.8% | +8.7% | +8.9% |
| EPS | +25.2% | +40.7% | +17.3% | |
QTWO | Revenue | +11.8% | +10.1% | +10.5% |
| EPS | +22.9% | +20.7% | +43.5% | |
TOST | Revenue | +21.7% | +18.3% | +17.4% |
| EPS | +34.7% | +24.7% | +24.2% | |
TYL | Revenue | +6.7% | +10.1% | +9.3% |
| EPS | +14.7% | +17.5% | +14.3% | |
PEGA | Revenue | +8.8% | +9.2% | +8.7% |
| EPS | +18.0% | +7.8% | +6.2% | |
DSGX | Revenue | +15.0% | +9.6% | +11.0% |
| EPS | +16.1% | +24.2% | +14.3% | |
BL | Revenue | +9.5% | +10.8% | +12.3% |
| EPS | +18.7% | +13.2% | +19.6% | |
CRM | Revenue | +9.3% | +11.1% | +9.4% |
| EPS | +17.4% | +20.2% | +10.4% | |
MNDY | Revenue | +19.8% | +16.1% | +16.1% |
| EPS | +7.0% | +21.4% | +10.9% | |
TEAM | Revenue | +24.7% | +13.4% | +15.9% |
| EPS | +55.5% | +10.5% | +18.0% | |
MRNA | Revenue | +9.3% | +19.8% | +26.8% |
| EPS | +8.6% | −44.4% | −39.4% | |
NIQ | Revenue | +7.1% | +5.1% | +5.0% |
| EPS | +220.5% | +23.4% | +20.2% |
Forward fiscal years only. Blank means no analyst coverage for that year.
Three software companies whose customers are warehouse operators, civil engineers and apartment landlords each reported results in the past month, and each reported a business in better shape than a year ago. The market has since behaved as though only one of them had news.
The one that got paid
Manhattan Associates, which sells warehouse-management and order-management software to retailers, grocers and third-party logistics firms, has now re-accelerated for four straight quarters: revenue growth of 3.4%, then 5.7%, 7.4% and 9.3% year over year, the last on revenue of $297.8m. Cloud subscription revenue rose 26% and remaining performance obligations — contracted revenue not yet recognized — reached $2.47bn, up 23%. The optical drag is the shrinking perpetual-license line; excluding it, revenue rose 13%. Conversions of on-premise customers account for more than 40% of new cloud bookings, which matters in a warehouse-software market worth roughly $4.77bn where the top five vendors — Manhattan, Blue Yonder, Körber, Oracle and SAP — hold only 25–30% between them.
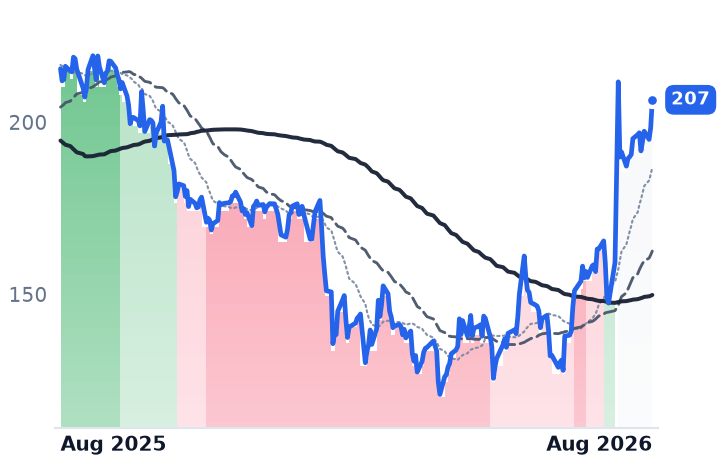
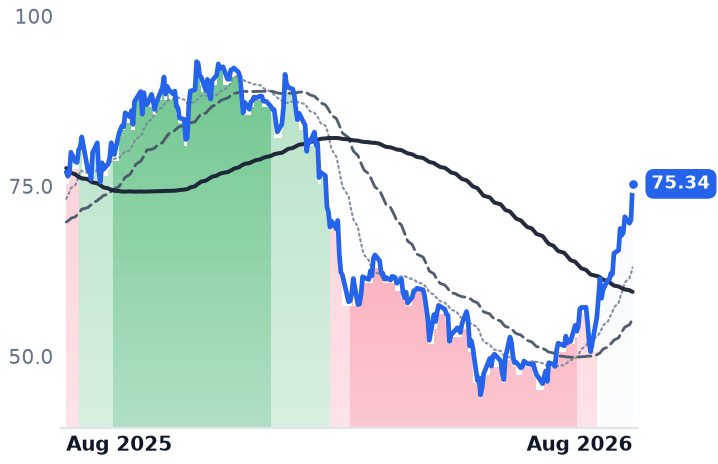
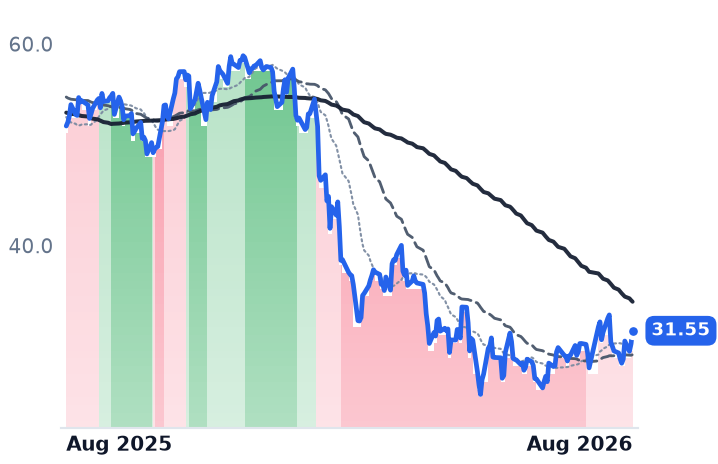
The shares went from $159.29 on July 27 to $211.74 on July 29. They have drifted 2.5% lower since. That leaves Manhattan 71% above its April low, 5.8% under its 52-week high, at 37.5x forward earnings against 58.5x trailing and 18.9x forward gross profit — the dearest of the three on every lens, while reported gross margin fell to 53.2% from 56.8% and GAAP operating income declined 10.2%. Consensus has revenue growing 8.2% this year and 8.5% next, below the 9.3% just posted. Nothing further is priced in the estimates; a good deal is priced in the stock.
The one that didn't
Bentley Systems sells the design and asset software behind roads, rail, water systems and electricity networks — MicroStation, OpenRoads, ProjectWise — competing with Autodesk, Trimble and Hexagon, with its defensible ground in large horizontal infrastructure. Annual recurring revenue reached $1.536bn, up 12% organically, with net revenue retention of 109% and account retention of 99%. Management named double-digit US backlogs in transportation, water, power and data centers, with the Power Line Systems unit driving grid work.
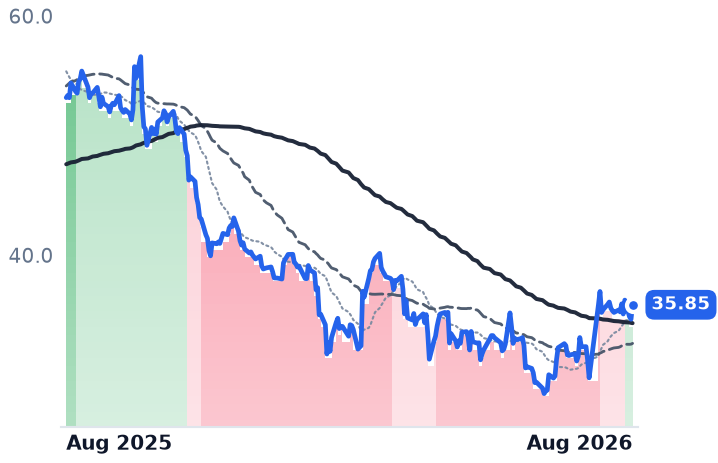
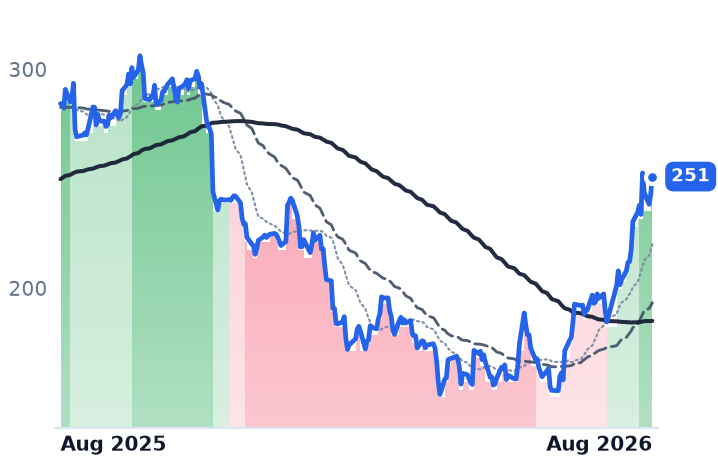
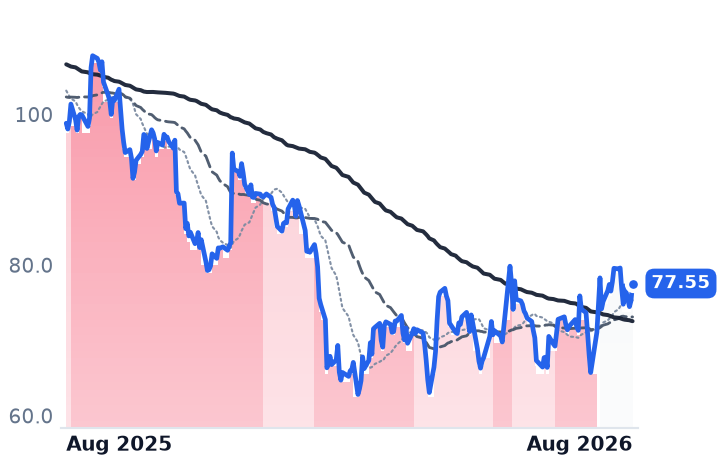
That end market is physical, not thematic. Large power transformers now carry lead times of two to five years and switchgear exceeds 60 weeks, which pulls engineering and design forward of equipment delivery. Bentley is a beneficiary of the AI buildout that is being valued as a victim of it: free cash flow of $498m over twelve months, up 15%, against 26.1x forward earnings and 7.5x forward gross profit, roughly a third of Manhattan's multiple on that measure. The stock closed at $35.84 on July 28 and $35.85 on August 19 — 37% below its 52-week high and down 32.9% over a year.
The one in between
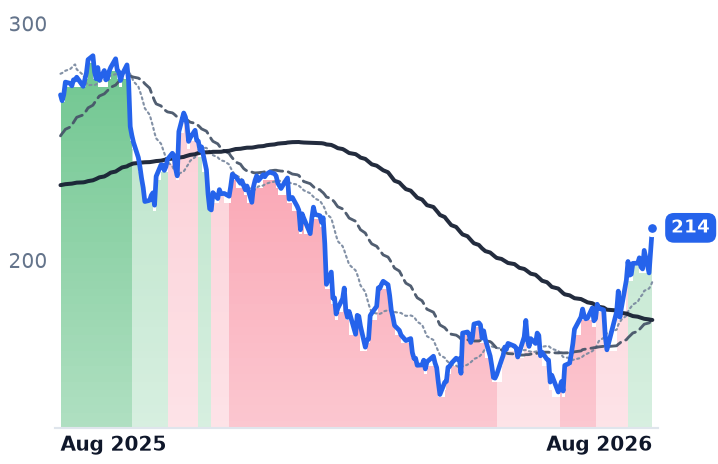
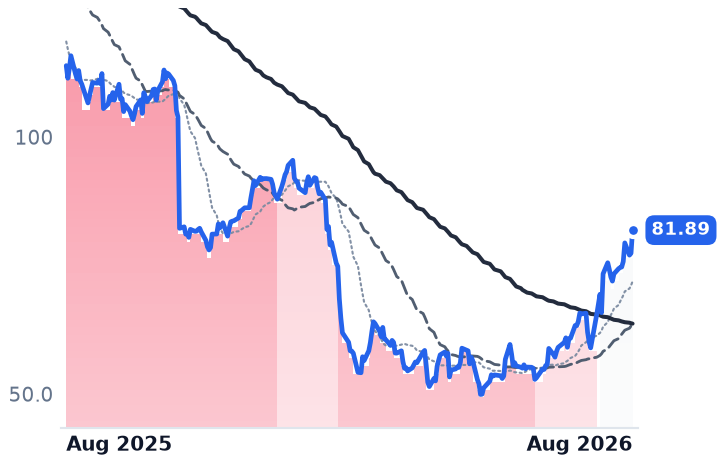
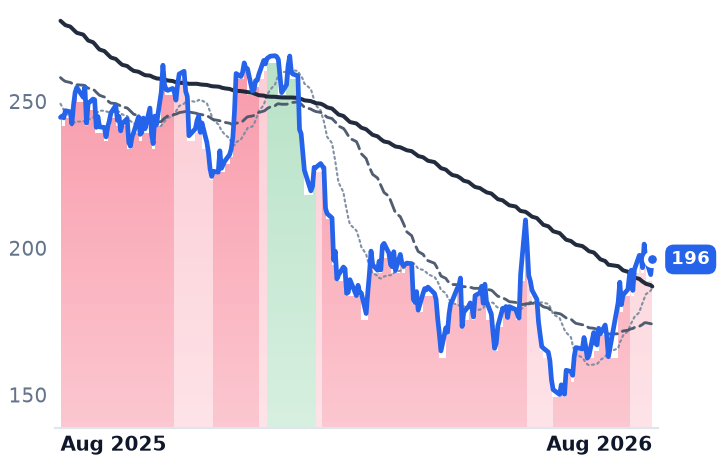
AppFolio, a cloud platform for property managers that also earns fees on tenant payments, screening and insurance, grew revenue 19% to $281m with units under management up 8% to 9.6 million and value-added services up 22% to $219m. GAAP operating margin widened to 18.8% from 17.2%, and the company lifted full-year non-GAAP operating margin guidance to 26.5–28.0% from 24.7% in 2025. The standard worry — that interest on customer funds held in transit deflates as rates fall — has the direction wrong: the Federal Reserve has left the funds rate at 3.50–3.75% for five straight meetings and cut nothing in 2026, with three dissents favoring a hike. AppFolio trades at 31.2x forward earnings and 10.9x forward gross profit, 49% above its April low.
What moved them
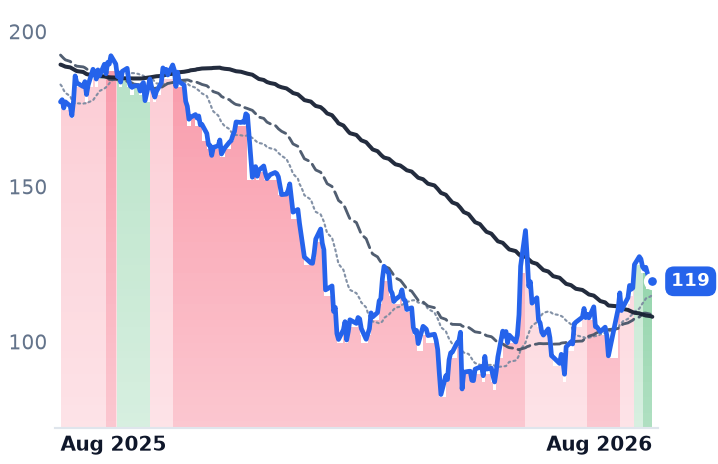
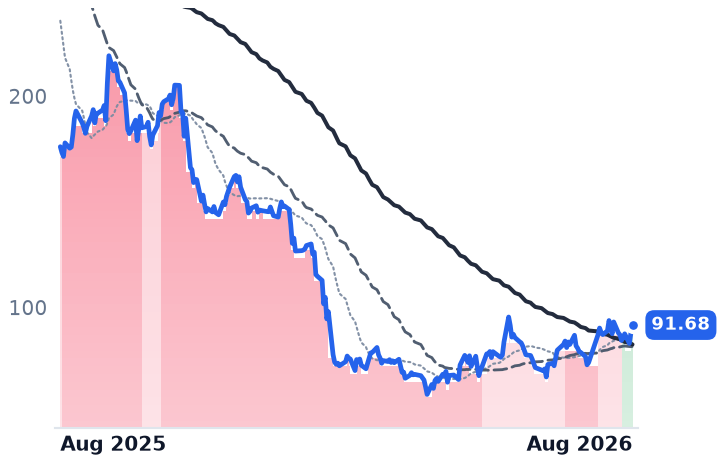
All three gains belong to two rotation windows, not to a steady re-rating. The late-July window did most of the work; on August 19 a selloff in AI hardware pushed money back into enterprise software, with ServiceNow up 6.5% and a semiconductor ETF down 2.2%. It is a rotation, not a duration trade: the 30-year Treasury yield topped 5.33% on August 18, a 19-year high, which normally works against long-dated software cash flows. Bentley and AppFolio have both turned upward on trend, their 50-day averages crossing above their 200-day on August 14 and August 4; Manhattan's remains neutral.
The setup
Where it stands — Three improving vertical-software businesses carry very different multiples: Bentley at 26.1x forward earnings, Manhattan at 37.5x near its high. Would confirm — Bentley's Q3 annual recurring revenue growth holding at or above 12% with net revenue retention at 109% or better. Would invalidate — Manhattan's remaining performance obligations growing below the guided 18–20% range, or Bentley's retention slipping under 105%. Watch next — Third-quarter results: Manhattan in late October, Bentley and AppFolio in early November. Valuation — Bentley 7.5x forward gross profit versus 8.0x trailing; Manhattan 18.9x forward, 19.5x trailing; AppFolio 10.9x forward.