

AI component drawdown is a multiple unwind, not a broken trend
Prompt v1.0
Vicor, Wolfspeed, Corning and Samsung Electro-Mechanics are down 40-60% from May-June peaks, but band data shows GLW and 009150.KS still in unbroken strongly bullish, VICR only slipping to mildly bullish on 20 July, and all four above their 200-day averages. Two of the scariest corroborating declines — Mueller -54% and KLA -88% — are stock-split artifacts.
| Ticker | Company | Segment | Trend · 13mo | 30D | 1Y |
|---|---|---|---|---|---|
VICR | Vicor | Other | 🟢 Cont. Bull | −40.7% | +372.8% |
WOLF | Wolfspeed | Discrete & Power | 🌱 Emerging Bull | −33.8% | +32.4% |
GLW | Corning | Display & Optical Materials | 🟢 Cont. Bull | −39.7% | +180.6% |
MLI | Mueller Industries | Copper & Brass Products | 🟢 Cont. Bull | +2.0% | −28.1% |
009150.KS | Samsung Electro-Mechanics | Hardware, Equipment & Parts | 🟢 Cont. Bull | −34.0% | +880.0% |
MPWR | Monolithic Power Systems | Analog & Mixed-Signal | 🟢 Cont. Bull | +6.7% | +90.4% |
ON | ON Semiconductor | Analog & Mixed-Signal | 🟢 Cont. Bull | +4.2% | +57.4% |
STM | STMicroelectronics | Analog & Mixed-Signal | 🟢 Cont. Bull | −12.1% | +148.8% |
APH | Amphenol | Connectors & Interconnect Systems | 🟢 Cont. Bull | −5.4% | +48.4% |
NVT | nVent Electric | Data Center Power & Thermal | 🟢 Cont. Bull | −3.0% | +101.5% |
KLAC | KLA | Semiconduct Equipment | ⚠️ Emerging Bear | −22.9% | −76.6% |
5801.T | Furukawa Electric | Electrical Equipment & Parts | 🟢 Cont. Bull | −20.2% | −56.0% |
NVDA | NVIDIA | AI & Data Center GPUs | 🟢 Cont. Bull | +8.8% | +20.0% |
MU | Micron Technology | Memory (DRAM/NAND) | 🟢 Cont. Bull | −16.2% | +763.7% |
AVGO | Broadcom | Semiconductor Subsystems | 🟢 Cont. Bull | +6.5% | +35.6% |
VRT | Vertiv | Data Center Power & Thermal | 🟢 Cont. Bull | −1.9% | +111.5% |
COHR | Coherent | Instrumentation & Test Equipment | 🟢 Cont. Bull | −20.2% | +199.3% |
LITE | Lumentum | Optical Transport & Switching | 🟢 Cont. Bull | −2.5% | +674.2% |
ANET | Arista Networks | Cloud Networking | 🟢 Cont. Bull | +6.6% | +48.8% |
ETN | Eaton | Power & Propulsion Systems | 🟢 Cont. Bull | −0.3% | +4.5% |
SPY | State Street SPDR S&P 500 ETF Trust | Asset Management | 🟢 Cont. Bull | +0.9% | +18.3% |
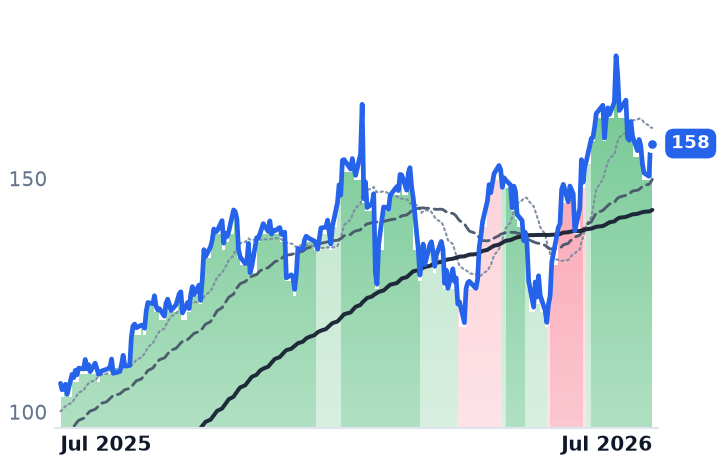
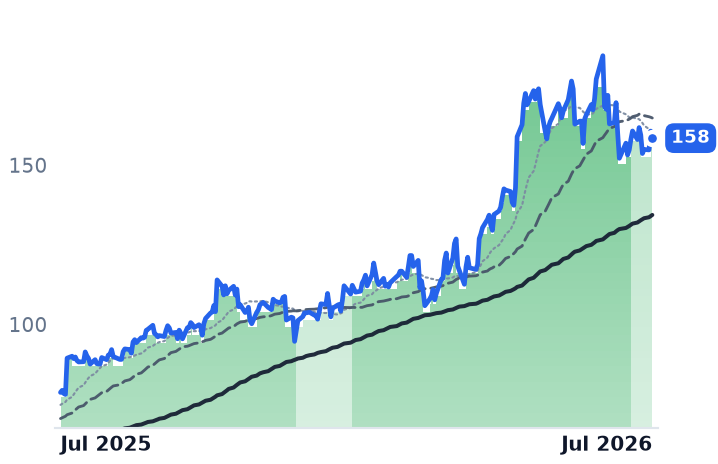
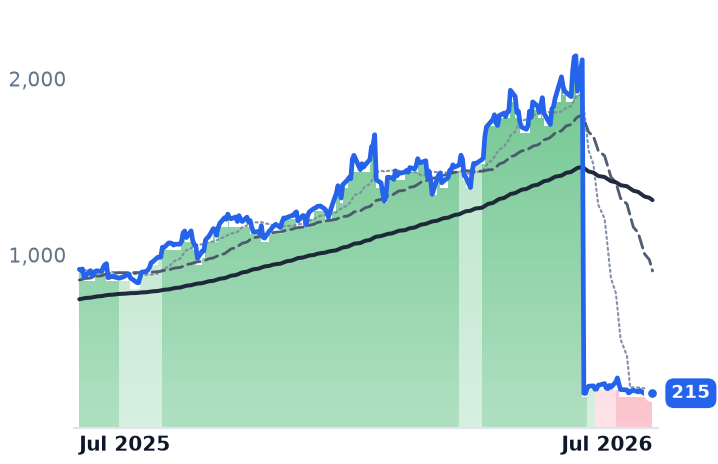
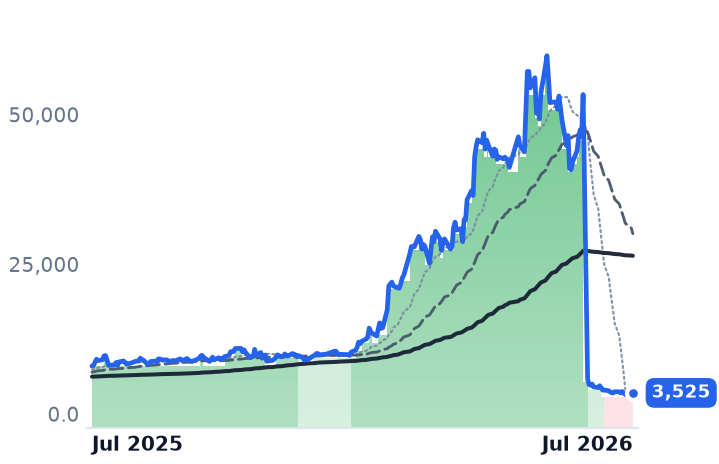
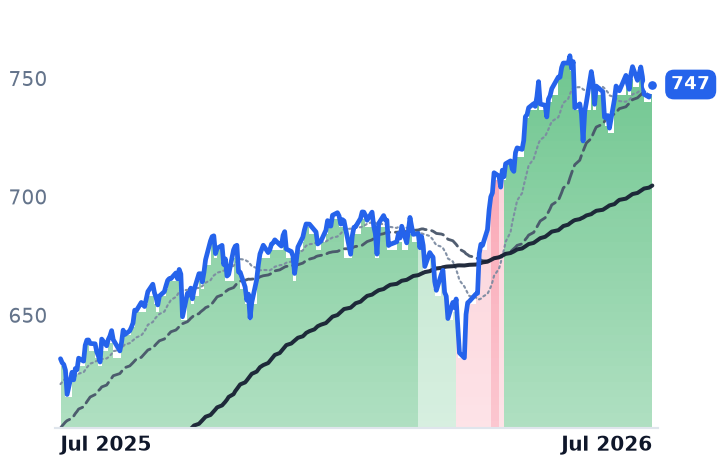
12-month price & trend
| Ticker | Mkt cap | P/E | P/E fwd | P/S | P/S fwd | P/GP | P/GP fwd | EV/EBITDA | FCF yld |
|---|---|---|---|---|---|---|---|---|---|
VICR | $11.5B | 79.7x | 74.0x | 24.3x | 19.1x | 42.9x | 33.7x | 86.8x | 0.4% |
WOLF | $1.7B | n/m | — | 2.4x | 2.6x | — | — | n/m | -43.9% |
GLW | $137.7B | 72.4x | 48.9x | 8.1x | 7.2x | 22.4x | 19.7x | 37.1x | 1.7% |
| Ticker | Mkt cap | P/E | P/E fwd | P/S | P/S fwd | P/GP | P/GP fwd | EV/EBITDA | FCF yld |
|---|---|---|---|---|---|---|---|---|---|
MLI | $14.7B | 17.0x | 16.0x | 3.2x | 2.9x | 11.6x | 10.6x | 11.2x | 2.5% |
009150.KS | $65.7T | 85.1x | 52.9x | 5.6x | 4.9x | 37.2x | 32.6x | 37.1x | 0.4% |
MPWR | $69.6B | 86.3x | 52.1x | 21.3x | 16.9x | 38.5x | 30.6x | 67.8x | 0.8% |
| Ticker | Mkt cap | P/E | P/E fwd | P/S | P/S fwd | P/GP | P/GP fwd | EV/EBITDA | FCF yld |
|---|---|---|---|---|---|---|---|---|---|
ON | $32.5B | 52.8x | 26.1x | 5.2x | 5.0x | 14.0x | 13.2x | 26.4x | 5.5% |
STM | $49.8B | 107.2x | 41.7x | 3.7x | 3.5x | 10.9x | 10.1x | 22.5x | 0.8% |
APH | $206.0B | 39.8x | 31.7x | 7.1x | 5.8x | 18.4x | 15.2x | 23.5x | 2.3% |
| Ticker | Mkt cap | P/E | P/E fwd | P/S | P/S fwd | P/GP | P/GP fwd | EV/EBITDA | FCF yld |
|---|---|---|---|---|---|---|---|---|---|
NVT | $27.3B | 55.8x | 37.0x | 6.3x | 5.5x | 17.1x | 14.9x | 31.3x | 1.4% |
KLAC | $268.8B | 55.9x | 37.5x | 19.8x | 14.8x | 32.3x | 24.2x | 47.4x | 1.4% |
5801.T | $3.2T | 61.2x | 47.7x | 2.5x | 2.3x | 14.8x | 13.7x | 36.8x | 0.0% |
| Ticker | Mkt cap | P/E | P/E fwd | P/S | P/S fwd | P/GP | P/GP fwd | EV/EBITDA | FCF yld |
|---|---|---|---|---|---|---|---|---|---|
NVDA | $5.5T | 34.3x | 25.0x | 21.5x | 13.9x | 29.0x | 18.7x | 28.3x | 2.2% |
MU | $1.0T | 19.9x | 12.2x | 11.2x | 7.8x | 15.4x | 10.7x | 14.5x | 2.6% |
AVGO | $1.8T | 61.4x | 32.8x | 24.0x | 17.1x | 35.8x | 25.6x | 44.1x | 1.8% |
| Ticker | Mkt cap | P/E | P/E fwd | P/S | P/S fwd | P/GP | P/GP fwd | EV/EBITDA | FCF yld |
|---|---|---|---|---|---|---|---|---|---|
VRT | $142.5B | 91.1x | 57.7x | 13.1x | 10.3x | 36.3x | 28.5x | 61.1x | 1.6% |
COHR | $68.7B | 80.7x | 42.0x | 9.7x | 7.1x | 25.7x | 18.9x | 53.7x | -85.8% |
LITE | $75.4B | n/m | 52.1x | 25.0x | 13.3x | 60.0x | 31.9x | n/m | 0.7% |
| Ticker | Mkt cap | P/E | P/E fwd | P/S | P/S fwd | P/GP | P/GP fwd | EV/EBITDA | FCF yld |
|---|---|---|---|---|---|---|---|---|---|
ANET | $256.4B | 63.4x | 50.6x | 24.3x | 20.6x | 38.6x | 32.7x | 49.8x | 2.0% |
ETN | $178.2B | 46.6x | 34.1x | 5.9x | 5.5x | 16.5x | 15.3x | 32.9x | 2.5% |
SPY | $773.0B | — | — | — | — | — | — | — | — |
Consensus projections
| Ticker | FY2026E | FY2027E | FY2028E | |
|---|---|---|---|---|
VICR | Revenue | +33.1% | +55.6% | +22.2% |
| EPS | +58.9% | +73.2% | +33.0% | |
WOLF | Revenue | +0.7% | −14.8% | +24.1% |
| EPS | +275.2% | −30.1% | −11.8% | |
GLW | Revenue | +17.5% | +18.7% | +21.0% |
| EPS | +29.6% | +31.7% | +36.5% | |
MLI | Revenue | +21.1% | +7.7% | +8.8% |
| EPS | +16.5% | +6.0% | +11.4% | |
009150.KS | Revenue | +19.5% | +18.9% | +19.0% |
| EPS | +92.3% | +53.9% | +30.8% | |
MPWR | Revenue | +47.9% | +26.0% | +13.5% |
| EPS | +53.3% | +28.2% | +13.2% | |
ON | Revenue | +9.2% | +12.9% | +13.5% |
| EPS | +37.1% | +41.7% | +31.7% | |
STM | Revenue | +22.4% | +18.7% | +13.2% |
| EPS | +104.2% | +98.3% | +45.6% | |
APH | Revenue | +54.2% | +17.7% | +12.2% |
| EPS | +59.4% | +22.0% | +13.0% | |
NVT | Revenue | +29.7% | +14.7% | +13.2% |
| EPS | +36.9% | +22.2% | +16.5% | |
KLAC | Revenue | +12.2% | +33.9% | +19.0% |
| EPS | +14.5% | +47.8% | +21.0% | |
5801.T | Revenue | +8.8% | +5.9% | +10.2% |
| EPS | +84.6% | +27.5% | +33.6% | |
NVDA | Revenue | +65.1% | +84.2% | +43.2% |
| EPS | +59.0% | +91.7% | +42.0% | |
MU | Revenue | +248.0% | +92.8% | +11.4% |
| EPS | +804.9% | +111.2% | +7.9% | |
AVGO | Revenue | +66.6% | +65.5% | +33.9% |
| EPS | +71.7% | +68.7% | +33.7% | |
VRT | Revenue | +35.2% | +25.8% | +19.4% |
| EPS | +55.6% | +33.8% | +25.8% | |
COHR | Revenue | +21.9% | +37.7% | +38.2% |
| EPS | +55.9% | +53.4% | +58.4% | |
LITE | Revenue | +83.9% | +89.0% | +54.6% |
| EPS | +314.0% | +125.9% | +58.9% | |
ANET | Revenue | +40.0% | +27.7% | +21.9% |
| EPS | +39.6% | +25.5% | +23.9% | |
ETN | Revenue | +18.5% | +10.9% | +8.9% |
| EPS | +11.6% | +18.3% | +16.9% |
Forward fiscal years only. Blank means no analyst coverage for that year.
What the tape actually says
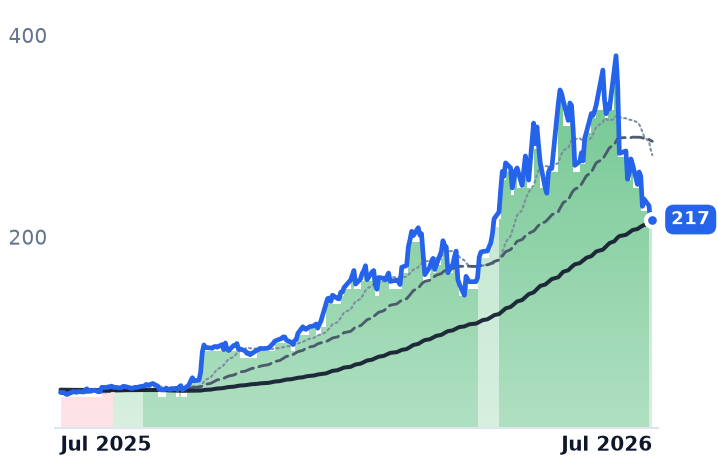
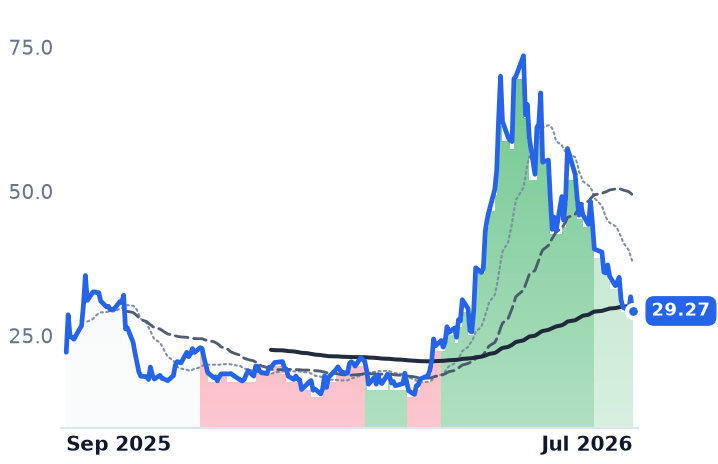
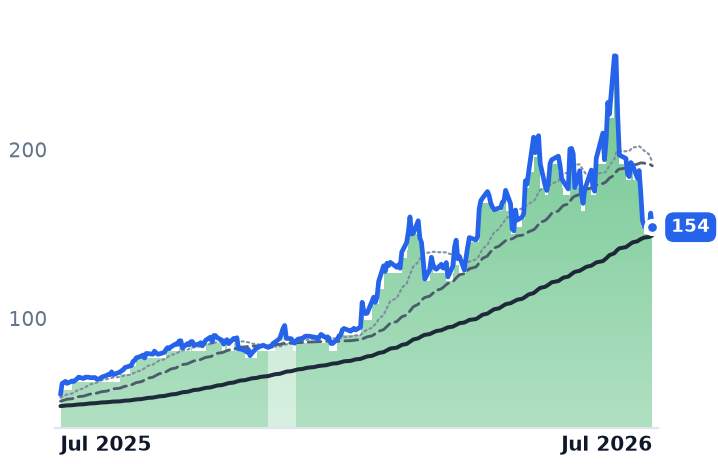
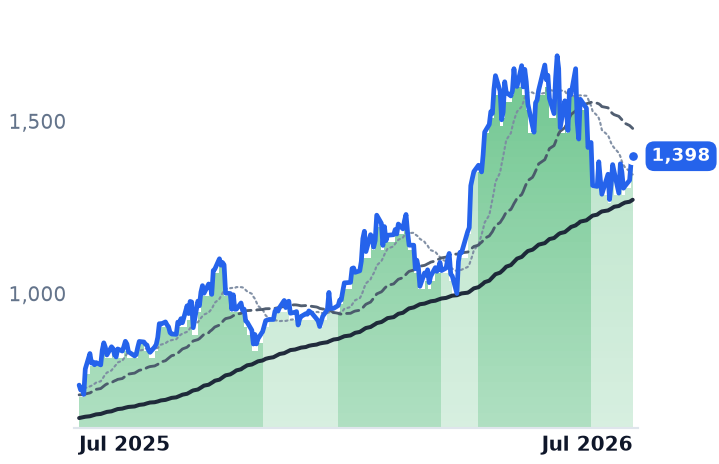
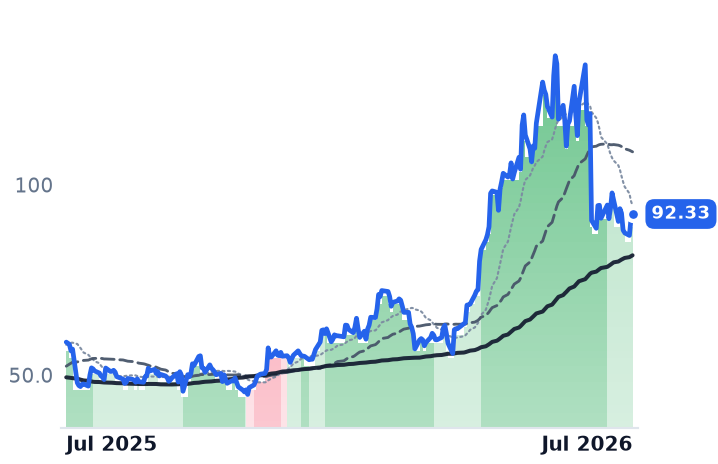
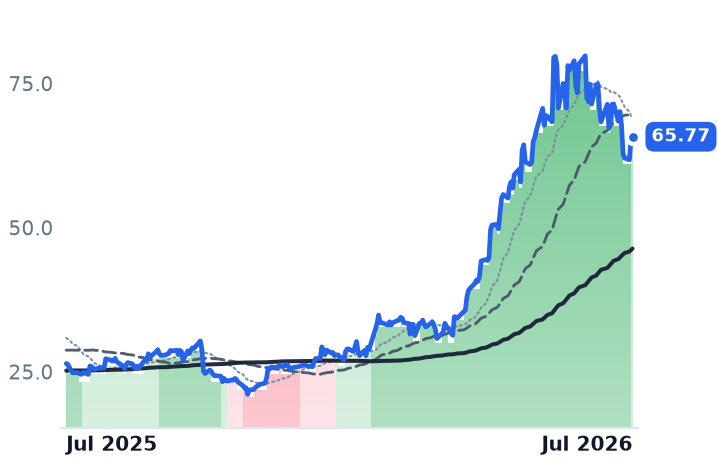
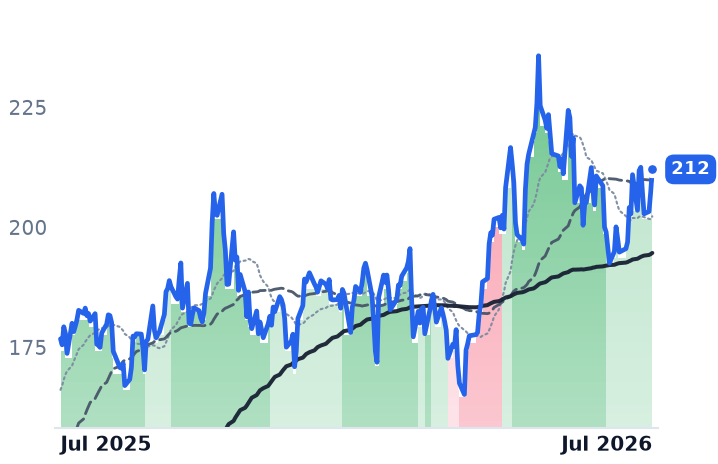
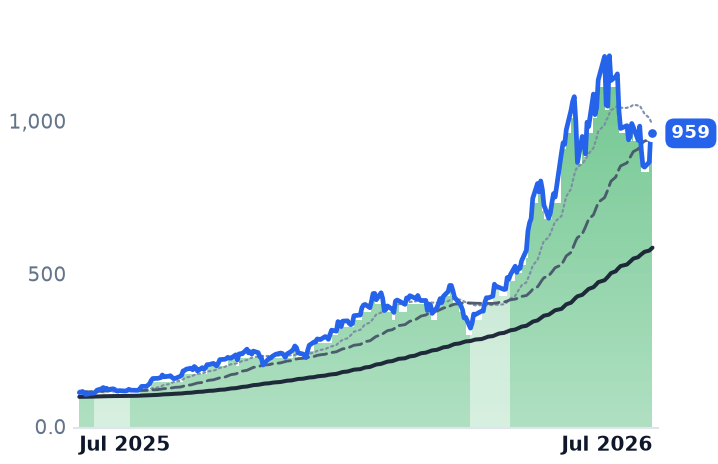
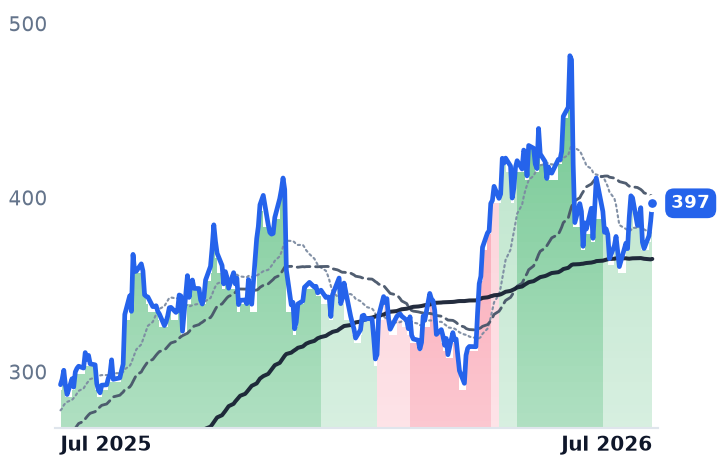
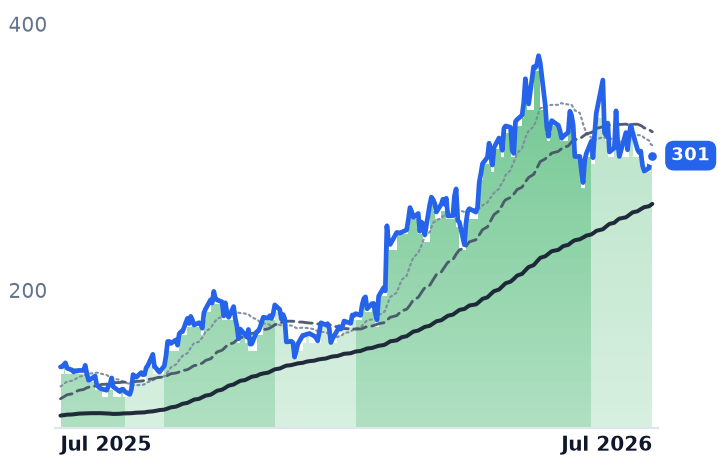
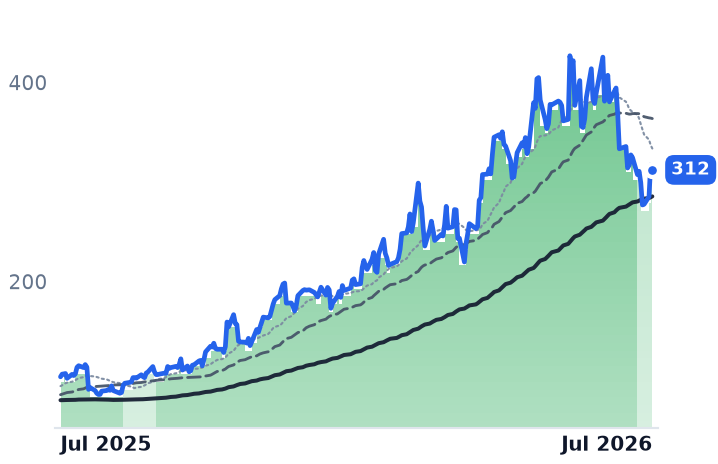
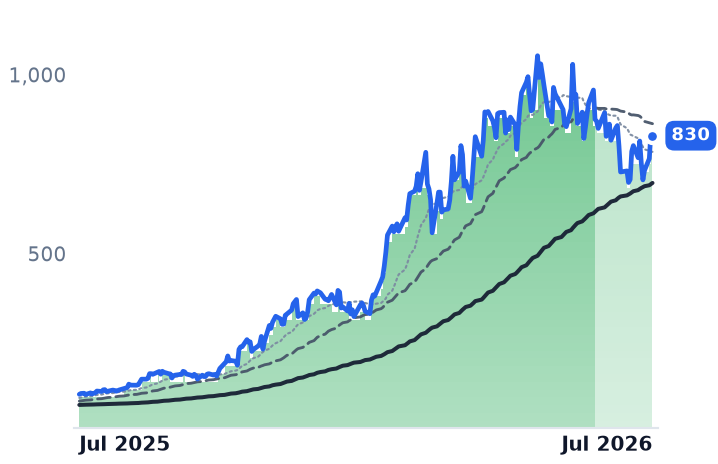
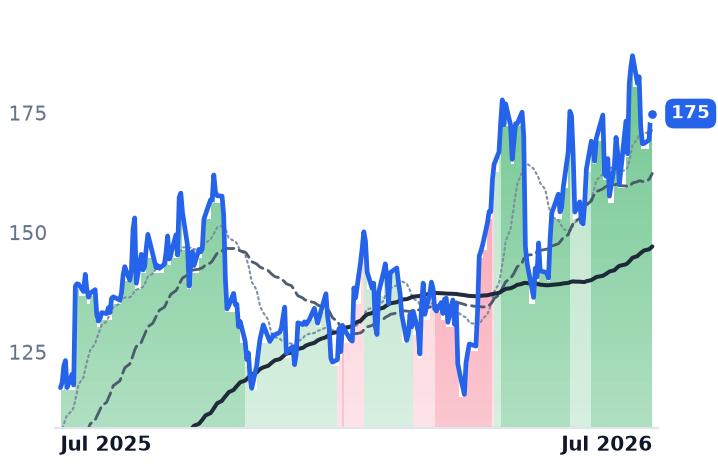
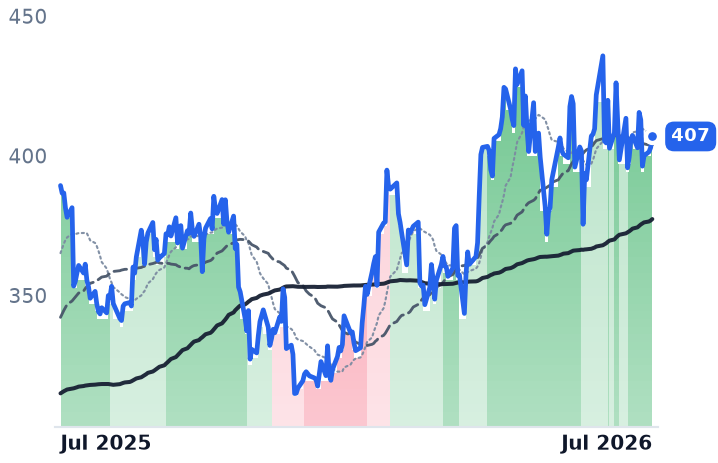
The drawdown is real and it is deep. Measured peak-to-22-July, WOLF is -60.2% (peak 26 May), VICR -42.8% (30 June), 009150.KS -40.7% (19 June) and GLW -39.7% (29 June), against ON -31.1%, STM -17.7%, MPWR -17.2%, NVT -14.0% and APH -10.7%. But it is not confined to second-tier components: COHR -26.9%, LITE -21.2%, MU -20.9%, VRT -20.0%, AVGO -17.6% and NVDA -10.0% are all off post-May highs while SPY is only -1.6%. The dated trigger is the semiconductor sell-off that began 1 July, when Micron shed ~13% and ~$138B of value on reports SK Hynix was slowing HBM capacity expansion, alongside AI-ROI skepticism and a hawkish Fed.
The trend-band evidence cuts directly against the "early leg of a downtrend" reading. GLW and 009150.KS have been in unbroken strongly bullish bands since at least 2 February; WOLF has been mildly bullish since 2 July; VICR only downgraded strongly bullish to mildly bullish on 20 July, three sessions before the latest data. All five names remain above their approximate 200-day averages, and on longer horizons the cohort is still up hard — 009150.KS +98% over three months and +893% over twelve, VICR +381% over twelve.
Two corroborators are data artifacts
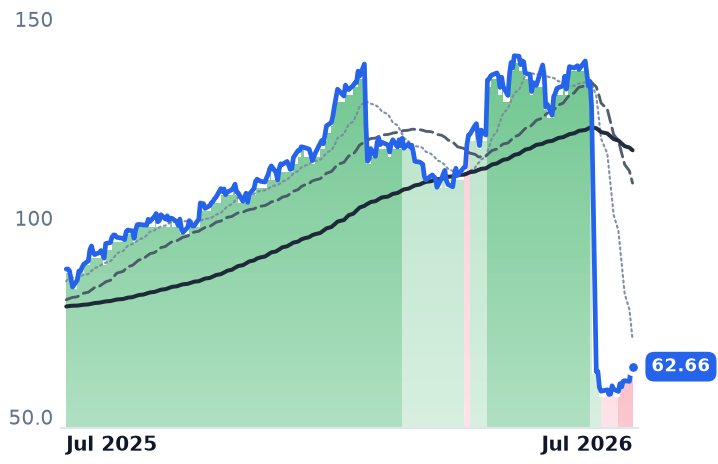
Mueller's -54% is a two-for-one split that began split-adjusted trading on 1 July; adjusted, MLI is roughly -7% over three months, and its strongly bearish band flip is split-contaminated. KLAC's -88% is a ten-for-one split effective 12 June and Furukawa's -91% a 10-for-1 split effective 1 July. Copper offers no help either — LME cash was about 4.5% below early-June levels in early July.
Multiples, not demand
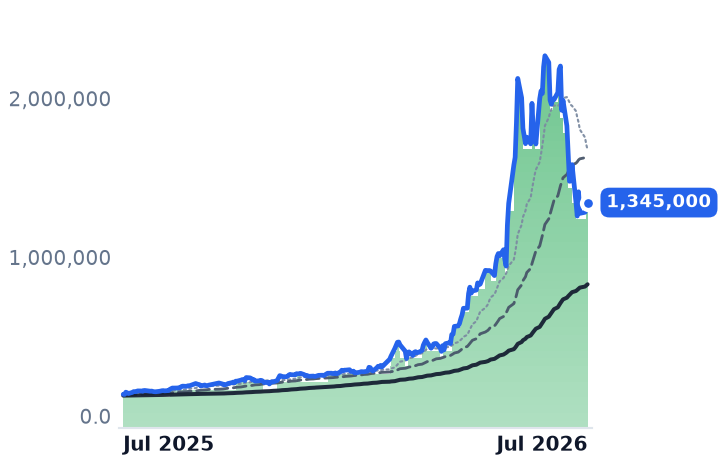
Going in, GLW traded at 106x trailing earnings and VICR at 109x and 35x sales. Vicor's Q2 was an operational beat — revenue $143.4M, +49% YoY, 58% gross margin, backlog +26% sequentially — yet shares slipped because ~$15M of one-time royalty revenue flattered margin and the first CHiP fab is nearing full utilization. Corning fell 13.3% on 1 July with no demand news after a Q1 that showed core sales +18% and Optical +36% YoY; its Q2 guide of ~$4.6B and a 28 July print both postdate the sell-off. onsemi does not report until 3 August, so its -31% carries no guidance cut. In Korea, Hana kept a ₩3,000,000 target versus a ₩1,345,000 close on persistent MLCC/FCBGA tightness — and that leg had its own earlier shakeout on 2 June.
Only Wolfspeed shows genuine fundamental damage: -27% GAAP gross margin and Q4 revenue guided to $140-160M, with July declines tied to chip-sector weakness and share-supply overhang and a Chinese SiC price war that long predates July. Two hypothesised drivers behave differently than assumed: DDR5 up 7% in July and ~448% YoY is a real margin tax on hardware, but NVIDIA's 800 VDC reference architecture names a dozen silicon and power partners — it widens the supplier set rather than in-sourcing it. VICR's slide did come on rising volume (1.76M shares on 21 July versus 500-900k typical in June), the one distribution-flavoured detail in the pack.