

Omnicom's 6.1% Organic Growth Counts $1.5bn of Media Costs WPP Excludes
Hypothesis Opus 5 · Research Opus 5 · Writing Opus 5 · Prompt v1.6
Three advertising holding companies reported within nine days of each other and each measured its own growth against a different definition of revenue — so the numbers investors compare are not comparable. WPP strips a quarter of its headline revenue out as pass-through money before calling anything growth; Stagwell strips about a fifth; Omnicom strips nothing.
Only one of the three is actually shrinking. WPP's first-half revenue less pass-through fell 4.7% like-for-like, with the media arm at -5.4%, while Stagwell grew organic net revenue 5% and raised adjusted earnings guidance to $1.17 a share. With global ad spend forecast to grow past $1trn this year, WPP's contraction is accounts moving to named rivals, not a soft market. The share prices have only just started to tell these three apart.
| Ticker | Company | Segment | Trend · 13mo | 30D | 1Y |
|---|---|---|---|---|---|
| The subject · what this brief is about | |||||
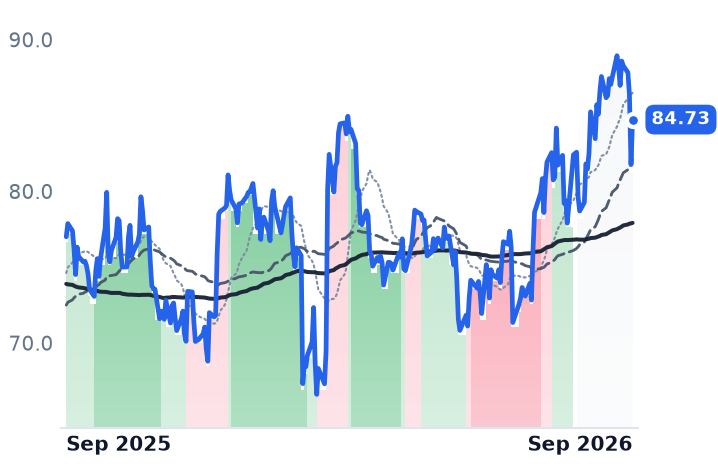
OMC | Omnicom | Full-Service Creative Agencies | ⚠️ Emerging Bear | +4.0% | +10.0% |
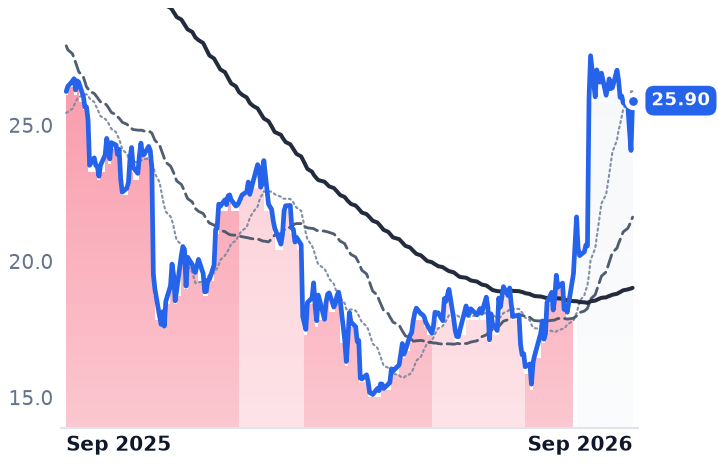
WPP | WPP | Full-Service Creative Agencies | 🔴 Cont. Bear | +25.9% | −1.3% |
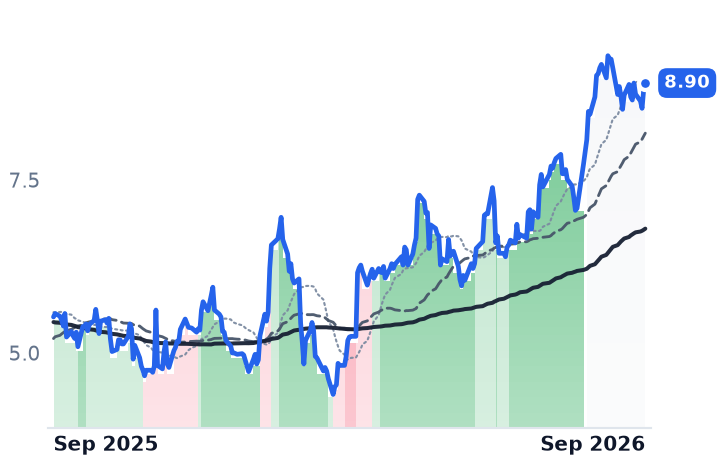
STGW | Stagwell | Full-Service Creative Agencies | 🟢 Cont. Bull | −1.5% | +61.2% |
| Compared against · context, not the story | |||||
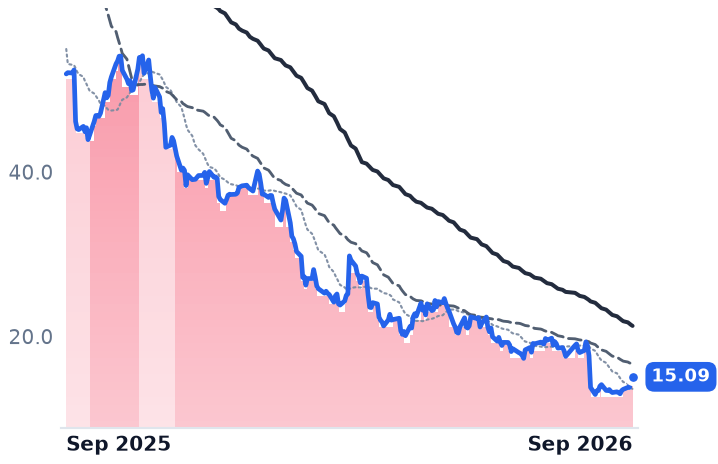
TTD | The Trade Desk | Programmatic Ad Platforms | 🔴 Cont. Bear | −20.2% | −70.9% |
12-month price & trend
| Ticker | Mkt cap | P/E | P/E fwd | P/S | P/S fwd | P/GP | P/GP fwd | EV/EBITDA | FCF yld |
|---|---|---|---|---|---|---|---|---|---|
OMC | $23.2B | 45.3x | 8.1x | 1.0x | 0.9x | 5.9x | 5.1x | 18.0x | 10.3% |
WPP | $5.6B | n/m | 7.3x | 0.3x | 0.4x | 1.9x | 2.7x | 5.1x | 24.9% |
STGW | $2.2B | 137.3x | 8.0x | 0.7x | 0.7x | 2.1x | 2.0x | 11.2x | 11.2% |
| Ticker | Mkt cap | P/E | P/E fwd | P/S | P/S fwd | P/GP | P/GP fwd | EV/EBITDA | FCF yld |
|---|---|---|---|---|---|---|---|---|---|
TTD | $6.5B | 16.4x | 34.2x | 2.2x | 2.3x | 2.6x | 2.8x | 7.2x | 13.3% |
Consensus projections
| Ticker | FY2026E | FY2027E | FY2028E | |
|---|---|---|---|---|
OMC | Revenue | +59.2% | −3.3% | +3.8% |
| EPS | +20.1% | +13.5% | +13.0% | |
WPP | Revenue | −3.8% | +0.1% | +1.6% |
| EPS | −14.0% | +6.0% | +7.6% | |
STGW | Revenue | +12.1% | +2.6% | +13.1% |
| EPS | +38.2% | +10.7% | +31.3% | |
TTD | Revenue | −4.6% | −4.5% | +9.5% |
| EPS | −52.9% | −41.3% | +87.1% |
Forward fiscal years only. Blank means no analyst coverage for that year.
Omnicom said on 28 July that organic revenue from its core operations grew 6.1% in the second quarter, and raised its full-year growth target to 5% from a range of 4% to 4.5%. Nine days later WPP reported that its revenue less pass-through costs had fallen 4.7% on a like-for-like basis in the first half. The two figures are not opposites, because the two companies do not measure the same thing.
What separates them is money that passes through an agency on its way to a media owner. WPP, the London group behind media buying arm WPP Media and a stable of creative and public relations brands, reported £6,373m of first-half revenue and £4,745m after pass-through costs — £1,628m, or 25.5% of the headline line, never touches the fee base. Stagwell, the challenger group run by Mark Penn, posted $632m of net revenue against $786.3m reported in the quarter, implying roughly $154m of the same. Omnicom, the New York holding company that closed its acquisition of Interpublic and now employs about 120,000 people, does not make the deduction: its organic growth is calculated on gross revenue including pass-through costs, and third-party service costs in the quarter rose 65.8% to $1.5bn, about 23% of the $6.56bn revenue line.
The buying practice that inflates the line
The gap is not bookkeeping trivia. Omnicom acts as principal — owner and reseller of media inventory rather than agent for the client — in experiential marketing and in parts of media buying. The Association of National Advertisers' March 2026 study of the practice found 90% of marketers now cite as their top concern whether recommended principal media is in their interest, up from 79% in 2024, with only 57% of companies operating any guidelines governing it. Integrated Media was 53% of Omnicom's quarter and grew above 10% organically; Advertising, at roughly 16% of revenue, fell high single digits.
That mix is why the merger, not the market, is the Omnicom story. Adjusted operating margin before amortization expanded two percentage points to 17.8%, and the company expects to deliver 75% to 80% of a $900m synergy target this year en route to $1.5bn annualized by mid-2028. Omnicom and Interpublic cut 8,200 roles across the two groups in 2025, against a stated aim of about 105,000 heads from 128,000 at end-2024. "We're now more of an operating company than a holding company," chairman and chief executive John Wren told investors on the July call. Consensus has 2027 revenue falling 3.3% as divestitures annualize while earnings per share still rise 13.5%.
One of the three is genuinely losing accounts
WPP's decline halved sequentially, from -6.7% in the first quarter to -2.8% in the second, and WPP Media ran worse than the group at -5.4% for the half. Net new business subtracted roughly six percentage points. The losses have names: Coca-Cola's North America media and the $1.7bn Mars account went to Publicis, while adidas and IBM global media went to Omnicom, which has won $4.1bn of new client billings in 2026. Global ad sales are forecast to rise 6.3% in 2026 and pass $1trn, so this is share changing hands, not a cycle. Chief financial officer Joanne Wilson warned on the 6 August call that "we expect second half margins to be down by as much as 200 basis points year-on-year." The shares still jumped about 25% in London that day, against a consensus that had penciled in a 6.5% decline; the New York listing gained 26% on five times its normal volume.
Stagwell grew organic net revenue 5%, with digital transformation up 18% to $107m at a 30% adjusted margin and record quarterly net new business of $171m — taken, Penn said, from incumbents including a 30-year holder of IBM's creative account. Adjusted earnings guidance went up to $1.17 from $1.03. The reported accounts disagree: operating income fell 50.2% to $11.5m and the company posted a net loss of $8.8m, with net leverage at 3.04x.
What the fee test settles
Fee income is not contracting across advertising agencies; it is contracting at one of these three. Omnicom earns its margin expansion, but part of its top-line growth is a gross meter carrying media costs that its rivals exclude, at the exact moment clients are asking harder questions about that practice. Stagwell is taking work, and its cash earnings are real even where its statutory ones vanish. WPP's improvement is a second derivative — the business is still smaller each quarter, only less so.
The market has barely begun to tell them apart. Omnicom trades at 8.1x forward earnings, against a trailing 45.3x made meaningless by a $941m merger charge, with a 10.3% free-cash-flow yield. Stagwell sits at 8.0x forward on consensus revenue growth of 12.1%. WPP is cheapest at 7.3x forward and 5.1x trailing enterprise value to earnings before interest, tax, depreciation and amortization — but its forward price-to-sales ratio of 0.43x sits above its trailing 0.31x, which is what it looks like when buyers pay more per pound of revenue because they expect fewer pounds of it.
WPP won Mars in 2018 and lost it this year, and management has said the account still has to come out of the fourth quarter.