

AI rack component break: last-to-fall names, not an early downtrend
Prompt v1.0
The nine-name AI-rack component cohort did break as a group, but VICR and GLW were the last out of strongly bullish bands, not the leading edge — and all nine still sit above their 200-day averages after 12-month gains of +94% to +733%. The macro leg cuts the other way: Alphabet raised 2026 capex, Corning's optical sales grew 32% and Vicor beat by 60% with backlog up 145%. Wolfspeed is the one genuinely idiosyncratic name.
| Ticker | Company | Segment | Trend · 13mo | 30D | 1Y |
|---|---|---|---|---|---|
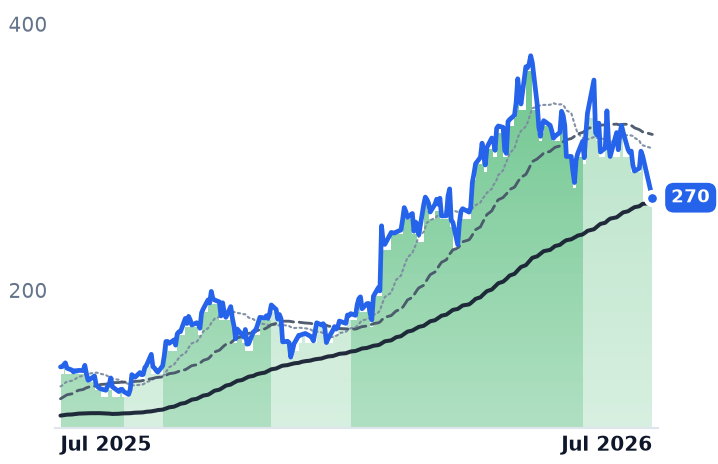
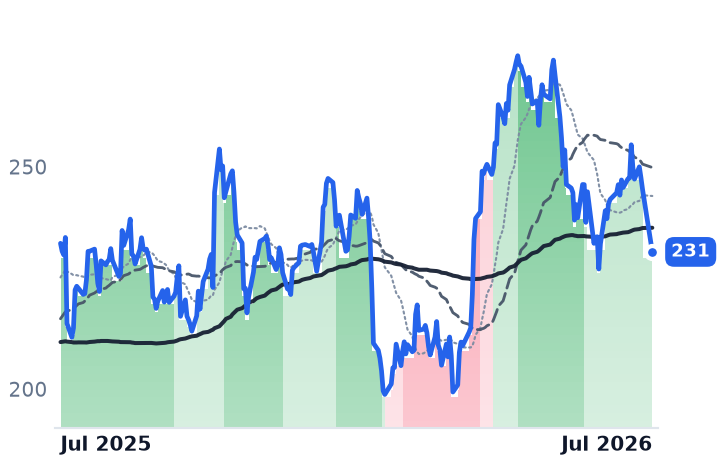
VICR | Vicor | Other | 🟢 Cont. Bull | −47.6% | +317.9% |
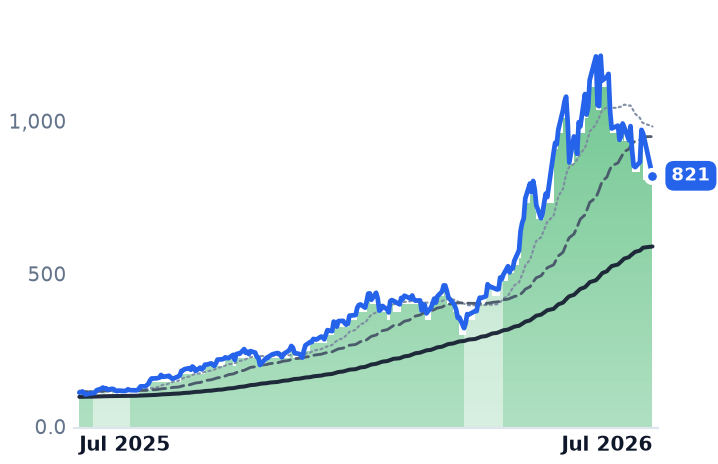
GLW | Corning | Display & Optical Materials | 🟢 Cont. Bull | −50.7% | +129.5% |
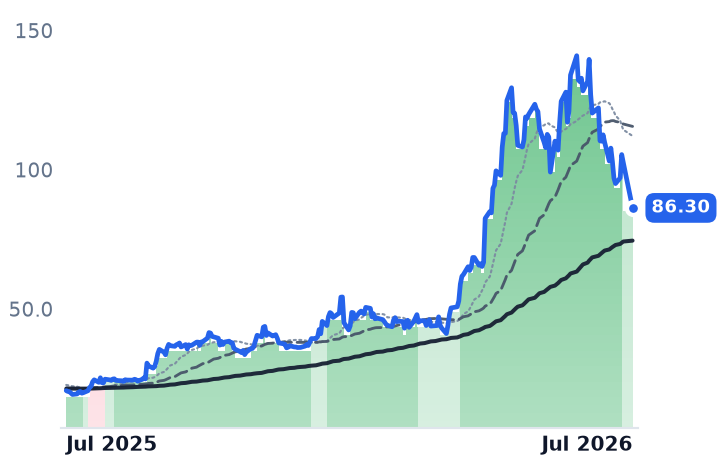
WOLF | Wolfspeed | Discrete & Power | 🌱 Emerging Bull | −50.5% | −1.0% |
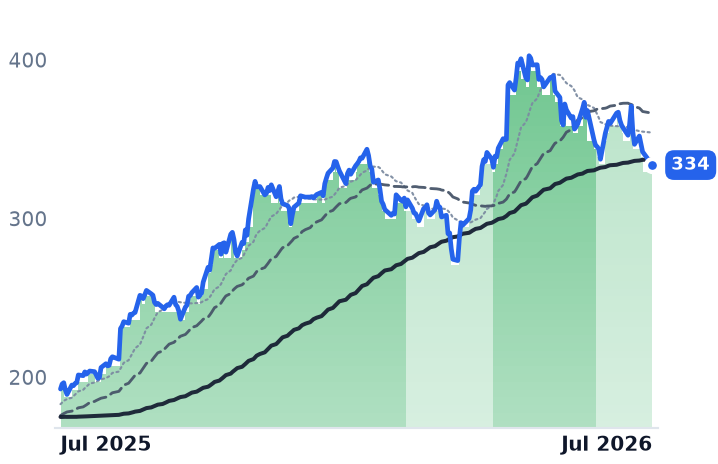
MPWR | Monolithic Power Systems | Analog & Mixed-Signal | 🟢 Cont. Bull | −2.2% | +74.5% |
COHR | Coherent | Instrumentation & Test Equipment | 🟢 Cont. Bull | −37.8% | +133.3% |
LITE | Lumentum | Optical Transport & Switching | 🟢 Cont. Bull | −23.4% | +508.3% |
AAOI | Applied Optoelectronics | RF & Wireless | 🟢 Cont. Bull | −41.3% | +249.5% |
ONTO | Onto Innovation | Semiconduct Equipment | 🟢 Cont. Bull | −31.2% | +137.5% |
VRT | Vertiv | Data Center Power & Thermal | 🟢 Cont. Bull | −12.2% | +89.3% |
GOOGL | Alphabet | Search & Advertising | 🟢 Cont. Bull | −5.6% | +73.3% |
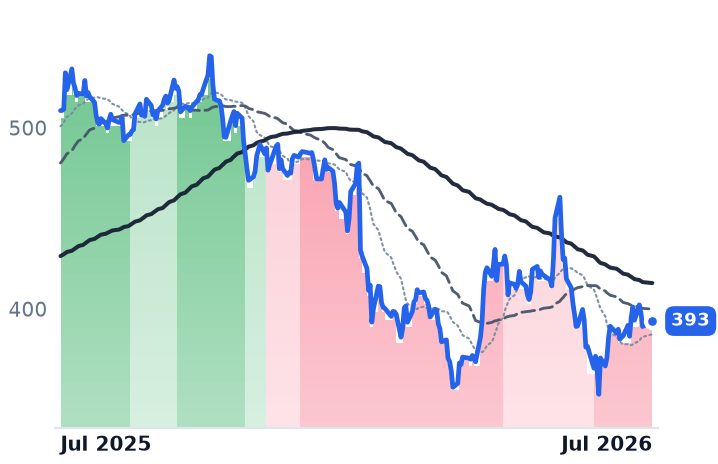
MSFT | Microsoft | Cloud Infrastructure & Platforms | 🔴 Cont. Bear | +6.7% | −22.8% |
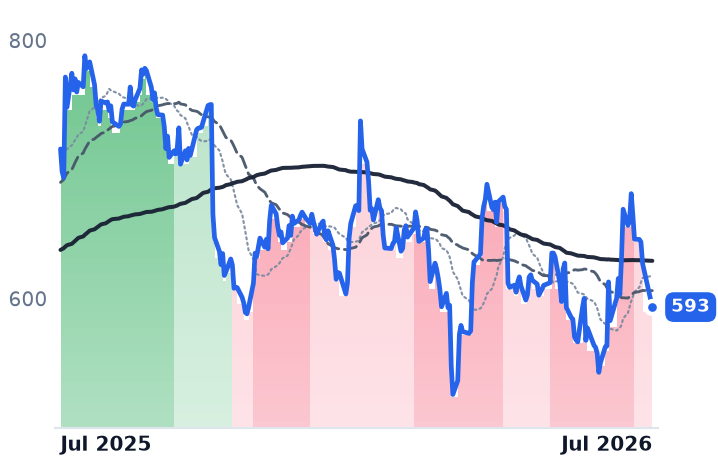
META | Meta Platforms | Social Media & Messaging | 🔴 Cont. Bear | +5.5% | −17.1% |
AMZN | Amazon.com | Online Marketplaces | 🟢 Cont. Bull | −3.9% | −0.8% |
MU | Micron Technology | Memory (DRAM/NAND) | 🟢 Cont. Bull | −28.3% | +638.6% |
INTC | Intel | Specialty Semiconductors | 🟢 Cont. Bull | −34.5% | +317.3% |
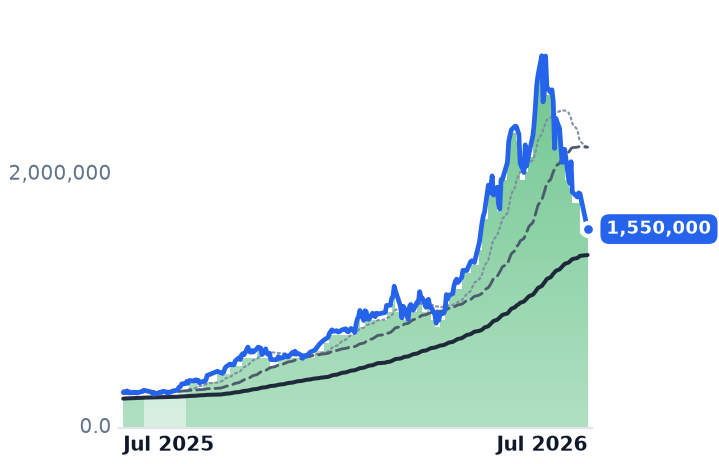
000660.KS | SK hynix | Semiconductors | 🟢 Cont. Bull | −41.0% | +494.0% |
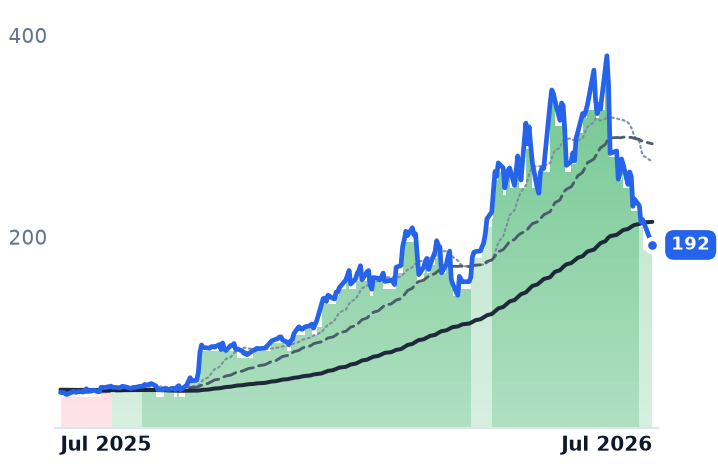
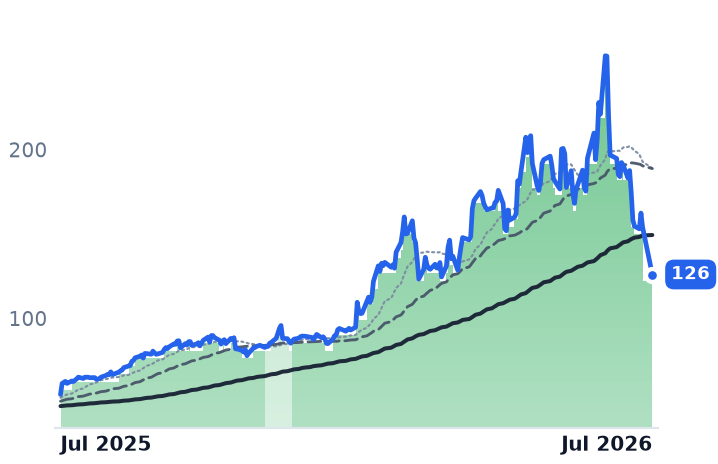
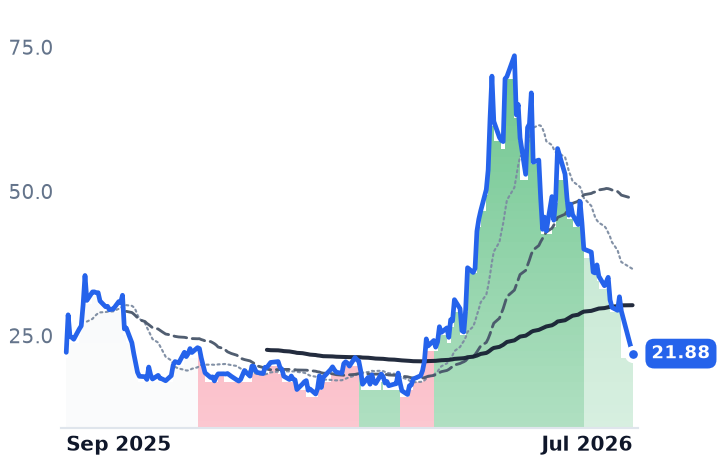
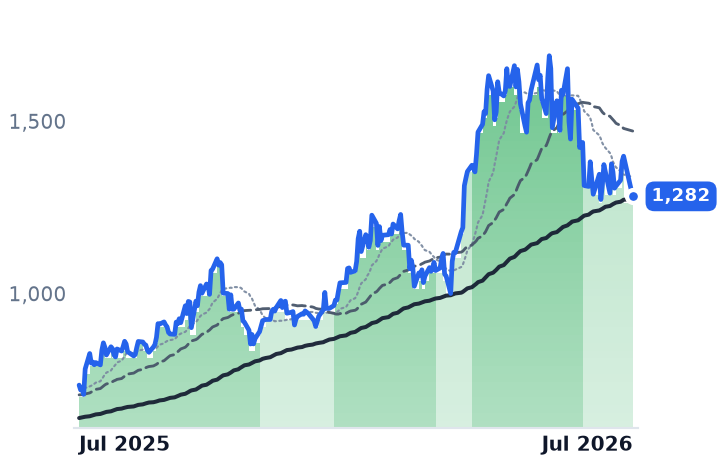
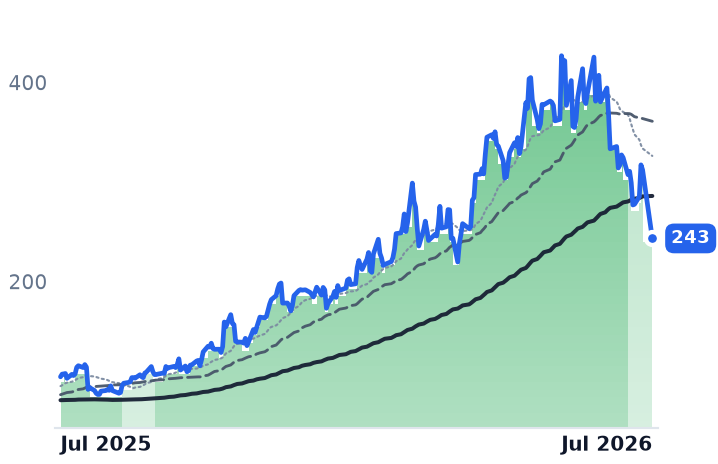
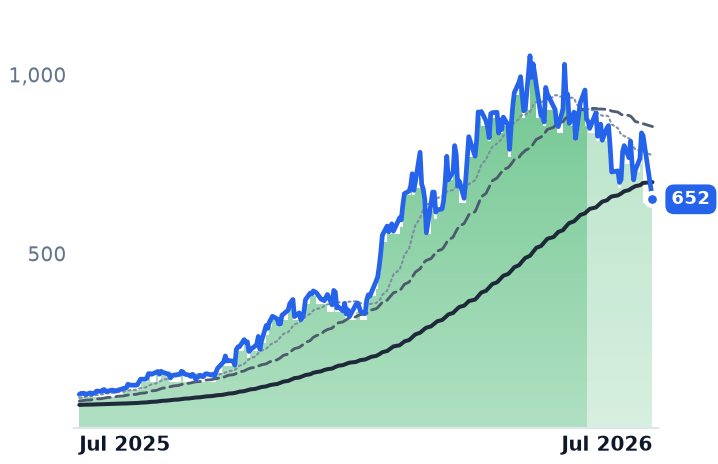
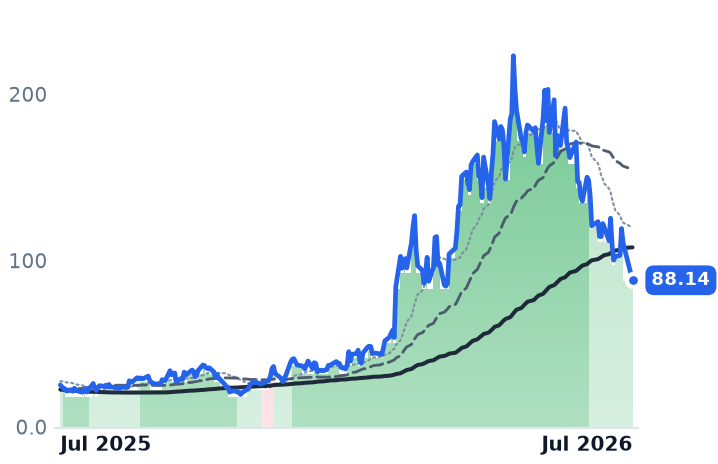
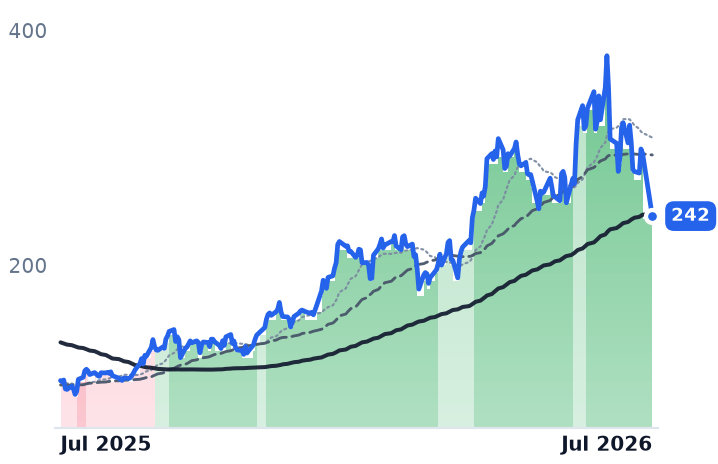
12-month price & trend
| Ticker | Mkt cap | P/E | P/E fwd | P/S | P/S fwd | P/GP | P/GP fwd | EV/EBITDA | FCF yld |
|---|---|---|---|---|---|---|---|---|---|
VICR | $11.5B | 79.7x | 74.0x | 24.3x | 19.1x | 42.9x | 33.7x | 86.8x | 0.4% |
GLW | $137.7B | 72.4x | 48.9x | 8.1x | 7.2x | 22.4x | 19.7x | 37.1x | 1.7% |
WOLF | $1.7B | n/m | — | 2.4x | 2.6x | — | — | n/m | -43.9% |
| Ticker | Mkt cap | P/E | P/E fwd | P/S | P/S fwd | P/GP | P/GP fwd | EV/EBITDA | FCF yld |
|---|---|---|---|---|---|---|---|---|---|
MPWR | $69.6B | 86.3x | 52.1x | 21.3x | 16.9x | 38.5x | 30.6x | 67.8x | 0.8% |
COHR | $68.7B | 80.7x | 42.0x | 9.7x | 7.1x | 25.7x | 18.9x | 53.7x | -85.8% |
LITE | $75.4B | n/m | 52.1x | 25.0x | 13.3x | 60.0x | 31.9x | n/m | 0.7% |
| Ticker | Mkt cap | P/E | P/E fwd | P/S | P/S fwd | P/GP | P/GP fwd | EV/EBITDA | FCF yld |
|---|---|---|---|---|---|---|---|---|---|
AAOI | $12.4B | n/m | 149.9x | 20.9x | 11.9x | 72.1x | 41.3x | n/m | -3.3% |
ONTO | $17.5B | 130.5x | 48.8x | 15.6x | 13.0x | 31.0x | 25.8x | 66.8x | 1.4% |
VRT | $142.5B | 91.1x | 57.7x | 13.1x | 10.3x | 36.3x | 28.5x | 61.1x | 1.6% |
| Ticker | Mkt cap | P/E | P/E fwd | P/S | P/S fwd | P/GP | P/GP fwd | EV/EBITDA | FCF yld |
|---|---|---|---|---|---|---|---|---|---|
GOOGL | $4.2T | 17.2x | 17.1x | 9.4x | 8.5x | 15.4x | 13.9x | 13.0x | 1.3% |
MSFT | $3.7T | 27.5x | 25.2x | 11.1x | 9.4x | 16.3x | 13.9x | 18.2x | 1.8% |
META | $1.5T | 21.9x | 18.4x | 6.6x | 5.9x | 8.1x | 7.2x | 14.9x | 2.7% |
| Ticker | Mkt cap | P/E | P/E fwd | P/S | P/S fwd | P/GP | P/GP fwd | EV/EBITDA | FCF yld |
|---|---|---|---|---|---|---|---|---|---|
AMZN | $2.8T | 20.8x | 22.4x | 3.6x | 3.4x | 7.2x | 6.7x | 11.7x | -0.4% |
MU | $1.0T | 19.9x | 12.2x | 11.2x | 7.8x | 15.4x | 10.7x | 14.5x | 2.6% |
INTC | $546.7B | n/m | 101.3x | 10.2x | 9.4x | 28.7x | 26.5x | 50.4x | -0.6% |
| Ticker | Mkt cap | P/E | P/E fwd | P/S | P/S fwd | P/GP | P/GP fwd | EV/EBITDA | FCF yld |
|---|---|---|---|---|---|---|---|---|---|
000660.KS | $1135.3T | 15.5x | 6.1x | 8.6x | 3.6x | 12.6x | 5.3x | 11.8x | 3.6% |
Consensus projections
| Ticker | FY2026E | FY2027E | FY2028E | |
|---|---|---|---|---|
VICR | Revenue | +33.1% | +55.6% | +22.2% |
| EPS | +58.9% | +73.2% | +33.0% | |
GLW | Revenue | +17.5% | +18.7% | +21.0% |
| EPS | +29.6% | +31.7% | +36.5% | |
WOLF | Revenue | +0.7% | −14.8% | +24.1% |
| EPS | +275.2% | −30.1% | −11.8% | |
MPWR | Revenue | +47.9% | +26.0% | +13.5% |
| EPS | +53.3% | +28.2% | +13.2% | |
COHR | Revenue | +21.9% | +37.7% | +38.2% |
| EPS | +55.9% | +53.4% | +58.4% | |
LITE | Revenue | +83.9% | +89.0% | +54.6% |
| EPS | +314.0% | +125.9% | +58.9% | |
AAOI | Revenue | +129.8% | +169.3% | +48.7% |
| EPS | −417.3% | +454.2% | +102.6% | |
ONTO | Revenue | +2.2% | +33.5% | +23.2% |
| EPS | −5.1% | +44.8% | +35.6% | |
VRT | Revenue | +35.2% | +25.8% | +19.4% |
| EPS | +55.6% | +33.8% | +25.8% | |
GOOGL | Revenue | +23.7% | +22.5% | +19.0% |
| EPS | +90.3% | −25.8% | +18.1% | |
MSFT | Revenue | +18.0% | +18.2% | +19.6% |
| EPS | +26.7% | +15.4% | +18.5% | |
META | Revenue | +27.3% | +19.9% | +17.9% |
| EPS | +39.6% | +7.2% | +15.8% | |
AMZN | Revenue | +15.7% | +14.0% | +15.9% |
| EPS | +63.6% | −10.9% | +30.2% | |
MU | Revenue | +248.0% | +92.8% | +11.4% |
| EPS | +804.9% | +111.2% | +7.9% | |
INTC | Revenue | +10.8% | +10.5% | +10.1% |
| EPS | +211.5% | +39.0% | +41.2% | |
000660.KS | Revenue | +225.0% | +34.1% | +9.7% |
| EPS | +373.8% | +29.8% | +6.7% |
Forward fiscal years only. Blank means no analyst coverage for that year.
The cohort broke — in the wrong order
Peak closes across the nine names span seven weeks: LITE 11 May ($1,053.09), AAOI 13 May, VRT 14 May, WOLF 26 May, COHR 2 Jun, MPWR 3 Jun, then GLW 29 Jun ($255.69), ONTO 30 Jun and VICR 30 Jun ($379.78). Strongly bullish band exits follow the same sequence — VRT 15 Jun, LITE 16 Jun, MPWR 25 Jun, AAOI 30 Jun, WOLF 2 Jul, COHR 13 Jul, VICR 20 Jul — with GLW and ONTO still unbroken on 22 July. The hypothesis had VICR/GLW/WOLF as the early edge of a component-layer downtrend; the band data says they are the tail.
Depth confirms it. Drawdowns from 52-week highs run WOLF -60.2%, AAOI -50.5%, VICR -42.8%, GLW -39.7% versus MPWR -17.2%. Yet no cohort member is in a bear band — the worst state reached is mildly bullish — and all nine remain above their 200-day averages, LITE by +42.6% and WOLF by only +2.0%. Trailing 12-month gains of +733% (LITE), +381% (VICR) and +185% (GLW) frame this as a multiple unwind off a melt-up.
Fundamentals accelerated into the decline
Corning's Q2 beat both lines with Optical Communications sales +32% to $2.07bn — but that is a deceleration from 36%, and a Q3 guide of $4.9–5.0bn against $4.99bn consensus produced a ~16-18% single-day drop, the worst since 2002, erasing over $23bn. That print dragged COHR -11%, AAOI -10% and LITE -9% on sentiment, not company news. Corning nonetheless still guides to a 19% sales CAGR through 2030 and a $40bn Springboard run-rate, while Lumentum grew revenue 65.5% YoY and Vicor beat EPS by 60% with backlog +145% YoY. Vicor still fell 7.1% on 21 July, even as Roth moved to $375 and Craig-Hallum to $450 against a $217.35 close. Optical supply also remains about 30% short of demand into end-2026.
What is actually deteriorating
Not capex levels — Alphabet raised 2026 guidance to $195–205bn with $811bn of purchase commitments, and the big four plan ~$725bn, up 77%, with MSFT/META on 29 July and AMZN on 30 July. What changed is financing optics: Alphabet's first negative free cash flow quarter (-$5.9bn) and paused buybacks. The early-July leg was broader still — Micron -13% in a session, Intel -21% over seven days — alongside SK Hynix -30.4%, Bloom Energy -31.6% and Argan -31.5% over the same 30 days.
The architecture leg is real but ambiguous: NVIDIA's 800 VDC design removes the 48V intermediate bus stage for 2027 Rubin Ultra racks, and TI has shipped a complete 800 VDC architecture with NVIDIA — yet desk notes read the same transition as a tailwind for Vicor's factorized-power IP. Wolfspeed is the clean idiosyncratic case: Chinese 6-inch SiC substrates at $200–300/wafer versus ~$1,500 historically, FQ4 revenue guided to $140–160M at negative gross margin, and the desk's own $22 target sitting below a $29.27 close.