

Geothermal's policy edge is real — the trade is not a cohort
Prompt v1.0
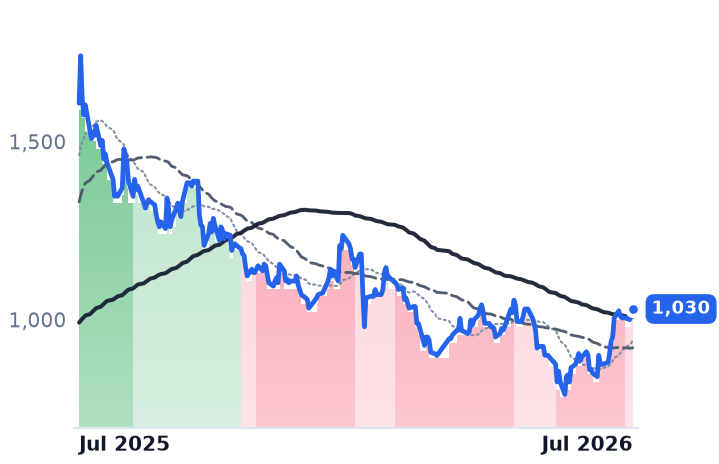
PGEO.JK's +22.6% 30-day gradual rally ranks 8th across the desk's ~4,400-symbol universe, but Ormat fell 10.7%, CWEN 12.9% and BEP 8.9% over the same window. The geothermal policy and hyperscaler-PPA tailwinds are real and dated — they just don't explain PGEO, which looks like a yield-and-valuation re-rating off a washed-out base.
| Ticker | Company | Segment | Trend · 13mo | 30D | 1Y |
|---|---|---|---|---|---|
PGEO.JK | PT Pertamina Geothermal Energy Tbk | — | 🔴 Cont. Bear | +22.6% | −35.9% |
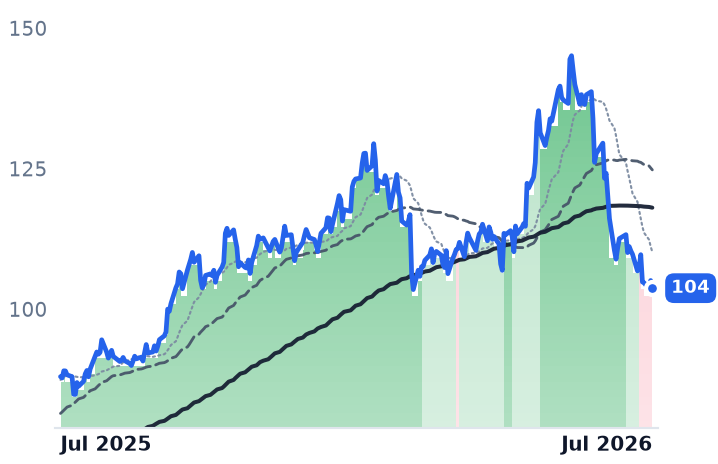
ORA | Ormat Technologies | Geothermal & Specialized | 🟢 Cont. Bull | −6.1% | +17.9% |
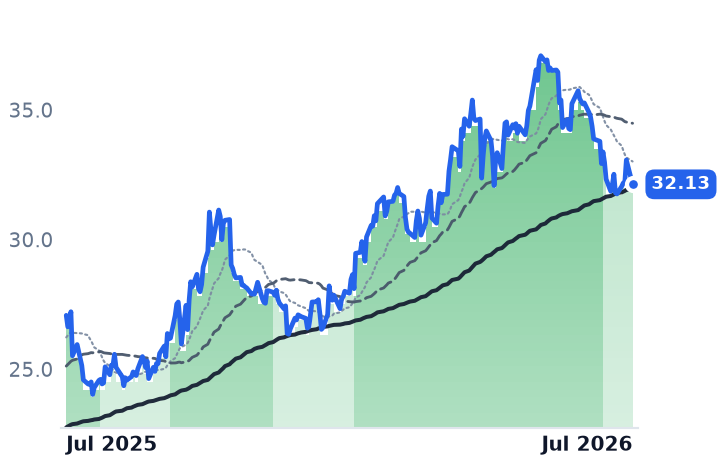
BEP | Brookfield Renewable Partners | Diversified Renewable Generators | 🟢 Cont. Bull | −7.9% | +18.7% |
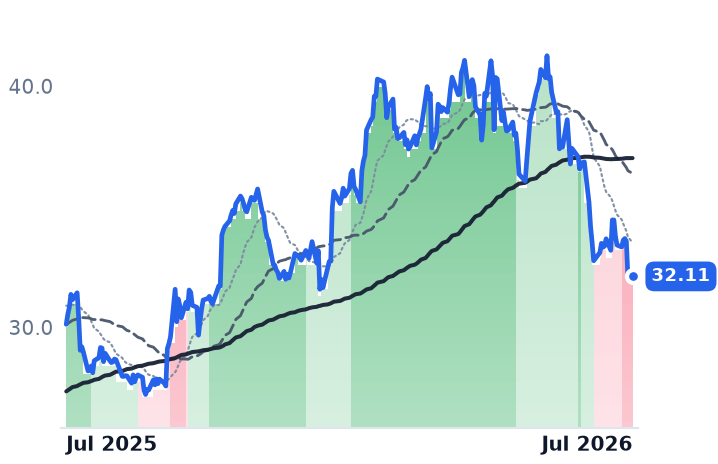
CWEN | Clearway Energy | Wind & Solar Developers | ⚠️ Emerging Bear | −8.7% | +6.6% |
12-month price & trend
| Ticker | Mkt cap | P/E | P/E fwd | P/S | P/S fwd | P/GP | P/GP fwd | EV/EBITDA | FCF yld |
|---|---|---|---|---|---|---|---|---|---|
PGEO.JK | — | — | — | — | — | — | — | — | — |
ORA | $8.1B | 62.8x | 57.4x | 6.9x | 7.0x | 25.2x | 25.4x | 18.8x | -2.7% |
BEP | $10.6B | 75.5x | — | 1.7x | 1.6x | 6.9x | 6.4x | 10.0x | -44.4% |
| Ticker | Mkt cap | P/E | P/E fwd | P/S | P/S fwd | P/GP | P/GP fwd | EV/EBITDA | FCF yld |
|---|---|---|---|---|---|---|---|---|---|
CWEN | $6.5B | 793.3x | — | 4.4x | 3.9x | 8.5x | 7.5x | 14.3x | 9.0% |
Consensus projections
| Ticker | FY2026E | FY2027E | FY2028E | |
|---|---|---|---|---|
ORA | Revenue | +19.2% | +1.7% | +10.7% |
| EPS | +4.8% | +8.5% | +29.3% | |
BEP | Revenue | +6.1% | +11.0% | −0.0% |
| EPS | +4.7% | −20.8% | +4.8% | |
CWEN | Revenue | +17.0% | +11.6% | +12.6% |
| EPS | −164.1% | −148.8% | +63.8% |
Forward fiscal years only. Blank means no analyst coverage for that year.
The move is real, and unusually clean
Pertamina Geothermal Energy climbed from 840 on 29 June to 1,030 on 22 July, a +22.6% 30-day gain classified as gradual intensity — no single-day pop — and the 8th-largest 30-day advance across the desk's full ~4,400-symbol universe. The path off the 790 trough on 8 June runs 875 (7/1), 940 (7/8), 1,005 (7/10), 1,030 (7/22), with the biggest volume days (47.6m, 49.4m, 43.1m) arriving on the up-legs. Participation is genuine.
But there is no cohort behind it
Over the identical 30 days Ormat fell 10.7% (116.12 to 103.74), CWEN fell 12.9% and BEP fell 8.9%. Trend bands moved the wrong way: ORA went strongly bullish (7/1) to mildly bearish (7/15), CWEN mildly bullish to strongly bearish (7/20–7/27), BEP strongly bullish to mildly bullish. PGEO itself only improved from strongly bearish to mildly bearish around 7/20 — it has not entered a bull band. No other geothermal, renewable or baseload name appears in the universe's top-12 30-day gainers.
The macro legs check out — for the wrong stock
Every structural driver the thesis assumed is verifiable. Geothermal kept the full 48E/45Y credits with a 2033 begin-construction window while wind and solar face mid-2026/2027 cliffs. BLM adopted categorical exclusions effective 28 April 2026 alongside IM 2026-004's annual lease sales. Hyperscaler offtake is accelerating — Meta's 300 MW with XGS and Sage, Google's Fervo PPA, Fervo's $1.89bn May IPO — and Ormat itself signed a 150 MW portfolio PPA with NV Energy for Google's Nevada data centers on 17 February. Those accrue to ORA — the worst 30-day performer in the set. Its Q1 was revenue of $403.9m, +75.8% YoY, guidance maintained; the July slide followed a Bernstein Underperform initiation at $115 against a ~50x multiple. That is a multiple story, not an earnings story.
Indonesia's leg is similarly split: RUPTL 2025-2034 targets 5.2 GW of geothermal, but the country added just 112.7 MW by end-2025 against a 500–600 MW/year implied run-rate.
What the move actually looks like
PGEO trades at 13.5x trailing earnings versus Ormat's 50.8x, pays IDR 53.09/share on a 99% payout ratio for a ~5–6% yield, and posted Q1 2026 net profit of $43.9m, +40% YoY off a 2025 base that fell 14%. Longer-dated growth exists — 988 MW targeted by 2028 and 1.8 GW by 2033 — but the stock is flat over 180 days, +1% over 90, and 43.7% below its 52-week high. On runway: BRI Danareksa raised its target to Rp1,300 on 16 July, with Ciptadana at Rp1,200; the stale consensus average of Rp1,634 spans Rp900–2,400. At 1,030, most of the actively-updated gap is closed.