

Clean energy isn't de-rating as one trade — it splits three ways
Prompt v1.0
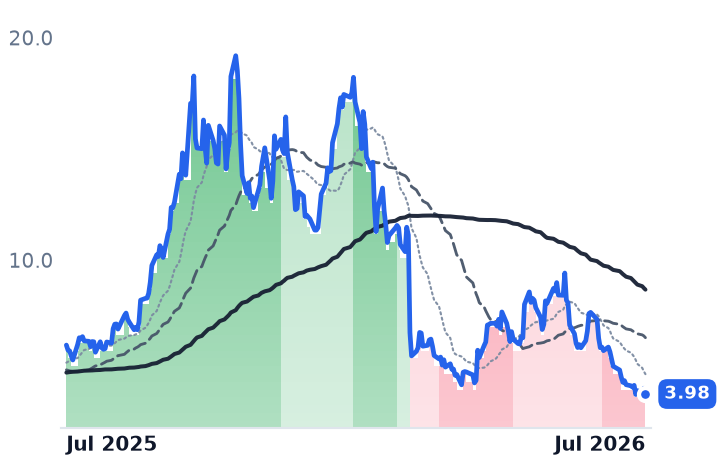
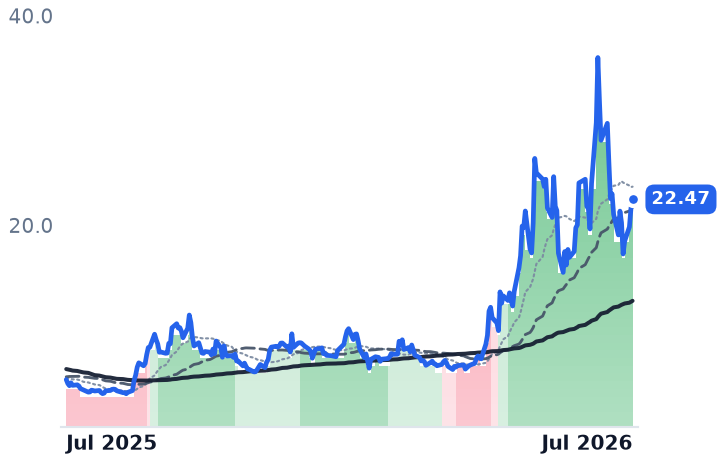
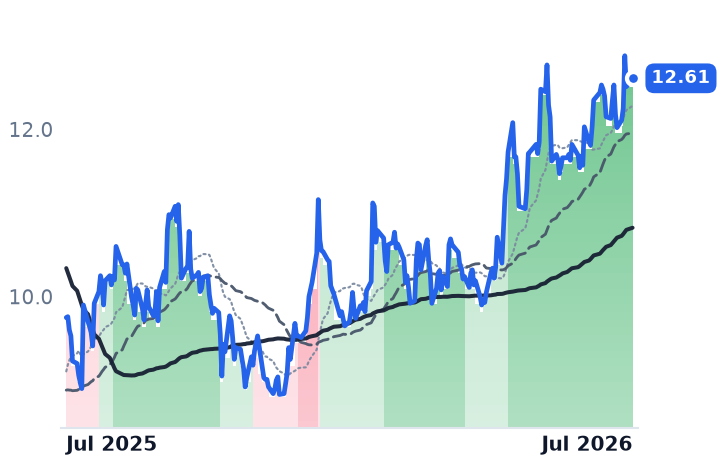
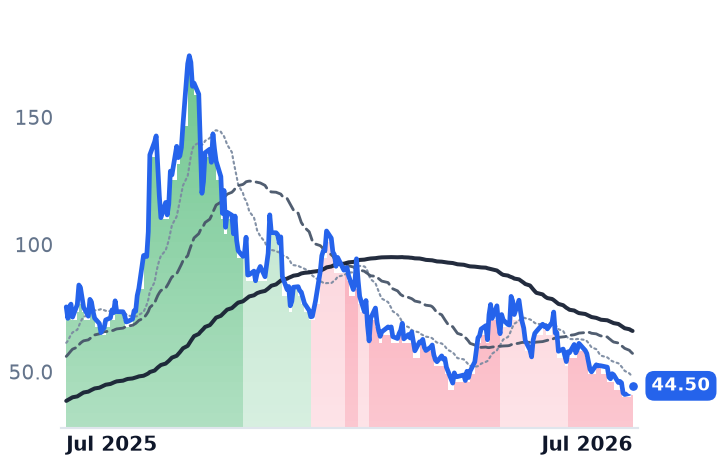
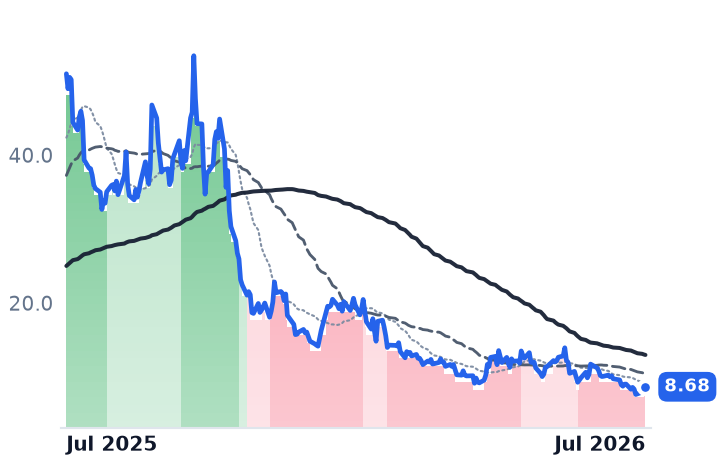
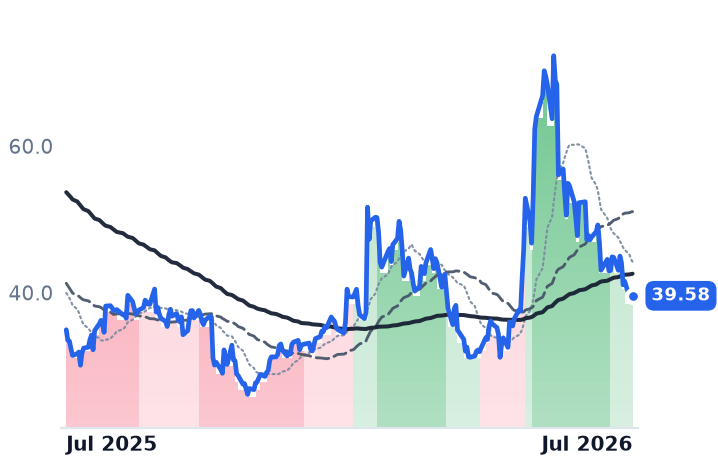
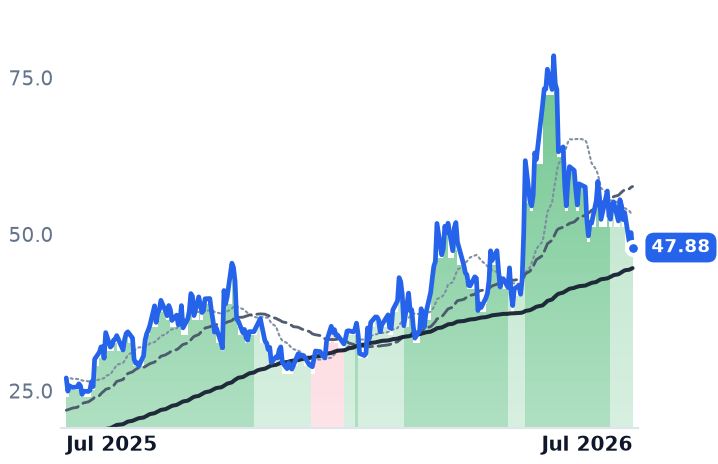
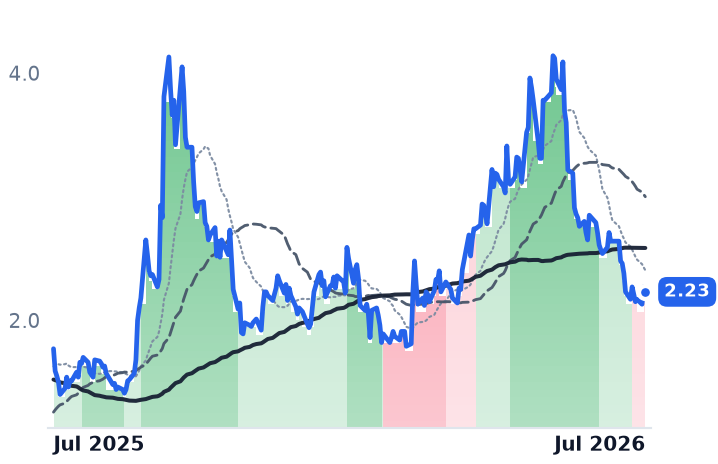
The clean-generation selloff is not one cohort-wide policy de-rating. Residential solar and storage (RUN -26% in 30 days, EOSE -46%) are in confirmed, months-old downtrends with dated policy and execution causes, while Bloom Energy is a post-blowoff give-back still above its 200-day MA and FuelCell, Brookfield Renewable and XPLR remain in bull bands. Nuclear developers fell harder than solar, which contradicts the 'AI power rotates to nuclear' leg.
| Ticker | Company | Segment | Trend · 13mo | 30D | 1Y |
|---|---|---|---|---|---|
BE | Bloom Energy | Fuel Cell & Hydrogen | 🟢 Cont. Bull | −31.6% | +441.1% |
RUN | Sunrun | Residential Solar Installers | ⚠️ Emerging Bear | −26.0% | −10.5% |
CWEN | Clearway Energy | Wind & Solar Developers | ⚠️ Emerging Bear | −8.7% | +6.6% |
BEP | Brookfield Renewable Partners | Diversified Renewable Generators | 🟢 Cont. Bull | −7.9% | +18.7% |
EOSE | Eos Energy Enterprises | Energy Storage & Batteries | ⚠️ Emerging Bear | −34.6% | −35.6% |
FCEL | FuelCell Energy | Fuel Cell & Hydrogen | 🟢 Cont. Bull | −24.6% | +326.4% |
XIFR | XPLR Infrastructure | Renewable & Infrastructure Assets | 🟢 Cont. Bull | +6.4% | +29.3% |
OKLO | Oklo | Emerging & Specialized Energy | ⚠️ Emerging Bear | −15.7% | −41.1% |
SMR | NuScale Power | Advanced Nuclear | 🔴 Cont. Bear | −15.4% | −83.0% |
ENPH | Enphase Energy | Inverters & Power Electronics | 🌱 Emerging Bull | −18.1% | +13.2% |
SEDG | SolarEdge Technologies | Inverters & Power Electronics | 🟢 Cont. Bull | −13.5% | +76.9% |
PLUG | Plug Power | Fuel Cell & Hydrogen | 🟢 Cont. Bull | −13.9% | +26.0% |
12-month price & trend
| Ticker | Mkt cap | P/E | P/E fwd | P/S | P/S fwd | P/GP | P/GP fwd | EV/EBITDA | FCF yld |
|---|---|---|---|---|---|---|---|---|---|
BE | $67.7B | 275.0x | 87.8x | 21.7x | 16.7x | 69.6x | 53.5x | 194.0x | 0.9% |
RUN | $2.3B | 4.0x | 8.1x | 0.7x | 0.8x | 2.4x | 2.5x | 22.0x | -32.1% |
CWEN | $6.5B | 793.3x | — | 4.4x | 3.9x | 8.5x | 7.5x | 14.3x | 9.0% |
| Ticker | Mkt cap | P/E | P/E fwd | P/S | P/S fwd | P/GP | P/GP fwd | EV/EBITDA | FCF yld |
|---|---|---|---|---|---|---|---|---|---|
BEP | $10.6B | 75.5x | — | 1.7x | 1.6x | 6.9x | 6.4x | 10.0x | -44.4% |
EOSE | $2.1B | n/m | — | 12.8x | 6.7x | — | — | n/m | -18.8% |
FCEL | $1.1B | n/m | — | 6.7x | 7.0x | — | — | n/m | -11.6% |
| Ticker | Mkt cap | P/E | P/E fwd | P/S | P/S fwd | P/GP | P/GP fwd | EV/EBITDA | FCF yld |
|---|---|---|---|---|---|---|---|---|---|
XIFR | $1.1B | 17.8x | 3.5x | 0.9x | 0.8x | 5.4x | 4.9x | 9.0x | -56.5% |
OKLO | $7.7B | n/m | — | — | — | — | — | n/m | -3.6% |
SMR | $2.8B | n/m | — | 261.9x | 91.1x | — | 432.7x | n/m | -27.7% |
| Ticker | Mkt cap | P/E | P/E fwd | P/S | P/S fwd | P/GP | P/GP fwd | EV/EBITDA | FCF yld |
|---|---|---|---|---|---|---|---|---|---|
ENPH | $5.3B | 39.7x | 20.0x | 4.0x | 4.5x | 8.6x | 9.6x | 30.5x | 2.9% |
SEDG | $2.0B | n/m | — | 1.5x | 1.5x | 6.7x | 6.6x | n/m | 4.6% |
PLUG | $4.3B | n/m | — | 5.9x | 5.4x | — | — | n/m | -15.4% |
Consensus projections
| Ticker | FY2026E | FY2027E | FY2028E | |
|---|---|---|---|---|
BE | Revenue | +112.4% | +65.1% | +46.0% |
| EPS | +374.5% | +83.5% | +60.7% | |
RUN | Revenue | +26.6% | +7.7% | +13.7% |
| EPS | −11.7% | −61.6% | +54.2% | |
CWEN | Revenue | +17.0% | +11.6% | +12.6% |
| EPS | −164.1% | −148.8% | +63.8% | |
BEP | Revenue | +6.1% | +11.0% | −0.0% |
| EPS | +4.7% | −20.8% | +4.8% | |
EOSE | Revenue | +104.5% | +94.6% | +87.8% |
| EPS | −93.2% | −73.0% | −510.5% | |
FCEL | Revenue | +8.2% | +42.4% | +55.0% |
| EPS | −74.3% | −12.0% | −47.7% | |
XIFR | Revenue | −0.5% | +6.4% | +2.4% |
| EPS | −2313.0% | −17.3% | −43.1% | |
OKLO | Revenue | — | +364.3% | +700.0% |
| EPS | +20.2% | +14.2% | +12.2% | |
SMR | Revenue | −26.7% | +434.9% | +101.2% |
| EPS | −74.7% | +33.4% | −18.3% | |
ENPH | Revenue | −19.3% | +5.7% | +11.2% |
| EPS | −27.7% | +9.8% | +17.8% | |
SEDG | Revenue | +13.6% | +11.7% | +11.0% |
| EPS | −88.4% | −454.7% | +84.6% | |
PLUG | Revenue | +15.3% | +18.6% | +20.0% |
| EPS | −58.0% | −48.6% | −31.7% |
Forward fiscal years only. Blank means no analyst coverage for that year.
The tape doesn't rhyme
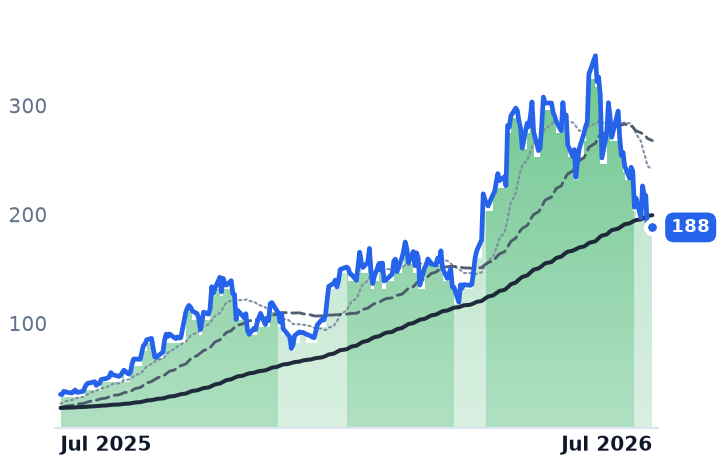
Bloom Energy closed at $188.18 on July 27, down 25.3% over 30 days and 46.4% below its 52-week high of $351.28 — yet still up roughly 448% over 12 months and about 6.3% above its 200-day moving average, with its trend band stepping only from strongly bullish to mildly bullish. That is the shape of a post-blowoff give-back, not a completed break. The proximate catalysts are name-specific: Hunterbrook's July 8 "Bloom's Big Lie" short report alleging China-routed scandium sourcing and a 5 GW goal requiring ~220 tons against ~240 tons of global supply, Bloom's rebuttal calling the financial allegations "false and misleading", and a Q2 print landing July 28. The Desk's own May analysis already flagged BE at 31x sales and 119x forward earnings.
Where the downtrend is genuinely confirmed
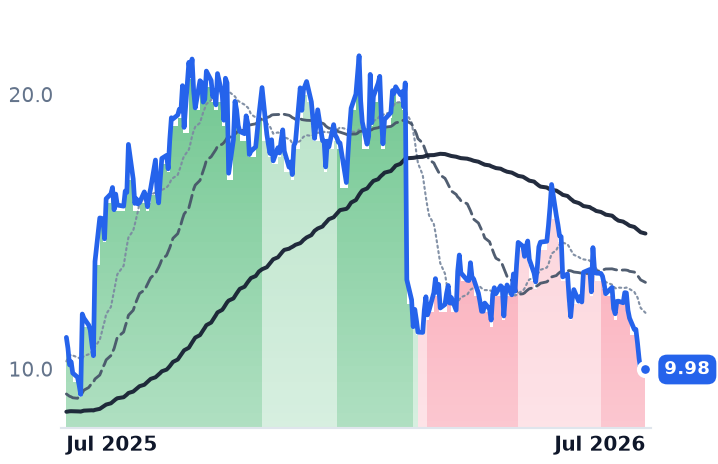
Sunrun at $9.98 is -26% over 30 days, -23% over 90 and -53% over six months, below both its 50-day ($13.17) and 200-day ($16.02) averages and strongly bearish. The policy chain is dateable: the residential 25D credit expired for systems placed in service after 12/31/2025, with Q1 subscriber adds down 25% year over year; SEIA and Wood Mackenzie project a ~33% drop in US residential volume in 2026; the 48E/45Y begin-construction deadline of July 5, 2026 sits inside the drawdown, layered on IRS Notice 2025-42's physical-work test and pending FEOC rules; and Commerce set preliminary duties taking Indian cells to roughly 234% with final determinations and October duty orders still to come. Sell-side targets have been cut broadly, though the shift toward third-party ownership and a reduced-capacity outlook debate cut both ways. Eos, -46% in a month and -77% in six, is an execution story: manufacturing issues, a ~$970M FY25 loss and a securities class action.
What breaks the macro leg
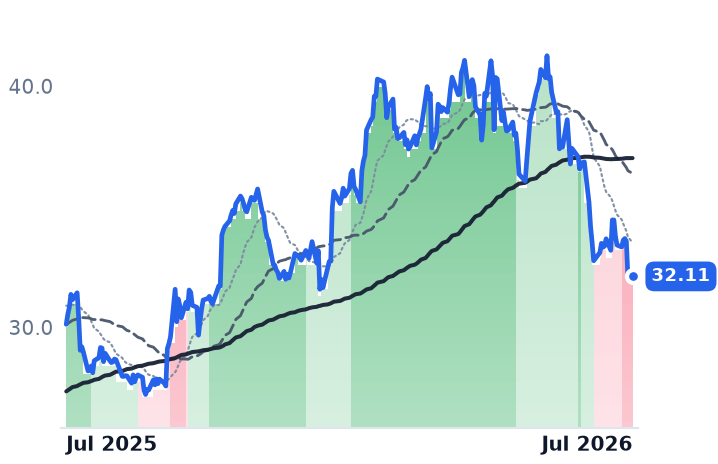
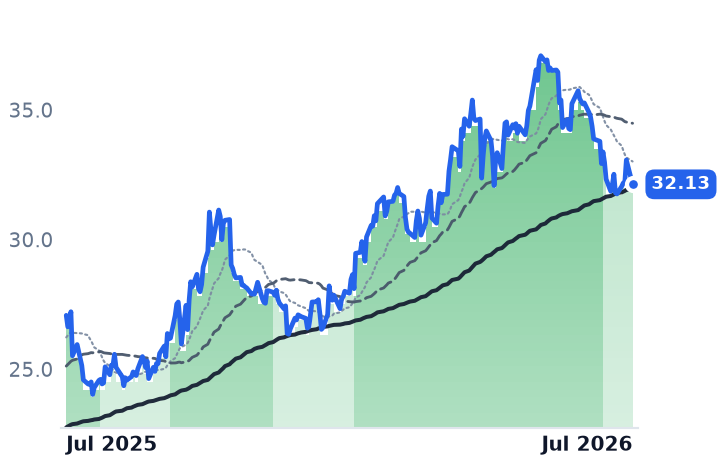
Clearway is the cleanest fresh bear-band entry — strongly bullish to strongly bearish, -21% over 90 days — pairing a reaffirmed $470-510M CAFD guide with a collapsed 2026 EPS consensus. But Brookfield Renewable is still mildly bullish and above its 200-day, XPLR is +22% over 90 days and strongly bullish, and FuelCell is +85% over 90 days. Meanwhile Oklo (-42% over 90 days) and NuScale (-32%) fell harder than solar, a July 16 tech selloff swept AI-infrastructure power names, hyperscalers still signed roughly half of 2025's global clean PPAs, and utility-scale announcements rose in Q1 2026. Read it as a speculative-multiple de-rating overlaid on a real residential demand air pocket.