

Infra-software 'emerging bull' tag hides a split artifact, two laggards
Hypothesis Opus 5 · Research Sonnet 5 · Writing Sonnet 5 · Prompt v1.0
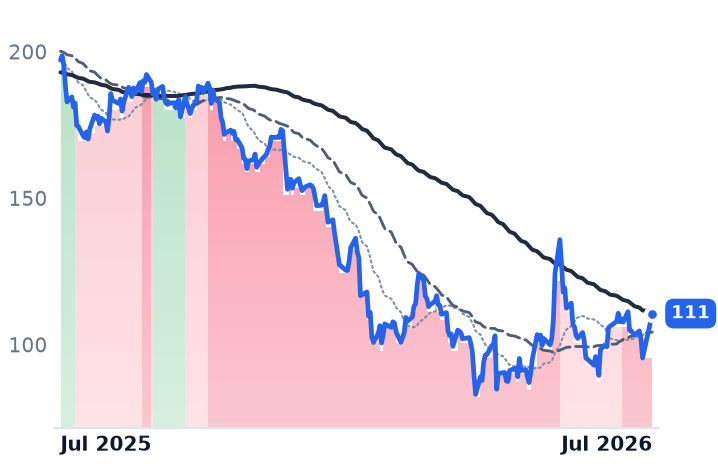
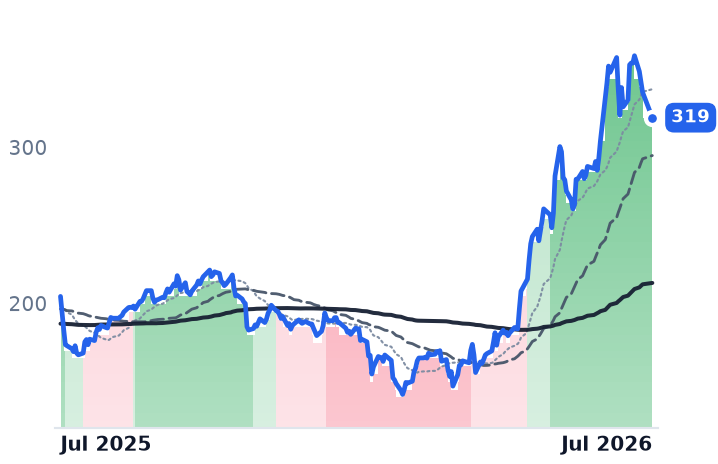
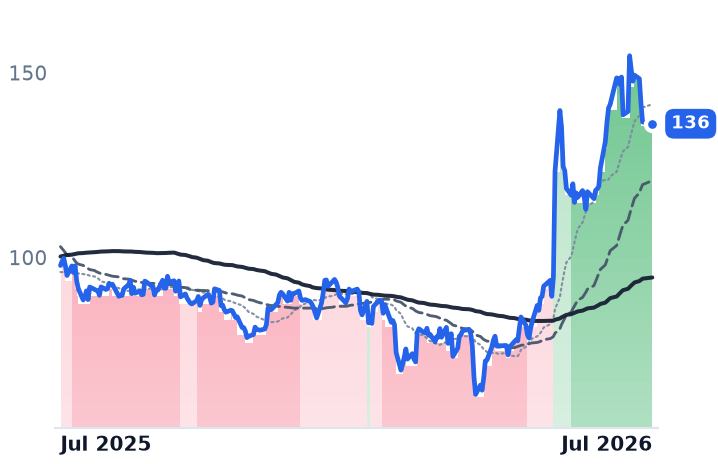
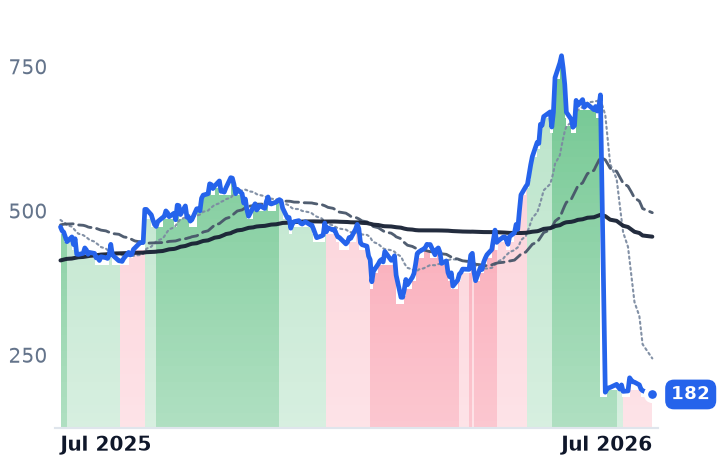
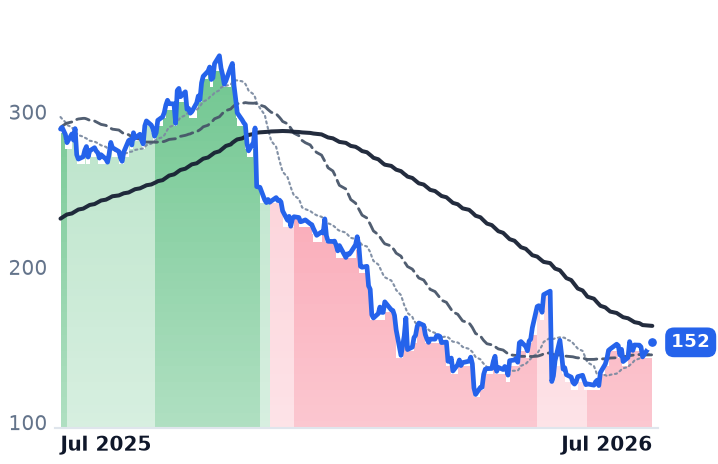
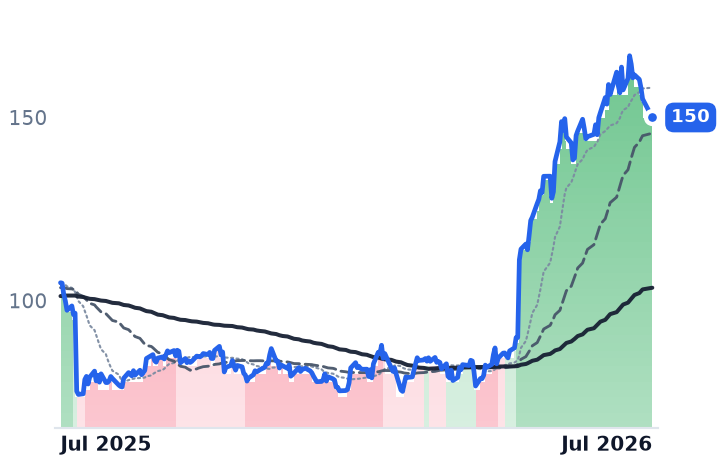
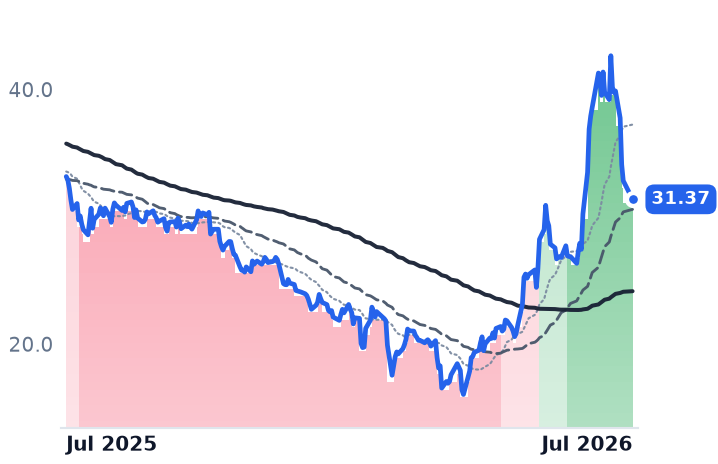
The CrowdStrike -59.5% three-month "collapse" cited as a counterweight to this cohort's bull case is a stock-split data artifact — split-adjusted CRWD is actually up roughly 69% over three months — while the genuine bear-to-bull transitions across DDOG, NET, SNOW, PANW and OKTA clustered between early May and late June, not inside the trailing 30 days. NOW and PLTR remain the category's real, unresolved laggards, stuck in strongly bearish bands for 90-360+ days despite category membership.
| Ticker | Company | Segment | Trend · 13mo | 30D | 1Y |
|---|---|---|---|---|---|
| The subject · what this brief is about | |||||
DDOG | Datadog | Data & Analytics Platforms | 🟢 Cont. Bull | +0.9% | +66.4% |
NET | Cloudflare | Network & Application Delivery | 🟢 Cont. Bull | +8.3% | +32.4% |
SNOW | Snowflake | Data & Analytics Platforms | 🟢 Cont. Bull | +7.4% | +23.6% |
MDB | MongoDB | Data Management & Analytics | 🟢 Cont. Bull | −8.1% | +27.1% |
NOW | ServiceNow | Specialized Enterprise Solutions | 🔴 Cont. Bear | +10.7% | −43.9% |
PANW | Palo Alto Networks | Cybersecurity & Threat Protection | 🌱 Emerging Bull | −3.9% | +56.0% |
OKTA | Okta | Identity & Access Management | 🌱 Emerging Bull | +3.7% | +39.2% |
CRWD | CrowdStrike | Cybersecurity & Threat Protection | 🟢 Cont. Bull | −2.1% | −61.5% |
DT | Dynatrace | Other | 🌱 Emerging Bull | −0.8% | −19.8% |
AKAM | Akamai Technologies | Network & Application Delivery | 🟢 Cont. Bull | −1.8% | +40.2% |
TOST | Toast | Point-of-Sale & Hospitality | 🔴 Cont. Bear | +14.8% | −33.9% |
PLTR | Palantir Technologies | AI & Data Intelligence | ⚠️ Emerging Bear | +6.8% | −21.8% |
ZS | Zscaler | AI & Data Intelligence | 🔴 Cont. Bear | +10.2% | −47.5% |
FTNT | Fortinet | Network Security Appliances | 🌱 Emerging Bull | −3.5% | +43.0% |
| Compared against · context, not the story | |||||
TENB | Tenable | Cybersecurity & Threat Protection | 🌱 Emerging Bull | −6.3% | −5.4% |
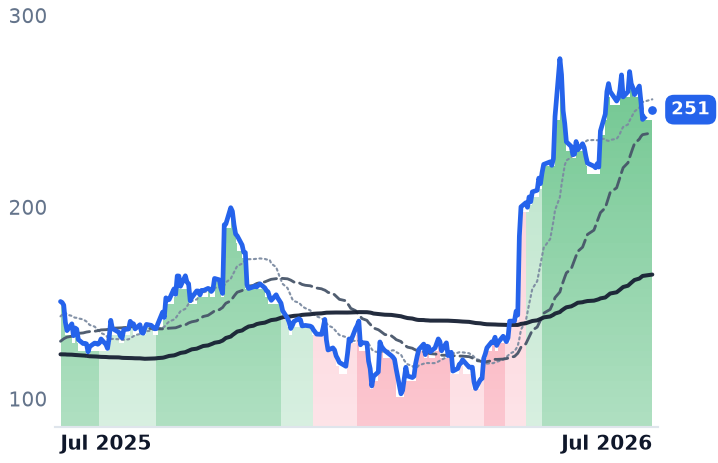
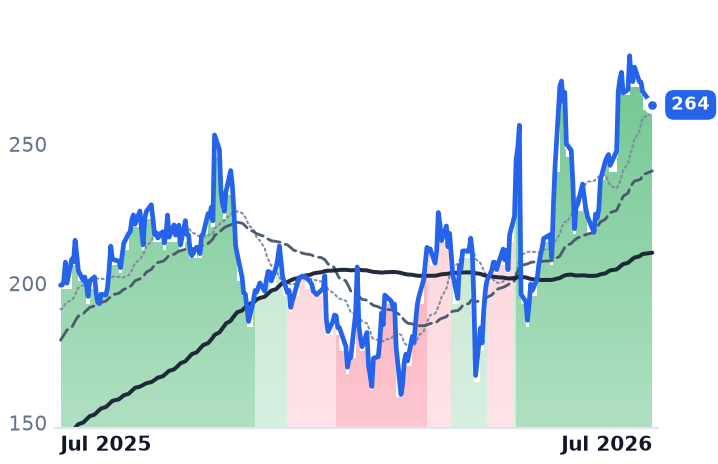
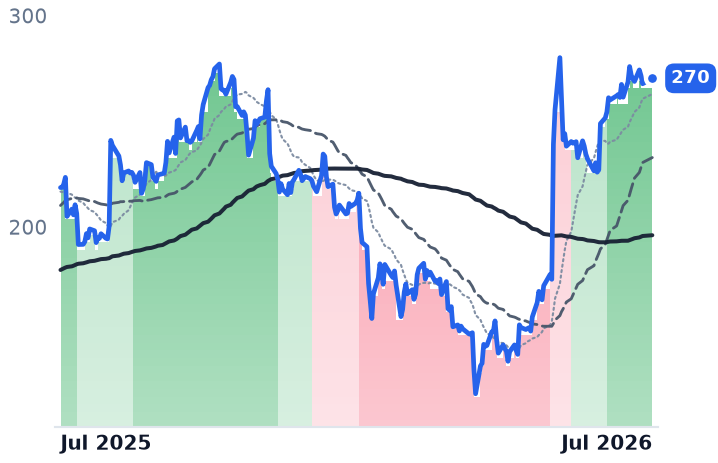
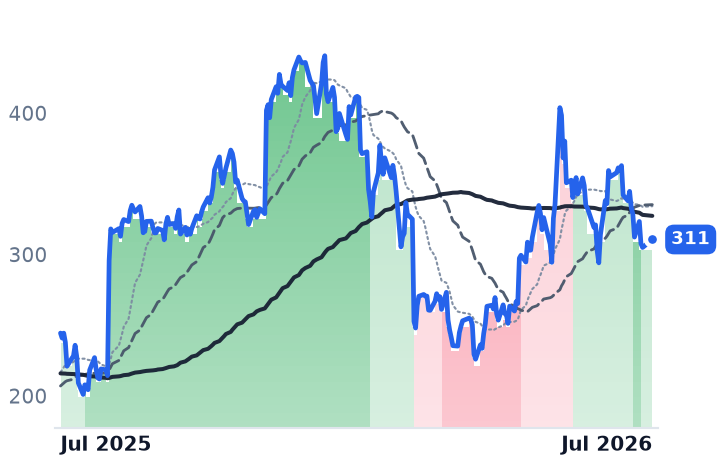
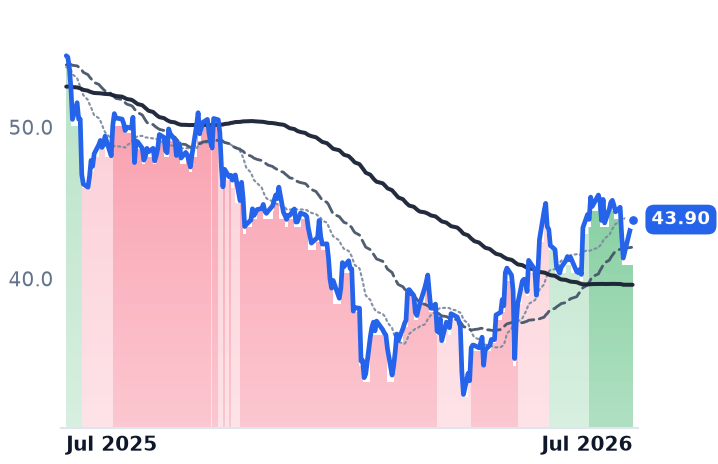
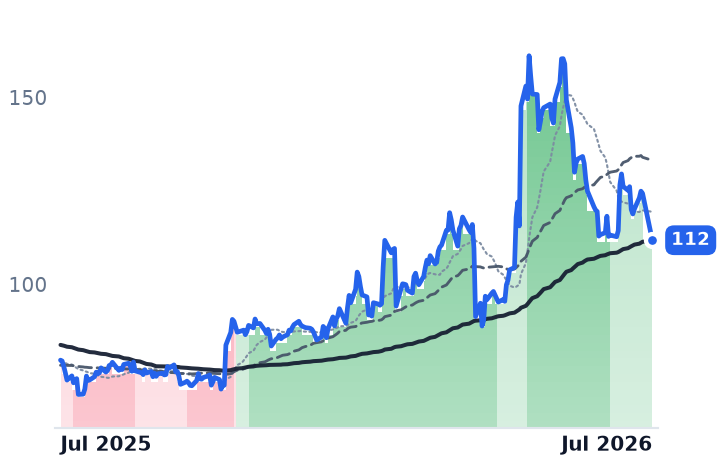
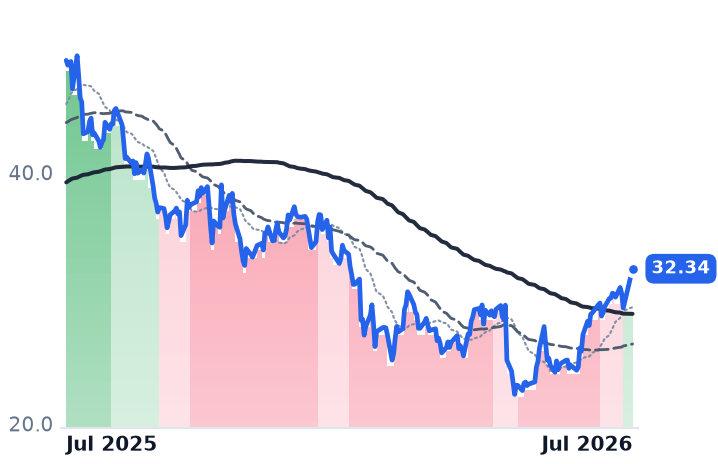
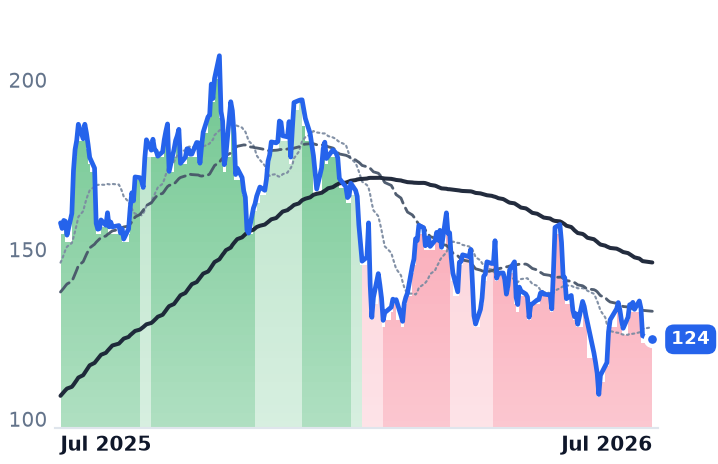
12-month price & trend
| Ticker | Mkt cap | P/E | P/E fwd | P/S | P/S fwd | P/GP | P/GP fwd | EV/EBITDA | FCF yld |
|---|---|---|---|---|---|---|---|---|---|
DDOG | $88.0B | 497.4x | 101.3x | 22.2x | 20.1x | 27.9x | 25.3x | 337.6x | 1.3% |
NET | $109.0B | n/m | 256.6x | 43.4x | 38.8x | 59.8x | 53.5x | — | 0.3% |
SNOW | $114.4B | n/m | 170.9x | 22.7x | 18.8x | 33.9x | 27.9x | n/m | 1.0% |
| Ticker | Mkt cap | P/E | P/E fwd | P/S | P/S fwd | P/GP | P/GP fwd | EV/EBITDA | FCF yld |
|---|---|---|---|---|---|---|---|---|---|
MDB | $35.3B | n/m | 71.7x | 13.6x | 11.9x | 18.8x | 16.5x | — | 1.7% |
NOW | $121.7B | 73.1x | 28.9x | 8.3x | 7.5x | 11.0x | 10.0x | 36.6x | 3.8% |
PANW | $313.2B | 322.9x | 93.4x | 29.5x | 22.6x | 41.0x | 31.5x | 137.3x | 1.4% |
| Ticker | Mkt cap | P/E | P/E fwd | P/S | P/S fwd | P/GP | P/GP fwd | EV/EBITDA | FCF yld |
|---|---|---|---|---|---|---|---|---|---|
OKTA | $23.8B | 102.3x | 37.2x | 7.9x | 7.4x | 10.3x | 9.6x | 65.1x | 3.8% |
CRWD | $220.9B | n/m | 176.2x | 43.4x | 37.2x | 57.8x | 49.5x | 648.9x | 0.7% |
DT | $14.3B | 96.6x | 24.8x | 6.8x | 6.2x | 8.4x | 7.6x | 43.9x | 4.0% |
| Ticker | Mkt cap | P/E | P/E fwd | P/S | P/S fwd | P/GP | P/GP fwd | EV/EBITDA | FCF yld |
|---|---|---|---|---|---|---|---|---|---|
AKAM | $16.7B | 40.6x | 17.2x | 3.9x | 3.7x | 6.9x | 6.6x | 19.1x | 3.8% |
TOST | $19.9B | 41.3x | 24.8x | 2.9x | 2.7x | 11.0x | 10.0x | 35.1x | 2.9% |
PLTR | $394.9B | 136.5x | 108.2x | 64.2x | 48.6x | 75.7x | 57.3x | 126.8x | 0.9% |
| Ticker | Mkt cap | P/E | P/E fwd | P/S | P/S fwd | P/GP | P/GP fwd | EV/EBITDA | FCF yld |
|---|---|---|---|---|---|---|---|---|---|
ZS | $29.7B | n/m | 40.1x | 9.4x | 7.6x | 12.2x | 9.9x | 251.1x | 3.2% |
FTNT | $117.4B | 55.9x | 46.8x | 15.6x | 14.5x | 19.4x | 18.1x | 39.7x | 2.7% |
TENB | $2.4B | n/m | 11.0x | 2.3x | 2.2x | 3.0x | 2.8x | 23.3x | 11.1% |
Consensus projections
| Ticker | FY2026E | FY2027E | FY2028E | |
|---|---|---|---|---|
DDOG | Revenue | +28.9% | +21.5% | +23.5% |
| EPS | +20.9% | +17.3% | +23.1% | |
NET | Revenue | +31.0% | +27.9% | +27.4% |
| EPS | +31.0% | +32.8% | +38.3% | |
SNOW | Revenue | +29.4% | +30.9% | +25.7% |
| EPS | +72.3% | +59.4% | +41.1% | |
MDB | Revenue | +23.1% | +21.6% | +17.9% |
| EPS | +59.1% | +27.1% | +19.6% | |
NOW | Revenue | +22.4% | +18.7% | +18.6% |
| EPS | +17.1% | +23.2% | +21.4% | |
PANW | Revenue | +24.3% | +21.1% | +14.1% |
| EPS | +15.3% | +9.0% | +17.6% | |
OKTA | Revenue | +12.0% | +10.0% | +9.5% |
| EPS | +24.3% | +11.7% | +10.8% | |
CRWD | Revenue | +22.2% | +23.7% | +21.8% |
| EPS | −1.2% | +32.6% | +26.5% | |
DT | Revenue | +18.9% | +15.5% | +14.8% |
| EPS | +22.8% | +17.7% | +15.3% | |
AKAM | Revenue | +7.4% | +11.0% | +10.4% |
| EPS | −5.0% | +6.5% | +11.1% | |
TOST | Revenue | +21.7% | +18.3% | +17.4% |
| EPS | +34.7% | +24.7% | +24.2% | |
PLTR | Revenue | +86.1% | +49.3% | +48.2% |
| EPS | +122.1% | +42.4% | +50.3% | |
ZS | Revenue | +25.2% | +16.9% | +16.7% |
| EPS | +29.0% | +11.2% | +17.6% | |
FTNT | Revenue | +19.8% | +11.3% | +10.9% |
| EPS | +27.0% | +9.4% | +13.3% | |
TENB | Revenue | +8.4% | +7.1% | +6.9% |
| EPS | +27.0% | +10.5% | +10.1% |
Forward fiscal years only. Blank means no analyst coverage for that year.
A data artifact, not a security-spend signal
CrowdStrike underwent a first-ever 4-for-1 stock split effective for split-adjusted trading on July 2, 2026, and the unadjusted local price history around that date produces an apparent -58 to -60% "collapse" that is purely mechanical. Split-adjusted, CRWD is up roughly 69% over three months, and the session before the split, shares actually jumped alongside a Wells Fargo price-target hike and broad cybersecurity strength, with PANW and CRWD both rallying on June 29 on sector-wide momentum. That removes CRWD entirely as evidence of either company-specific weakness or a sector security-budget problem.
The real bull transitions happened weeks ago
Band-transition data shows the genuine bear-to-bull flips for DDOG, NET, PANW, OKTA, SNOW and DT clustered between May 4 and June 30 — one to three months before the current snapshot — meaning the trailing-30-day 2.3%/4.5% category gain is largely a plateau after the real move, not a fresh inflection. Those transitions are fundamentally grounded: Datadog's Q1 revenue crossed $1B for the first time, up 32% YoY, with AI-related business now over 10% of revenue and growing 100%+ annually; Snowflake posted 126% net revenue retention and remaining performance obligations up 38% YoY; and Palo Alto guided Next-Generation Security ARR to $8.90-8.95B (+59-60% YoY), with platformization economics reinforced by the CyberArk deal that closed in February. DDOG, NET and SNOW now sit within single digits of 52-week highs, leaving limited pure mean-reversion runway; PANW and OKTA trail by roughly 11-12%.
Two names never actually exited bear regimes
ServiceNow has spent nearly the entire trailing year in strongly bearish, briefly easing in June before reverting on July 9 after management cut subscription gross-margin guidance 50bps and flagged an implied second-half revenue shortfall tied to rising hyperscaler/AI costs, even after strong Q1 execution. NOW remains 44% below its 52-week high. Palantir has been continuously strongly bearish since April 21 with no recovery, sitting 40% off its high. Both are explicit members of the categories under review and were under-weighted in the original framing relative to AKAM/OKTA/CRWD. MDB and TOST also show fragility — MDB briefly touched strongly bullish on July 16 before slipping back to mildly bullish days later, and TOST only exited its bear band on July 22, six days before this snapshot.
The evidence supports a genuine quality bifurcation among consumption-driven names, but not a uniform category-wide bull exit, and not a fresh 30-day inflection.