

The wafer layer already re-rated — GlobalWafers is late-cycle, not early
Prompt v1.0
GlobalWafers is up 117% in 90 days and 272% in a year, and the whole wafer/substrate cohort moved with it — but the stock now trades ~33% above its entire 2020-25 cycle high and ~21% above the 13-analyst consensus target, while 1H26 revenue is still down 7.6% YoY. The ASP-hike story is real; the equity has already priced several years of it.
| Ticker | Company | Segment | Trend · 13mo | 30D | 1Y |
|---|---|---|---|---|---|
6488.TWO | GlobalWafers | Semiconductors | 🟢 Cont. Bull | +35.5% | +256.0% |
3436.T | Sumco | Semiconductors | 🟢 Cont. Bull | −1.4% | +207.3% |
4063.T | Shin-Etsu Chemical | Chemicals | 🟢 Cont. Bull | +1.9% | +61.1% |
WAF.DE | Siltronic | Semiconductors | 🟢 Cont. Bull | +4.7% | +90.9% |
3037.TW | Unimicron Technology | Hardware, Equipment & Parts | 🟢 Cont. Bull | −6.9% | +582.0% |
8046.TW | Nan Ya Printed Circuit Board | Hardware, Equipment & Parts | 🟢 Cont. Bull | +20.8% | +607.3% |
3189.TW | Kinsus Interconnect Technology | Semiconductors | 🟢 Cont. Bull | −1.6% | +696.0% |
AXTI | AXT | Discrete & Power | 🟢 Cont. Bull | −25.9% | +2071.3% |
MU | Micron Technology | Memory (DRAM/NAND) | 🟢 Cont. Bull | −16.2% | +763.7% |
TSM | Taiwan Semiconductor Manufacturing | Logic Foundries | 🟢 Cont. Bull | −7.4% | +75.0% |
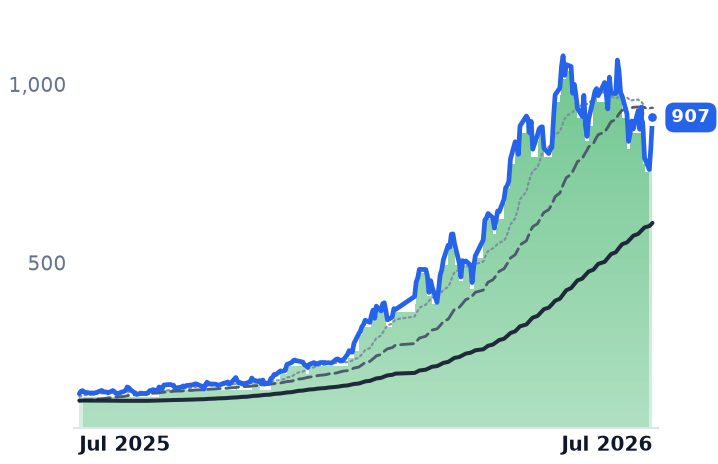
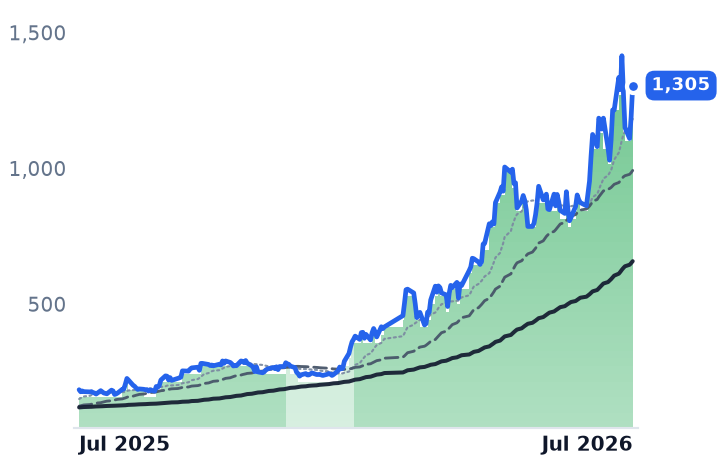
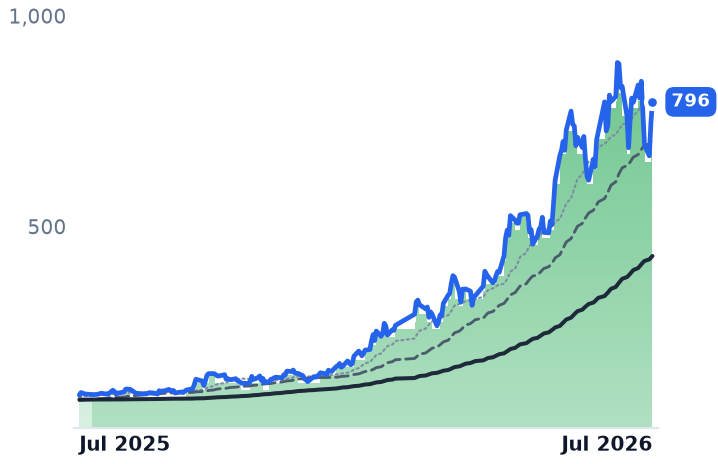
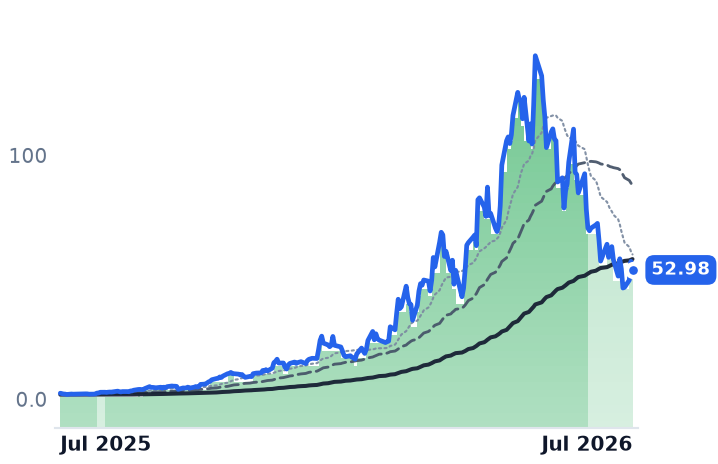
12-month price & trend
| Ticker | Mkt cap | P/E | P/E fwd | P/S | P/S fwd | P/GP | P/GP fwd | EV/EBITDA | FCF yld |
|---|---|---|---|---|---|---|---|---|---|
6488.TWO | $379.1B | 48.9x | 38.7x | 6.4x | 5.9x | 28.4x | 25.9x | 26.4x | -5.5% |
3436.T | $1.2T | n/m | — | 2.8x | 2.8x | 21.3x | 20.8x | 15.7x | 0.0% |
4063.T | $13.9T | 29.3x | 25.1x | 5.4x | 5.0x | 15.8x | 14.7x | 13.2x | 2.6% |
| Ticker | Mkt cap | P/E | P/E fwd | P/S | P/S fwd | P/GP | P/GP fwd | EV/EBITDA | FCF yld |
|---|---|---|---|---|---|---|---|---|---|
WAF.DE | $2.7B | n/m | — | 2.0x | 2.1x | 88.0x | 89.1x | 13.5x | -5.9% |
3037.TW | $1.4T | 127.5x | 65.5x | 10.2x | 8.0x | 67.4x | 52.7x | 46.5x | -0.5% |
8046.TW | $611.9B | 314.8x | 84.2x | 15.2x | 10.8x | 168.1x | 118.9x | 68.2x | 0.1% |
| Ticker | Mkt cap | P/E | P/E fwd | P/S | P/S fwd | P/GP | P/GP fwd | EV/EBITDA | FCF yld |
|---|---|---|---|---|---|---|---|---|---|
3189.TW | $259.4B | 140.5x | 53.9x | 6.6x | 5.1x | 31.2x | 24.2x | 24.4x | 0.7% |
AXTI | $4.5B | — | 103.5x | 35.8x | 20.6x | 111.3x | 64.1x | 342.4x | -0.6% |
MU | $1.0T | 19.9x | 12.2x | 11.2x | 7.8x | 15.4x | 10.7x | 14.5x | 2.6% |
| Ticker | Mkt cap | P/E | P/E fwd | P/S | P/S fwd | P/GP | P/GP fwd | EV/EBITDA | FCF yld |
|---|---|---|---|---|---|---|---|---|---|
TSM | $2.1T | 30.5x | — | 14.3x | — | 23.1x | — | 19.4x | 1.7% |
Consensus projections
| Ticker | FY2026E | FY2027E | FY2028E | |
|---|---|---|---|---|
6488.TWO | Revenue | +6.0% | +19.5% | +13.8% |
| EPS | +34.7% | +35.8% | +32.9% | |
3436.T | Revenue | +3.5% | +7.6% | +5.6% |
| EPS | +32.2% | −219.7% | +93.5% | |
4063.T | Revenue | +0.2% | +7.7% | +5.9% |
| EPS | −6.5% | +14.0% | +12.7% | |
WAF.DE | Revenue | −3.3% | +11.3% | +11.3% |
| EPS | +227.5% | −34.2% | −59.6% | |
3037.TW | Revenue | +34.9% | +37.6% | +36.8% |
| EPS | +286.4% | +102.3% | +72.4% | |
8046.TW | Revenue | +41.5% | +40.5% | +50.9% |
| EPS | +324.5% | +134.6% | +87.5% | |
3189.TW | Revenue | +28.8% | +29.3% | +36.9% |
| EPS | +184.0% | +83.8% | +84.8% | |
AXTI | Revenue | +140.9% | +111.3% | +47.0% |
| EPS | −306.1% | +158.9% | +48.5% | |
MU | Revenue | +248.0% | +92.8% | +11.4% |
| EPS | +804.9% | +111.2% | +7.9% | |
TSM | Revenue | +38.0% | +27.0% | +22.6% |
| EPS | +54.5% | +25.3% | +21.6% |
Forward fiscal years only. Blank means no analyst coverage for that year.
The premise is stale
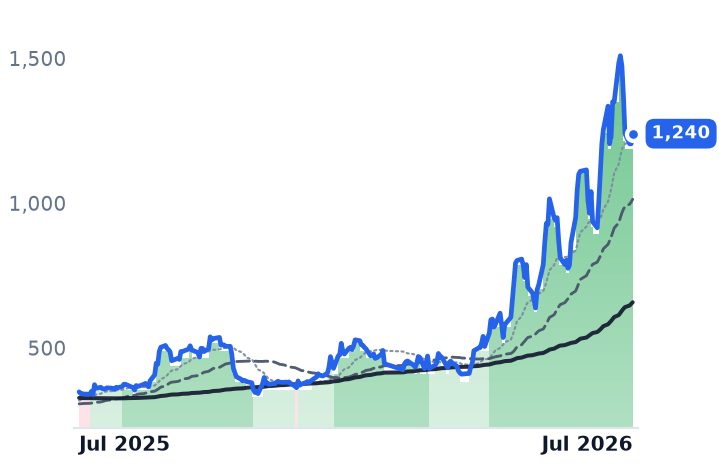
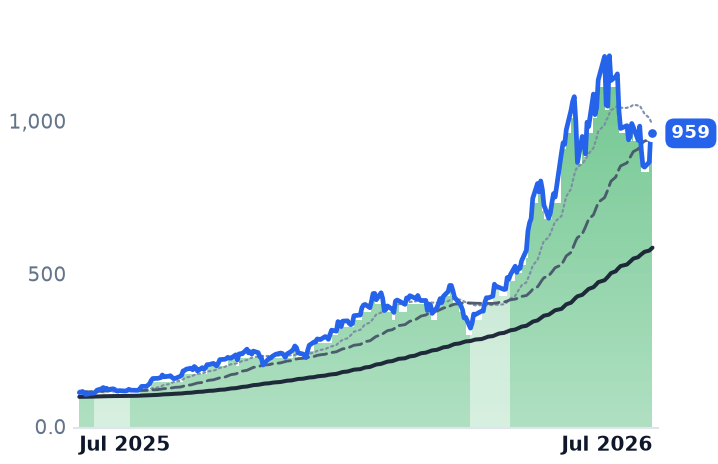
GlobalWafers (6488.TWO) is not in a quiet month-long grind higher. It peaked at TWD 1,515 on 14 July and fell 18.2% in the six sessions to 22 July on heavy volume (6.7m–12.6m shares), closing at TWD 1,240. That leaves it +11% over 30 days but +117% over 90 days, +135% over 180 days and +272% over twelve months. The move happened; it happened in the spring, not the last four weeks.
Breadth exists — pointing the other way
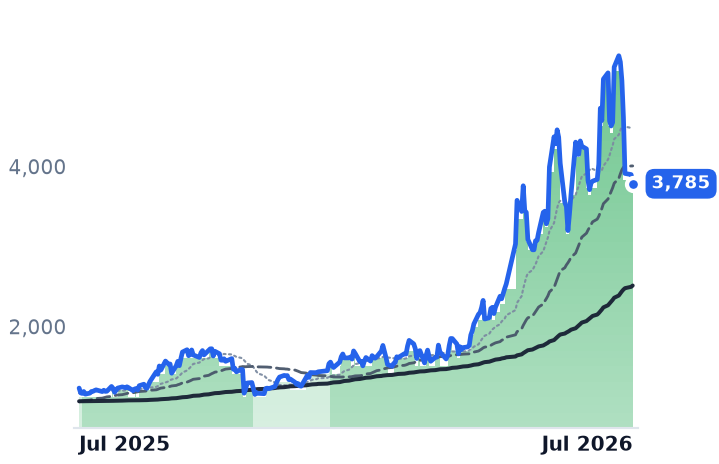
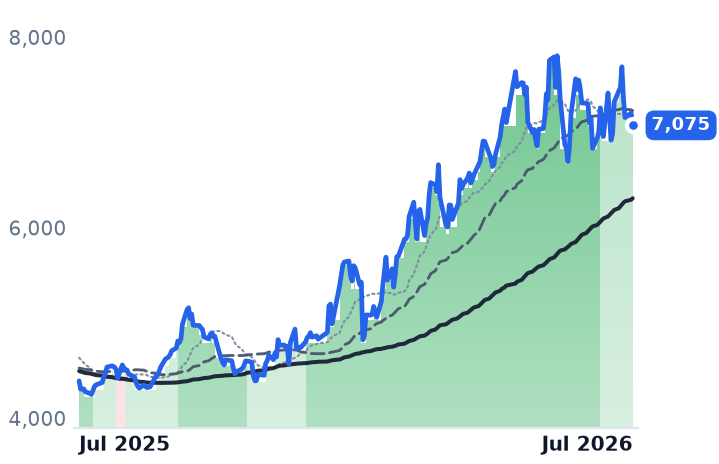
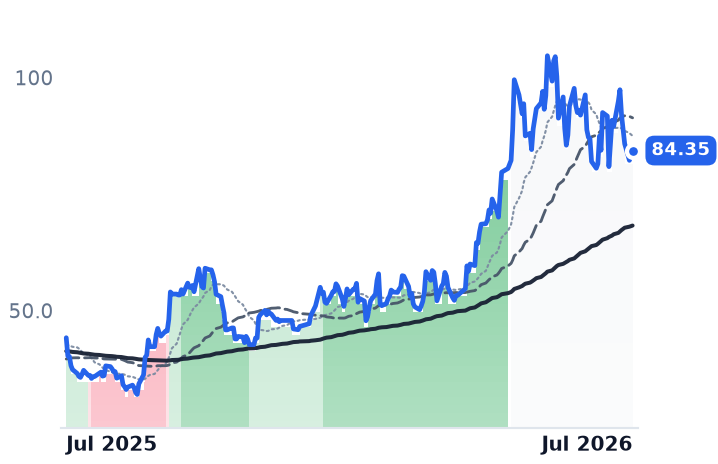
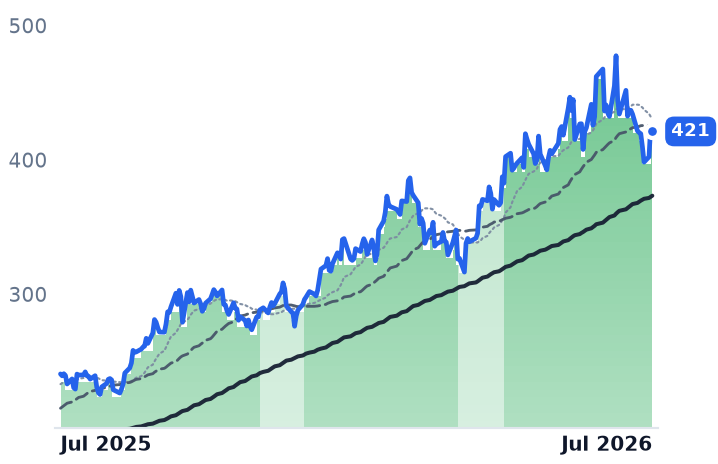
The cohort re-rated in unison over 90 days: SUMCO +75%, Kinsus +66%, Nan Ya PCB +64%, Unimicron +25%, Siltronic +19%, Shin-Etsu +6%. It is now correcting in unison — every name sits in a drawdown from a Q2/Q3-2026 peak (AXT −62%, SUMCO −30%, Micron −21%, Siltronic −19%). Trend bands show extension, not exit-from-bear: 6488.TWO, SUMCO, Nan Ya PCB, Micron and TSMC all read strongly bullish, while Unimicron, Shin-Etsu and AXT have already been downgraded to mildly bullish. The July leg is sector-wide — Taiwan stocks fell into a technical correction after TSMC's results stoked spending and margin worries, with the SOX closing more than 20% below its late-June high.
Cycle position inverts the thesis
The hypothesis wants names still below prior-cycle highs. GlobalWafers' best close across 2020-2025 was TWD 935 — it now trades ~33% above that. SUMCO is +33% above, Nan Ya PCB +108%, Unimicron +257%. Only Siltronic remains ~5% below. The 13-analyst consensus target of TWD 1,021 implies roughly 18% downside, with 3 sells against 8 buys.
The fundamentals are real but lag badly
All three Taiwanese suppliers have signalled further H2-2026 price increases, building on TrendForce's January call that 8-inch prices would rise 20%. GlobalWafers says 12-inch lines are fully loaded with Asia capacity booked, though chairwoman Doris Hsu framed the push as cost-driven, not demand-driven. Memory capex is genuinely routing upstream: Micron committed up to $500m plus a 10-year supply agreement to the Sherman, Texas fab, inside a plan to lift US spending to $250bn. SEMI logged Q1 wafer shipments +13.1% YoY but −4.7% QoQ and called the recovery "not uniform."
The P&L agrees. Q1 2026 revenue fell 10.3% YoY at a 20.8% gross margin with operating income −43%; Q2 revenue was −4.96% YoY and 1H26 −7.6%. Annual operating margin has slid from 29.3% (2022) to 14.3% (2025). Siltronic still guides FY2026 sales below 2025, and SUMCO missed Q1 and guides a ~2% operating margin with long-term contract prices merely maintained. At TWD 1,240 that is ~76x trailing and ~60x FY26 consensus EPS.