

ADP's Payroll Clients Barely Hired. Its Profit Growth Is Coming From Bond Yields.
Hypothesis Opus 5 · Research Opus 5 · Writing Opus 5 · Prompt v1.5
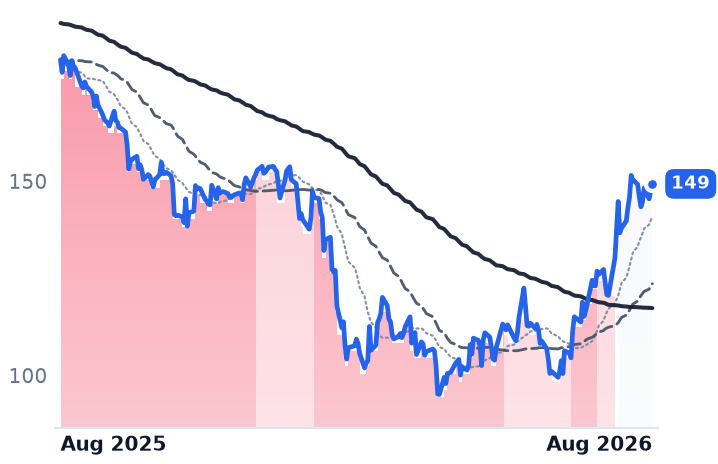
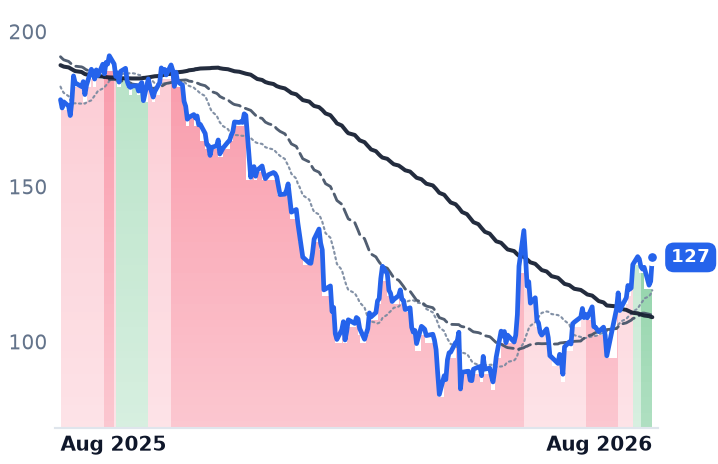
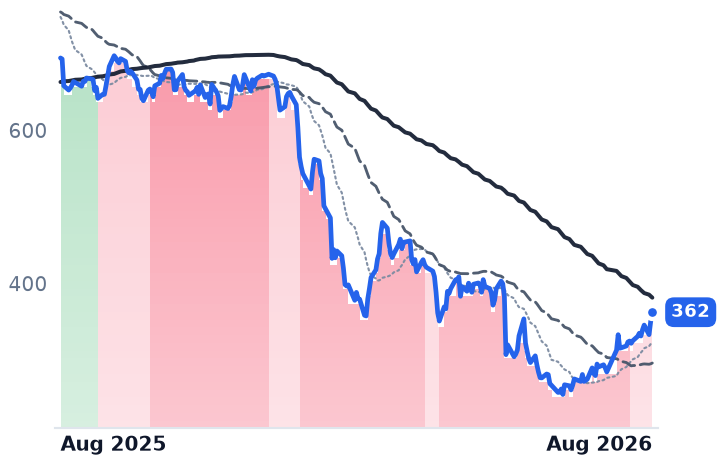
Automatic Data Processing bills employers for every person on their payroll, which should make it the cleanest read available on hiring. The read is flat: US pays per control grew 1% in fiscal 2026, and management guides 0-1% for fiscal 2027. What is growing is the interest ADP earns on the client payroll cash it holds before disbursement — up 14% to $1.35bn last year, guided to about $1.55bn this year on balances averaging $40.4bn. That increment is worth roughly 84 basis points of margin, essentially the whole 70-90 points of profit-margin expansion management guided. The earnings growth is a rates position, not an employment one, and the 30-year Treasury just printed a 19-year high. Alongside it, Paycom is monetising cost cuts and buybacks rather than seats, and Workday's month is a take-private report rather than a business event, with results due 27 August.
| Ticker | Company | Segment | Trend · 13mo | 30D | 1Y |
|---|---|---|---|---|---|
| The subject · what this brief is about | |||||
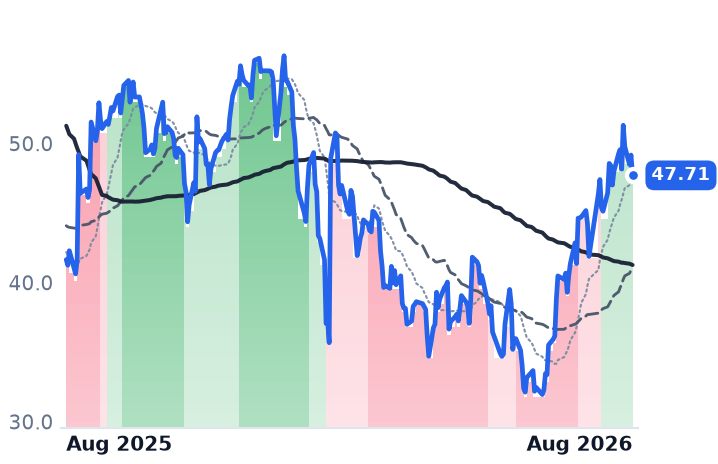
ADP | Automatic Data Processing | HCM Software & Payroll | 🌱 Emerging Bull | +12.6% | −8.5% |
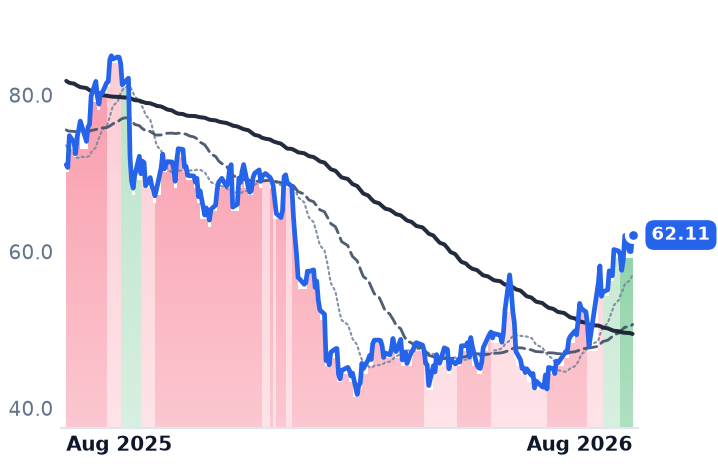
PAYC | Paycom Software | HR & Workforce Management | 🌱 Emerging Bull | +54.0% | −1.5% |
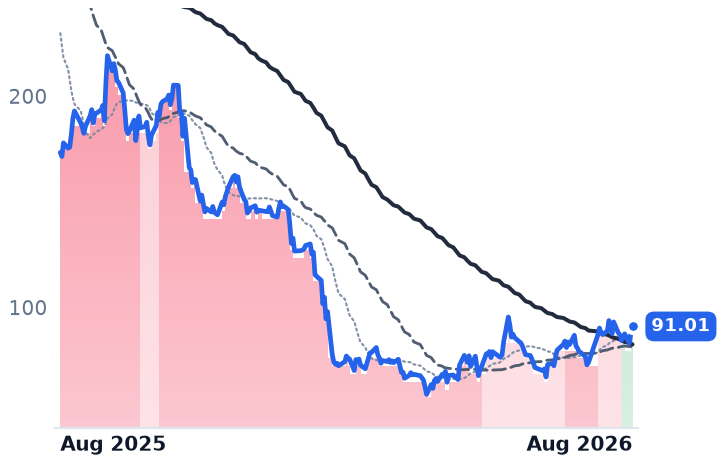
WDAY | Workday | Enterprise Resource Planning | 🌱 Emerging Bull | +40.6% | −12.8% |
| Compared against · context, not the story | |||||
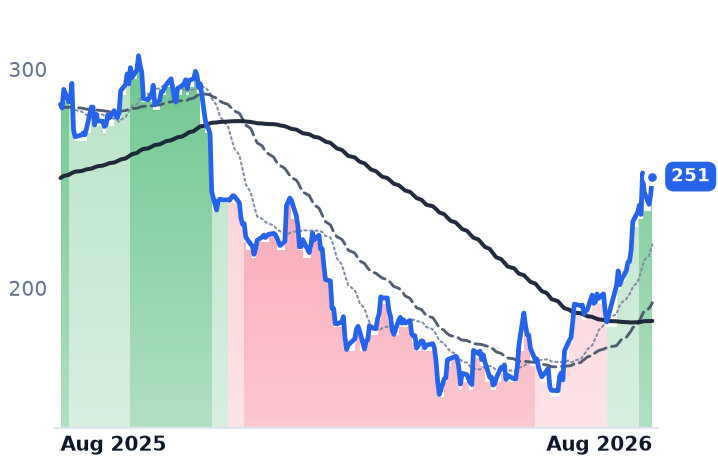
PAYX | Paychex | HCM Software & Payroll | 🌱 Emerging Bull | +10.6% | −8.9% |
PCTY | Paylocity | HR & Workforce Management | 🔴 Cont. Bear | +20.5% | −17.6% |
NOW | ServiceNow | Specialized Enterprise Solutions | 🔴 Cont. Bear | +24.6% | −28.6% |
INTU | Intuit | Enterprise Resource Planning | 🔴 Cont. Bear | +25.0% | −47.8% |
VEEV | Veeva Systems | Life Sciences Software & Data | 🌱 Emerging Bull | +32.6% | −11.6% |
BILL | Bill.com | Fintech & Digital Finance | ⚠️ Emerging Bear | +7.8% | +14.5% |
DOCU | DocuSign | Specialized Enterprise Solutions | 🌱 Emerging Bull | +22.4% | −12.6% |
MNDY | monday.com | Other | 🔴 Cont. Bear | +24.9% | −47.5% |
ZM | Zoom Communications | Communications & Collaboration | 🟢 Cont. Bull | +19.7% | +48.9% |
DBX | Dropbox | Data Management & Analytics | 🌱 Emerging Bull | +15.5% | +19.6% |
TEAM | Atlassian | Developer Tools & DevOps | 🔴 Cont. Bear | +92.3% | +4.6% |
NVDA | NVIDIA | AI & Data Center GPUs | 🟢 Cont. Bull | +6.3% | +25.6% |
IBM | International Business Machines | IT Infrastructure & Operations | ⚠️ Emerging Bear | +12.7% | −0.4% |
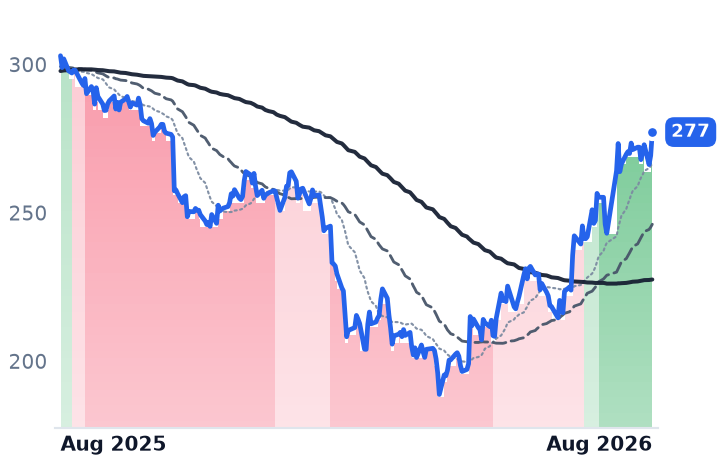
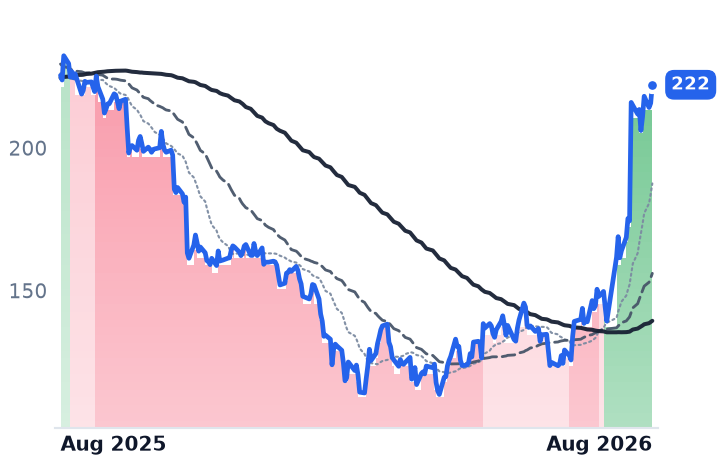
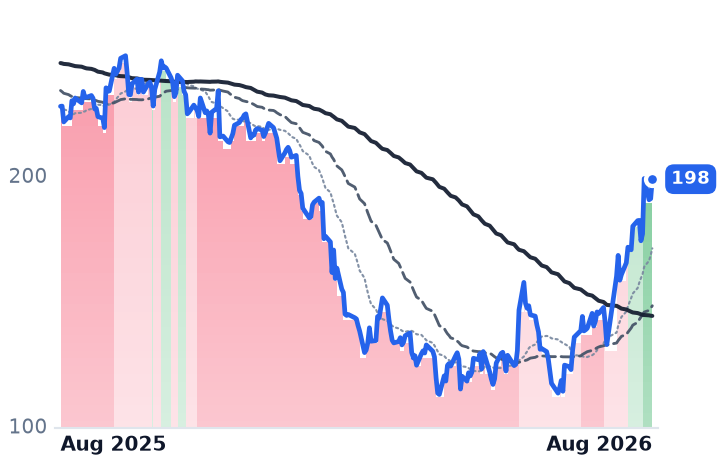
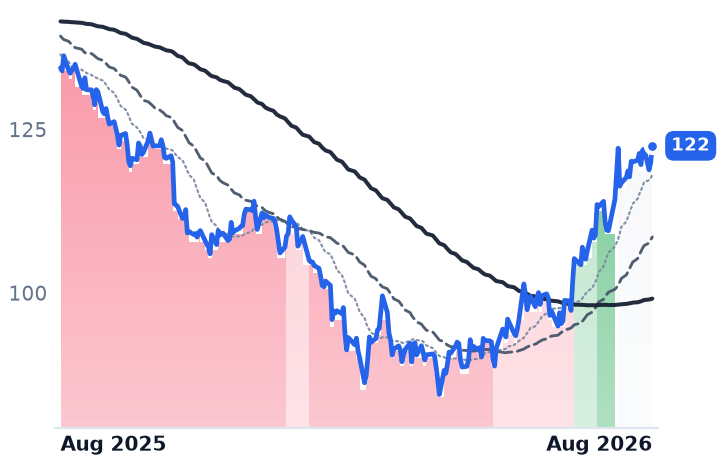
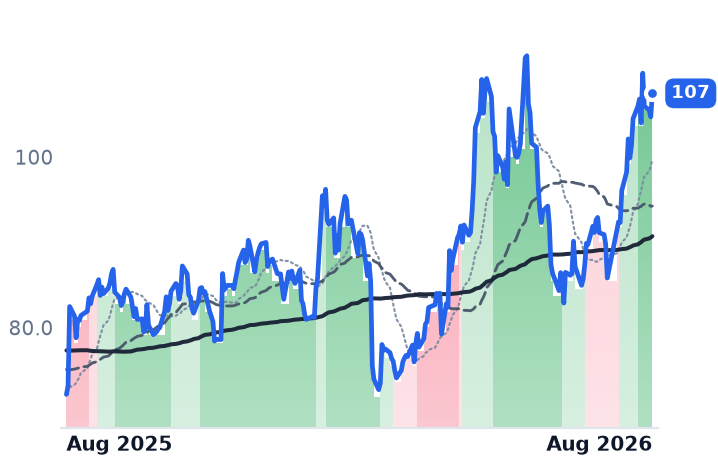
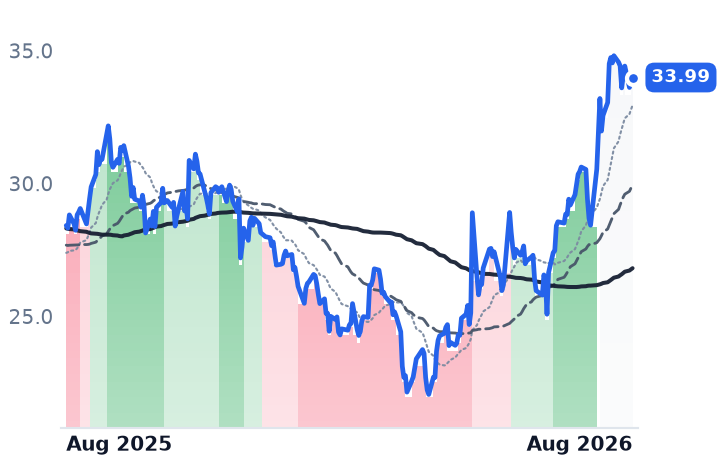
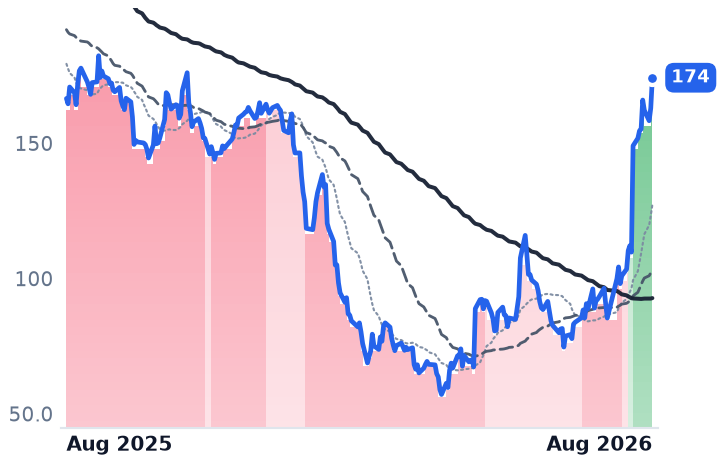
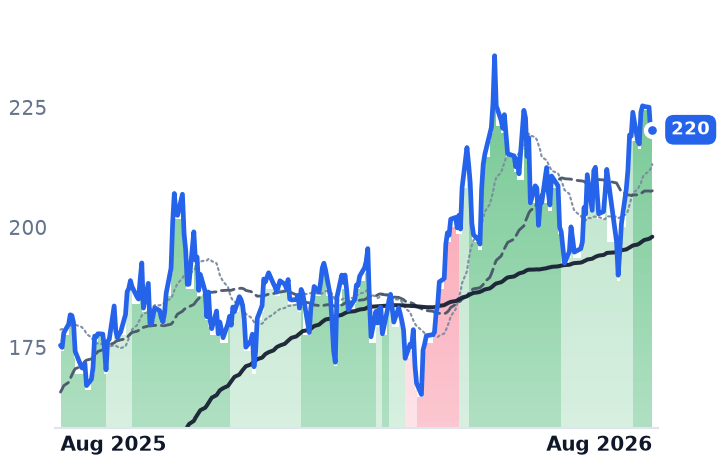
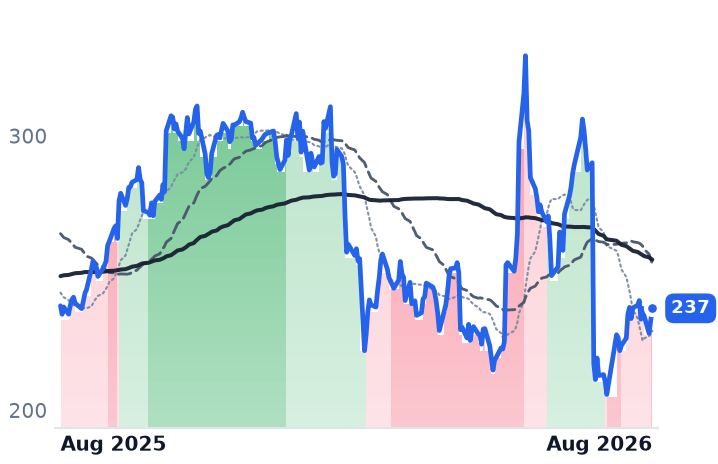
12-month price & trend
| Ticker | Mkt cap | P/E | P/E fwd | P/S | P/S fwd | P/GP | P/GP fwd | EV/EBITDA | FCF yld |
|---|---|---|---|---|---|---|---|---|---|
ADP | $110.8B | 25.3x | 22.6x | 5.0x | 4.8x | 10.5x | 9.9x | 17.6x | 4.5% |
PAYC | $10.0B | 23.6x | 18.4x | 4.7x | 4.5x | 5.8x | 5.7x | 12.0x | 7.5% |
WDAY | $52.0B | 61.6x | 18.4x | 5.3x | 4.9x | 7.0x | 6.4x | 33.0x | 5.7% |
| Ticker | Mkt cap | P/E | P/E fwd | P/S | P/S fwd | P/GP | P/GP fwd | EV/EBITDA | FCF yld |
|---|---|---|---|---|---|---|---|---|---|
PAYX | $32.8B | 20.1x | 16.7x | 5.2x | 5.0x | 7.0x | 6.8x | 12.8x | 6.6% |
PCTY | $8.0B | 29.9x | 16.9x | 4.5x | 4.2x | 6.5x | 6.1x | 15.7x | 5.6% |
NOW | $121.7B | 73.1x | 28.9x | 8.3x | 7.5x | 11.0x | 10.0x | 36.6x | 3.8% |
| Ticker | Mkt cap | P/E | P/E fwd | P/S | P/S fwd | P/GP | P/GP fwd | EV/EBITDA | FCF yld |
|---|---|---|---|---|---|---|---|---|---|
INTU | $89.0B | 19.7x | 11.9x | 4.3x | 3.7x | 5.2x | 4.6x | 13.0x | 8.7% |
VEEV | $39.4B | 42.1x | 26.8x | 11.9x | 10.8x | 15.9x | 14.4x | 29.0x | 4.2% |
BILL | $4.8B | n/m | 14.2x | 2.9x | 2.6x | 3.6x | 3.2x | 49.9x | 8.9% |
| Ticker | Mkt cap | P/E | P/E fwd | P/S | P/S fwd | P/GP | P/GP fwd | EV/EBITDA | FCF yld |
|---|---|---|---|---|---|---|---|---|---|
DOCU | $11.5B | 38.4x | 13.3x | 3.5x | 3.3x | 4.4x | 4.1x | 17.2x | 9.7% |
MNDY | $4.7B | 39.8x | 20.3x | 3.6x | 3.2x | 4.1x | 3.6x | 51.1x | 6.4% |
ZM | $31.5B | 15.5x | 17.8x | 6.4x | 6.2x | 8.3x | 8.0x | 11.0x | 6.2% |
| Ticker | Mkt cap | P/E | P/E fwd | P/S | P/S fwd | P/GP | P/GP fwd | EV/EBITDA | FCF yld |
|---|---|---|---|---|---|---|---|---|---|
DBX | $8.7B | 18.7x | 11.1x | 3.4x | 3.4x | 4.3x | 4.3x | 13.4x | 11.1% |
TEAM | $44.8B | n/m | 28.0x | 6.8x | 6.1x | 8.0x | 7.2x | 296.5x | 2.9% |
NVDA | $5.5T | 34.3x | 25.0x | 21.5x | 13.9x | 29.0x | 18.7x | 28.3x | 2.2% |
| Ticker | Mkt cap | P/E | P/E fwd | P/S | P/S fwd | P/GP | P/GP fwd | EV/EBITDA | FCF yld |
|---|---|---|---|---|---|---|---|---|---|
IBM | $222.5B | 20.6x | 19.2x | 3.2x | 3.2x | 5.5x | 5.4x | 17.3x | 6.6% |
Consensus projections
| Ticker | FY2026E | FY2027E | FY2028E | |
|---|---|---|---|---|
ADP | Revenue | +7.0% | +5.9% | +5.7% |
| EPS | +11.0% | +10.6% | +9.3% | |
PAYC | Revenue | +7.7% | +7.1% | +8.4% |
| EPS | +30.8% | +14.6% | +9.8% | |
WDAY | Revenue | +13.4% | +11.8% | +11.0% |
| EPS | +26.5% | +18.6% | +17.3% | |
PAYX | Revenue | +16.5% | +5.4% | +5.4% |
| EPS | +10.1% | +7.6% | +6.5% | |
PCTY | Revenue | +11.1% | +7.5% | +7.6% |
| EPS | +15.4% | +9.0% | +9.7% | |
NOW | Revenue | +22.4% | +18.7% | +18.6% |
| EPS | +17.1% | +23.2% | +21.4% | |
INTU | Revenue | +13.9% | +11.3% | +10.8% |
| EPS | +18.5% | +15.0% | +12.6% | |
VEEV | Revenue | +16.3% | +15.1% | +12.0% |
| EPS | +22.7% | +14.1% | +10.7% | |
BILL | Revenue | +13.2% | +12.2% | +12.0% |
| EPS | +26.0% | +27.2% | +20.5% | |
DOCU | Revenue | +8.4% | +8.9% | +7.6% |
| EPS | +6.9% | +19.5% | +12.6% | |
MNDY | Revenue | +19.8% | +16.1% | +16.1% |
| EPS | +7.0% | +21.4% | +10.9% | |
ZM | Revenue | +4.2% | +4.8% | +4.0% |
| EPS | +9.7% | +1.3% | +4.0% | |
DBX | Revenue | +0.3% | −0.0% | −0.3% |
| EPS | +8.5% | +8.3% | +18.4% | |
TEAM | Revenue | +24.7% | +13.4% | +15.9% |
| EPS | +55.5% | +10.5% | +18.0% | |
NVDA | Revenue | +65.1% | +84.2% | +43.2% |
| EPS | +59.0% | +91.7% | +42.0% | |
IBM | Revenue | +5.0% | +3.9% | +5.1% |
| EPS | +8.4% | +6.8% | +8.6% |
Forward fiscal years only. Blank means no analyst coverage for that year.
When a company runs payroll through Automatic Data Processing, the cash leaves the employer's account days before it lands in employees' accounts. ADP holds it in between, and invests it. For most of the past two decades that float was a rounding line in a story about employment growth. In fiscal 2026 it became the story.
ADP reported its year on 29 July. Employer Services revenue, the payroll and benefits business, grew 7%, on new bookings of $2.2bn and record client retention of 92.1% — it now loses fewer than eight clients in a hundred each year. But the volume metric that ties revenue to hiring barely moved. US pays per control, the count of employees on client payrolls ADP bills for, grew 1% in the fourth quarter and for the full year, and the company guided fiscal 2027 to 0-1%. The professional employer arm, which co-employs staff at smaller firms, ended the year with 775,000 average worksite employees, up 2%, and its margin contracted 110 basis points.
The float is the margin
Interest on funds held for clients rose 14% to about $1.35bn, on average balances of $40.4bn and a yield up to 3.4% from 3.2%. Management guided that line to $1.54-1.56bn for fiscal 2027, on a yield of 3.7%. Set the roughly $195m increment against the $23.1bn revenue base implied by the 5-6% growth guide and it is worth about 84 basis points of margin — against the 70-90 basis points of adjusted operating-margin expansion the company guided. Float income carries almost no cost to serve, which is why $1.35bn equalled 6.2% of last year's $21.95bn of revenue but roughly 31% of its $4.41bn of net income.
The rate backdrop is doing the work. The 30-year Treasury yield touched 5.323% on 18 August, its highest since 2007. ADP shares rose 1.1% that session and 2.9% the next. The employment backdrop is doing the opposite: ADP's own National Employment Report showed private payrolls adding just 44,000 jobs in July, the weakest since January.
Paycom cut its way to the same place
Paycom, which sells a single-database payroll and human-capital platform to small and mid-sized US employers, reported second-quarter revenue up 9.8% to $531.2m. Operating margin went from 23.2% to 31.7% — sourced not from volume but from more than $100m of annual research savings after moving workloads into its own data centers, plus a $30m-plus cut in third-party AI token fees. Diluted shares fell 18.5% year over year, which is how 20% net-income growth became 48% earnings-per-share growth. On the call, management described client employment as stable with no acceleration. Full-year revenue guidance of 7-8% compares with 23.2% growth in 2023, and consensus models 7.1% for 2027. Paycom competes against ADP Workforce Now, Dayforce and UKG in a market where scale sits with ADP's million-plus employers; its answer is product velocity — a 45th product shipped in July — rather than price.
Workday's month has no numbers in it
Workday, the large-enterprise human-resources and financials suite, has disclosed nothing operational since 21 May, when it reported subscription revenue up 14.3% and a 12-month subscription backlog of $8.806bn, up 15.5% — committed spend running slightly ahead of the 12-13% full-year guide. Its shares are up about 35% in a month anyway. Two sessions explain it: the late-July software rally after Nvidia's Jensen Huang said of AI disruption fears that "the markets got it wrong", and 14 August, when Reuters reported that Silver Lake is in talks to take Workday private at up to $43bn. The stock rose 12.5% on 8.2m shares, roughly six times its recent norm. Strip those sessions and the month is slightly negative. At a $51.97bn market value, the shares already sit about 17% above the reported deal price.
What the multiples say
Gross margins differ too much for revenue multiples to compare — 83.2% at Paycom, 76.2% at Workday, 53.0% at ADP in the latest quarter — so price against forward gross profit is the usable lens. Workday trades at 6.43x, against roughly 4.19x three months ago and 7.37x a year ago. Paycom is at 5.66x versus about 3.08x six months ago and 5.78x a year ago: the de-rating has essentially been undone. ADP, at 9.91x forward gross profit and 22.6x forward earnings, is the only one of the three still below its year-ago level of about 11.04x — and the only one whose recent results contain new operating numbers.
The setup
Where it stands — Payroll volumes across all three are flat; the profit growth on offer comes from interest rates, cost cuts and buybacks. Would confirm — ADP fiscal 2027 float income tracking to the guided $1.54-1.56bn while pays per control stays at 0-1%. Would invalidate — Pays-per-control growth re-accelerating above 1%, or ADP raising margin guidance without help from the yield. Watch next — Workday reports fiscal second-quarter results on 27 August, its first disclosure since 21 May. Valuation — ADP 9.91x forward gross profit versus 10.48x trailing and 11.04x a year ago; Workday 6.43x versus 4.19x in May.