

Memory's synchronized top: CXMT's debut adds a supply shock to the unwind
Prompt v1.0
Nine Asia- and US-listed memory/AI-component names all topped between 27 May and 25 June 2026 and fell together — 009150.KS is down 40.7% from its high but still +900% over twelve months and 98% above its 200-day average. The de-rating is a multiple unwind on record fundamentals, with China's CXMT IPO now adding a genuine supply-side worry on top.
| Ticker | Company | Segment | Trend · 13mo | 30D | 1Y |
|---|---|---|---|---|---|
009150.KS | Samsung Electro-Mechanics | Hardware, Equipment & Parts | 🟢 Cont. Bull | −45.3% | +711.7% |
005930.KS | Samsung Electronics | Consumer Electronics | 🟢 Cont. Bull | −31.9% | +216.1% |
000660.KS | SK hynix | Semiconductors | 🟢 Cont. Bull | −41.0% | +494.0% |
2454.TW | MediaTek | Semiconductors | 🟢 Cont. Bull | −14.7% | +141.4% |
3037.TW | Unimicron Technology | Hardware, Equipment & Parts | 🟢 Cont. Bull | −21.6% | +474.4% |
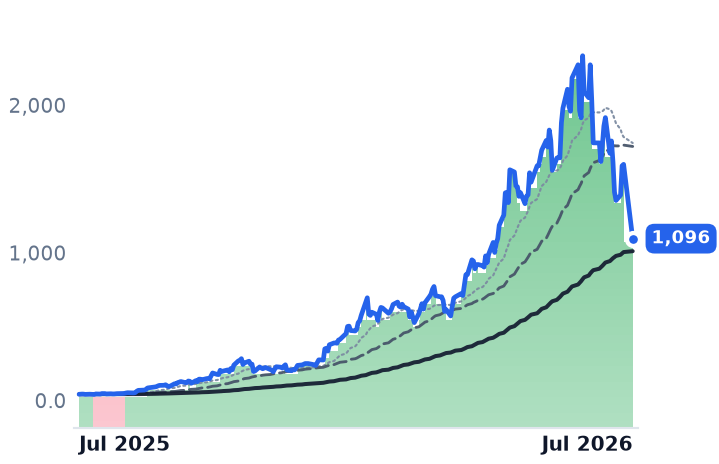
285A.T | Kioxia | Hardware, Equipment & Parts | 🟢 Cont. Bull | −49.6% | +1715.4% |
5801.T | Furukawa Electric | Electrical Equipment & Parts | 🟢 Cont. Bull | −31.9% | −62.4% |
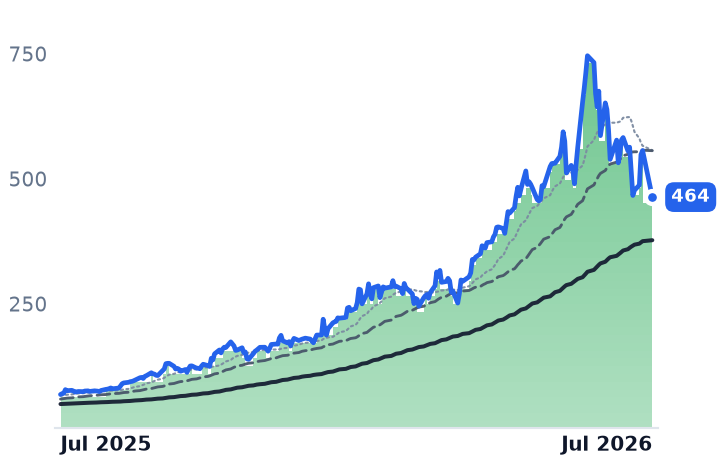
MU | Micron Technology | Memory (DRAM/NAND) | 🟢 Cont. Bull | −28.3% | +638.6% |
SNDK | Sandisk | Specialty Manufacturing & Components | 🟢 Cont. Bull | −46.5% | +2516.6% |
WDC | Western Digital | Data Storage Devices | 🟢 Cont. Bull | −28.9% | +573.5% |
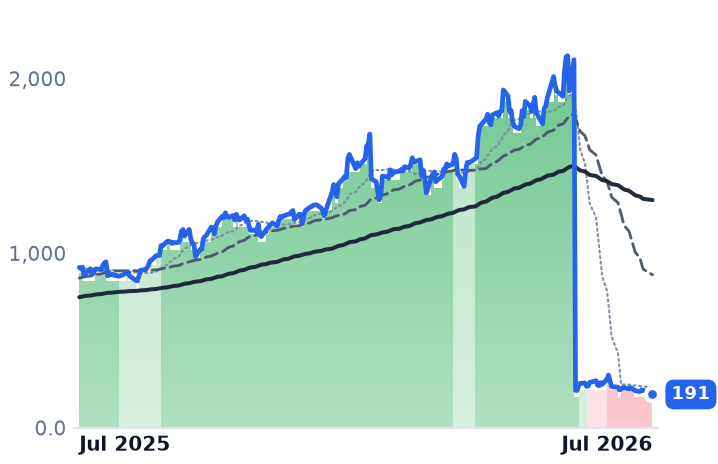
KLAC | KLA | Semiconduct Equipment | ⚠️ Emerging Bear | −31.5% | −79.2% |
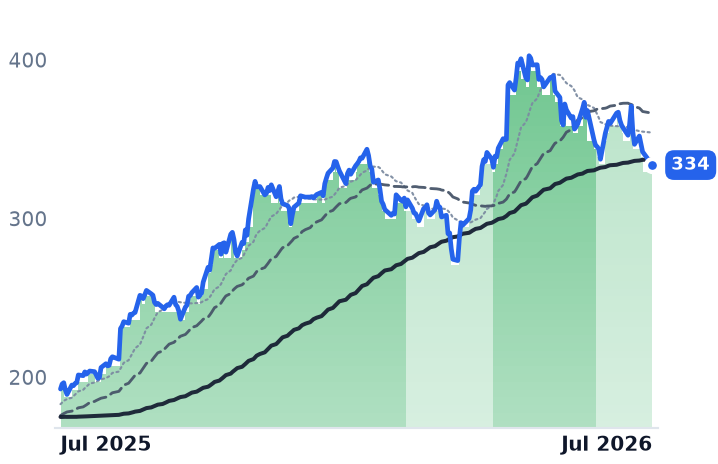
GOOGL | Alphabet | Search & Advertising | 🟢 Cont. Bull | −5.6% | +73.3% |
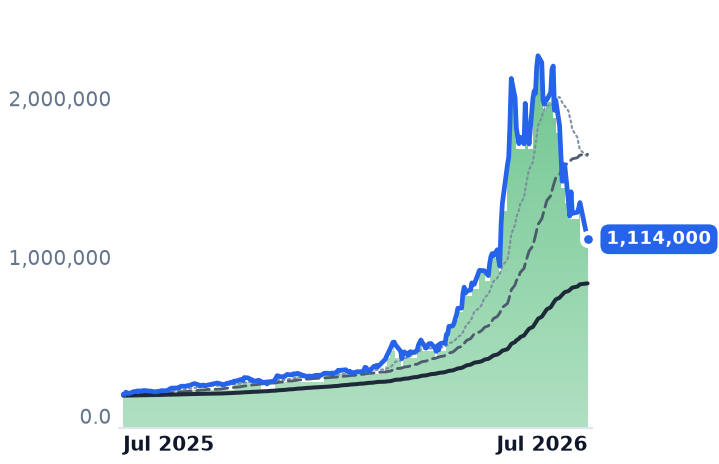
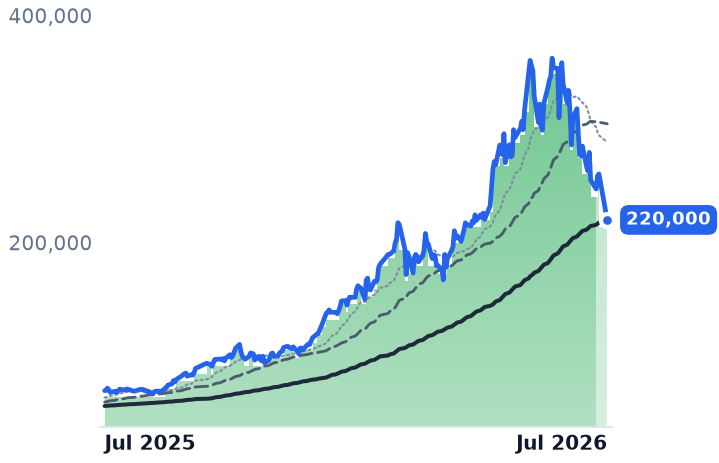
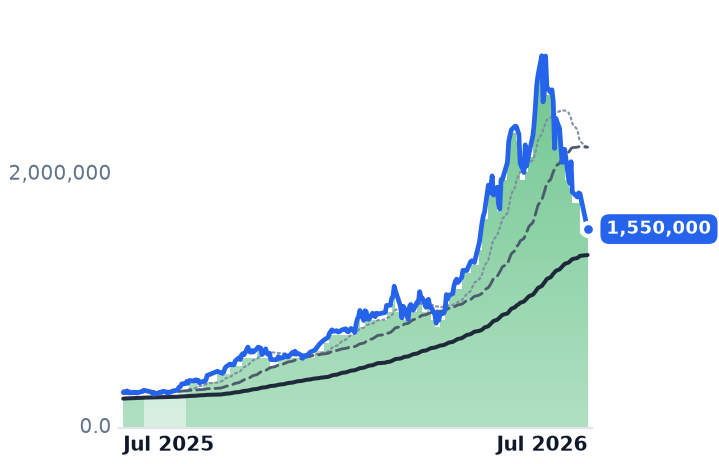
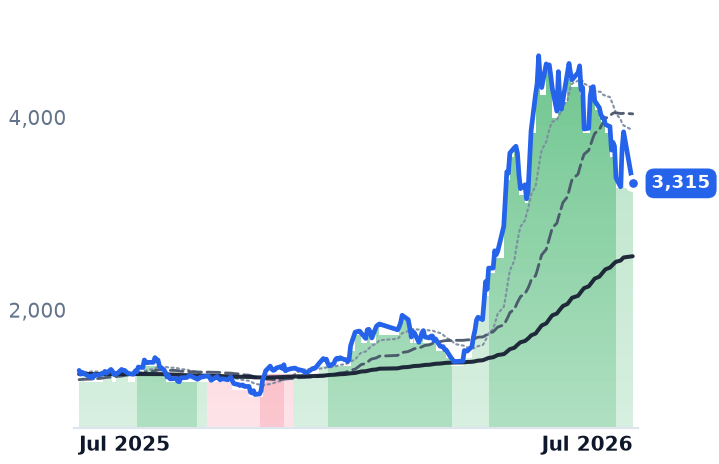
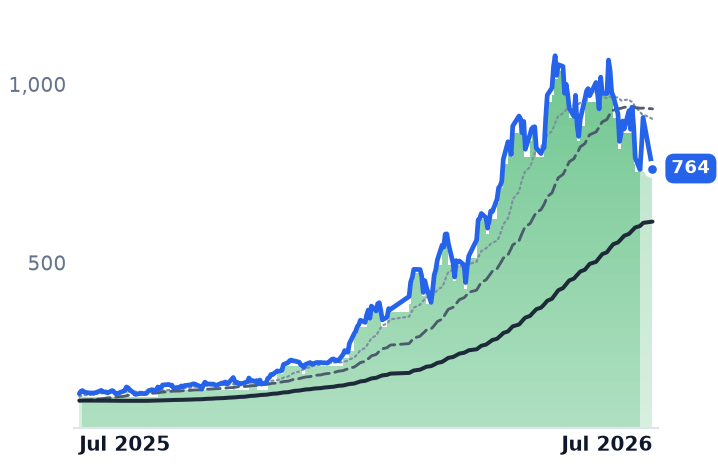
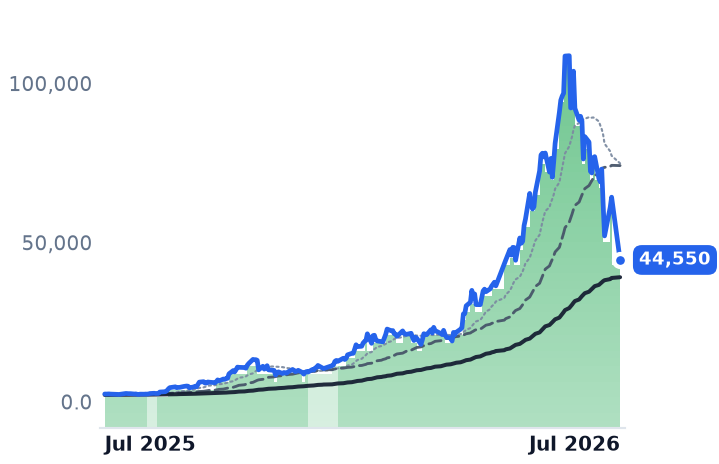
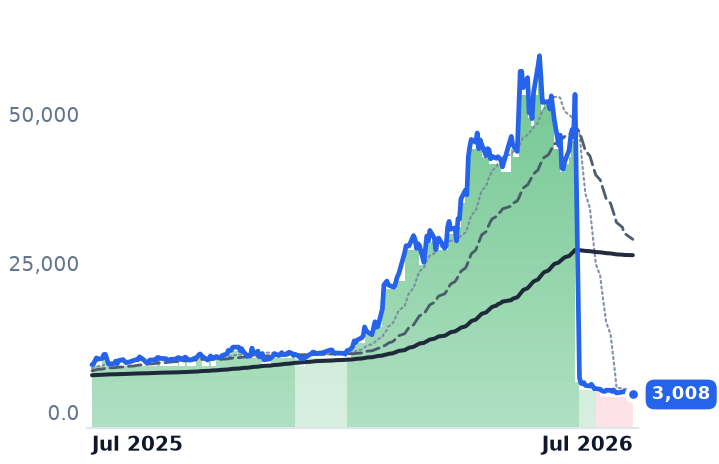
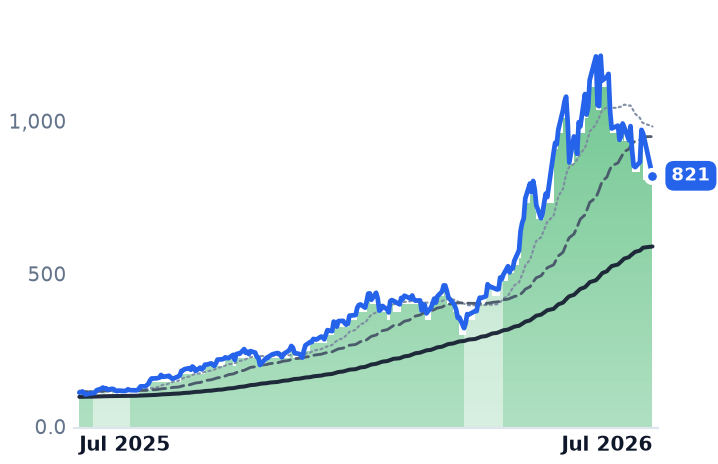
12-month price & trend
| Ticker | Mkt cap | P/E | P/E fwd | P/S | P/S fwd | P/GP | P/GP fwd | EV/EBITDA | FCF yld |
|---|---|---|---|---|---|---|---|---|---|
009150.KS | $65.7T | 85.1x | 52.9x | 5.6x | 4.9x | 37.2x | 32.6x | 37.1x | 0.4% |
005930.KS | $1800.1T | 22.0x | 7.0x | 4.6x | 2.8x | 17.8x | 10.8x | 13.9x | 2.0% |
000660.KS | $1135.3T | 15.5x | 6.1x | 8.6x | 3.6x | 12.6x | 5.3x | 11.8x | 3.6% |
| Ticker | Mkt cap | P/E | P/E fwd | P/S | P/S fwd | P/GP | P/GP fwd | EV/EBITDA | FCF yld |
|---|---|---|---|---|---|---|---|---|---|
2454.TW | $5.5T | 54.8x | 52.1x | 9.2x | 8.4x | 20.0x | 18.3x | 42.1x | 2.0% |
3037.TW | $1.4T | 127.5x | 65.5x | 10.2x | 8.0x | 67.4x | 52.7x | 46.5x | -0.5% |
285A.T | $23.7T | 140.8x | 8.3x | 14.1x | 3.9x | 54.5x | 15.2x | 39.1x | 0.6% |
| Ticker | Mkt cap | P/E | P/E fwd | P/S | P/S fwd | P/GP | P/GP fwd | EV/EBITDA | FCF yld |
|---|---|---|---|---|---|---|---|---|---|
5801.T | $3.2T | 61.2x | 47.7x | 2.5x | 2.3x | 14.8x | 13.7x | 36.8x | 0.0% |
MU | $1.0T | 19.9x | 12.2x | 11.2x | 7.8x | 15.4x | 10.7x | 14.5x | 2.6% |
SNDK | $208.5B | 46.2x | 21.8x | 15.8x | 10.6x | 28.2x | 19.0x | 37.1x | 2.1% |
| Ticker | Mkt cap | P/E | P/E fwd | P/S | P/S fwd | P/GP | P/GP fwd | EV/EBITDA | FCF yld |
|---|---|---|---|---|---|---|---|---|---|
WDC | $166.1B | 25.6x | 48.3x | 14.1x | 12.9x | 31.1x | 28.4x | 31.1x | 1.7% |
KLAC | $268.8B | 55.9x | 37.5x | 19.8x | 14.8x | 32.3x | 24.2x | 47.4x | 1.4% |
GOOGL | $4.2T | 17.2x | 17.1x | 9.4x | 8.5x | 15.4x | 13.9x | 13.0x | 1.3% |
Consensus projections
| Ticker | FY2026E | FY2027E | FY2028E | |
|---|---|---|---|---|
009150.KS | Revenue | +19.5% | +18.9% | +19.0% |
| EPS | +92.3% | +53.9% | +30.8% | |
005930.KS | Revenue | +93.0% | +19.5% | +7.5% |
| EPS | +521.0% | +25.1% | +5.2% | |
000660.KS | Revenue | +225.0% | +34.1% | +9.7% |
| EPS | +373.8% | +29.8% | +6.7% | |
2454.TW | Revenue | +9.0% | +48.5% | +41.9% |
| EPS | −1.4% | +78.4% | +59.9% | |
3037.TW | Revenue | +34.9% | +37.6% | +36.8% |
| EPS | +286.4% | +102.3% | +72.4% | |
285A.T | Revenue | +33.2% | +168.7% | +20.3% |
| EPS | +96.3% | +452.8% | +24.1% | |
5801.T | Revenue | +8.8% | +5.9% | +10.2% |
| EPS | +84.6% | +27.5% | +33.6% | |
MU | Revenue | +248.0% | +92.8% | +11.4% |
| EPS | +804.9% | +111.2% | +7.9% | |
SNDK | Revenue | +169.2% | +113.5% | +7.0% |
| EPS | +2283.0% | +167.8% | +5.6% | |
WDC | Revenue | +36.9% | +37.2% | +26.5% |
| EPS | +106.2% | +72.8% | +48.0% | |
KLAC | Revenue | +12.2% | +33.9% | +19.0% |
| EPS | +14.5% | +47.8% | +21.0% | |
GOOGL | Revenue | +23.7% | +22.5% | +19.0% |
| EPS | +90.3% | −25.8% | +18.1% |
Forward fiscal years only. Blank means no analyst coverage for that year.
One top, nine names
This is not an idiosyncratic Samsung Electro-Mechanics story. Every live name in the cohort peaked inside a four-week window: 2454.TW and 3037.TW on 27 May; 005930.KS and WDC on 18 June; 009150.KS on 19 June; 000660.KS and Kioxia (285A.T) on 22 June; MU and SNDK on 25 June. Drawdowns from those highs as of the 22 July close ran 285A.T -40.9%, 009150.KS -40.7%, 000660.KS -37.3%, SNDK -31.5%, 005930.KS -28.1%, WDC -25.4%, MU -20.9%, with the Taiwan pair down 16-17%.
The shape is violent, not gradual. 009150.KS printed seven sessions of 8%+ declines between 23 June and 22 July, including -14.9% on 13 July — interspersed with a +12.1% rebound. The dated Asia trigger was 2 July, when a Wall Street chip rout forced a rare KOSPI trading halt as SK Hynix fell ~14.6%. By 7 July the group had crossed into technical bear-market territory, with roughly $1.5 trillion of semiconductor market value erased since 25 June.
The demand legs didn't crack
Every fundamental input the bear case needed went the other way. TrendForce's 3 July update still has 3Q26 DRAM and NAND contract prices rising, NAND +10-15% QoQ, merely decelerating. HBM4 pricing is set to roughly double next year, mid-$500s per stack versus mid-$300s for HBM3E. Alphabet raised 2026 capex to $195-205bn on 22 July — the 7% stock drop was about spending more, not less — and Amazon, Meta and Microsoft face the same scrutiny this week. SK Hynix's 29 July print is expected to be a record on both revenue and operating profit. 009150.KS itself, up 756% in 1H26 and guided to 93% YoY Q2 operating profit growth, won a ₩295.1bn AI-server MLCC contract on 23 July.
What is genuinely new
On 27 July China's ChangXin Memory debuted on the STAR Market up ~470% after an $8.6bn raise, the mainland's largest listing since 2010. That is a supply-side event, and it landed: SanDisk fell 12%, Micron 5% and SK Hynix ADRs 6% on 28 July on fears of Chinese commodity-DRAM capacity. Kioxia is now over 60% below its June record and reports 31 July.
Two cautions on the tape. Furukawa (5801.T, -91%) and KLA (-88%) are 10-for-1 split artifacts, not crashes. And band data through 22 July still shows 009150.KS, 000660.KS, 285A.T, MU, SNDK and WDC in unbroken strongly bullish, every cohort name 39-105% above its 200-day average — readings the post-cutoff selling has likely already stale-dated. Morgan Stanley's Joseph Moore called the decline a "compelling entry point" on 20 July; the Desk's own May notes flagged that a capex-digestion signal could trigger a 30-50% de-rate across the AI hardware complex. Neither has been settled.