

Regulated Utilities' AI Rally Holds as Merchant Power Cracks, But Multiples Are Stretched
Hypothesis Opus 5 · Research Sonnet 5 · Writing Sonnet 5 · Prompt v1.1
The 25-member vertically integrated utilities group is up a broad-based ~8.7% over the past year on real, upgraded data-center capex and rate-base growth at AEP, Dominion, Entergy and Duke — but trailing multiples of 20x-30x sit well above the sector's own 16.8x long-run median, and a uniform 30-day, ~5% pullback tracks rising Treasury yields and regulatory backlash rather than any crack in the underlying business.
| Ticker | Company | Segment | Trend | 30D | 1Y |
|---|---|---|---|---|---|
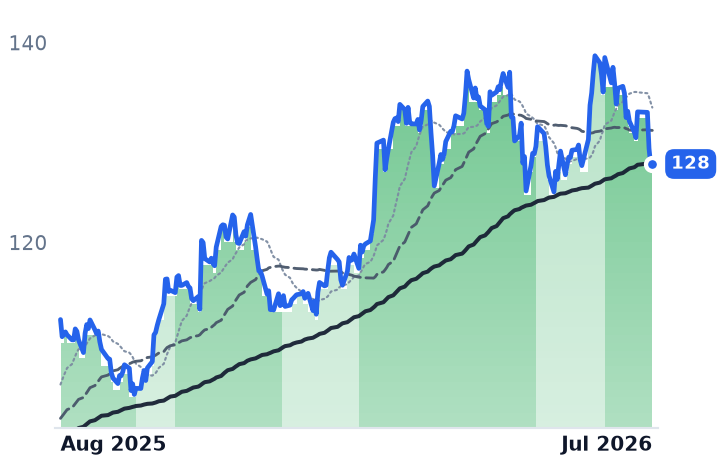
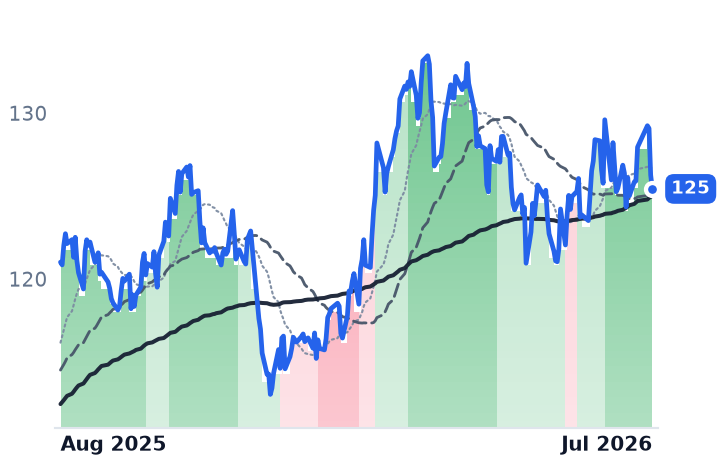
AEP | American Electric Power | Vertically Integrated Utilities | 🟢 Cont. Bull | −6.0% | +13.9% |
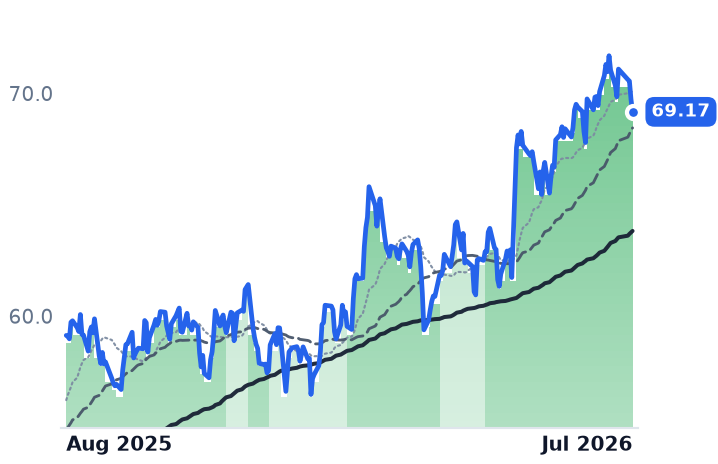
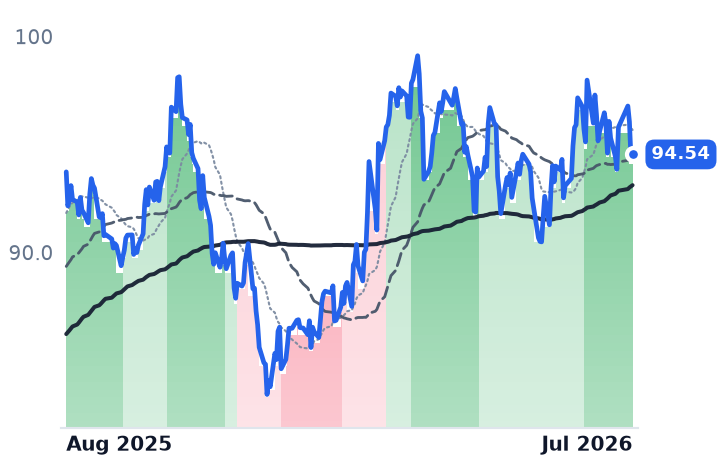
D | Dominion Energy | Vertically Integrated Utilities | 🟢 Cont. Bull | −0.1% | +17.0% |
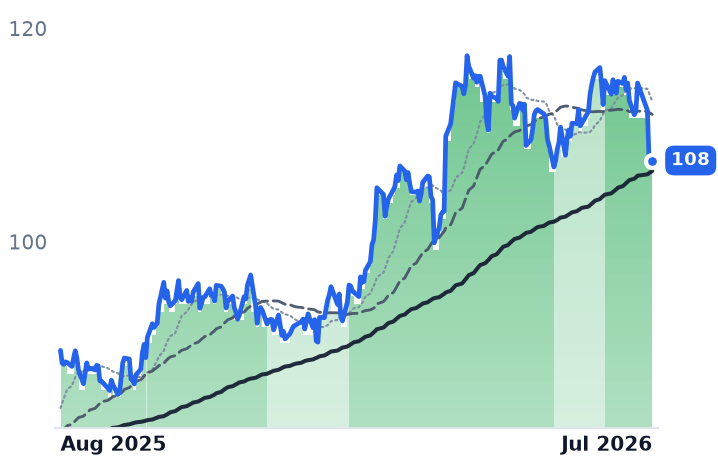
ETR | Entergy | Vertically Integrated Utilities | 🟢 Cont. Bull | −5.5% | +19.8% |
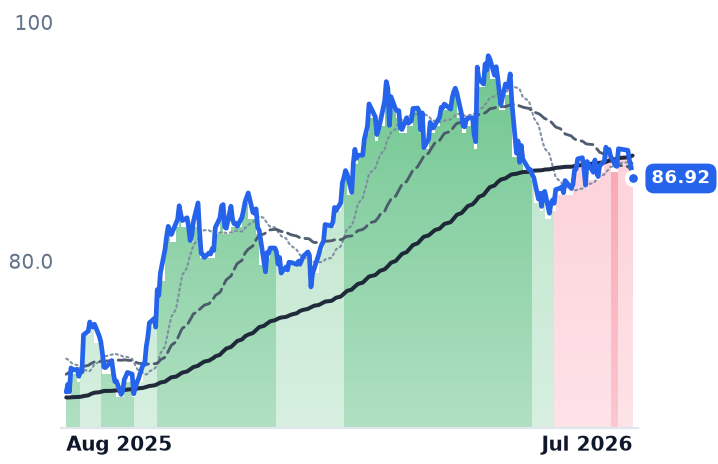
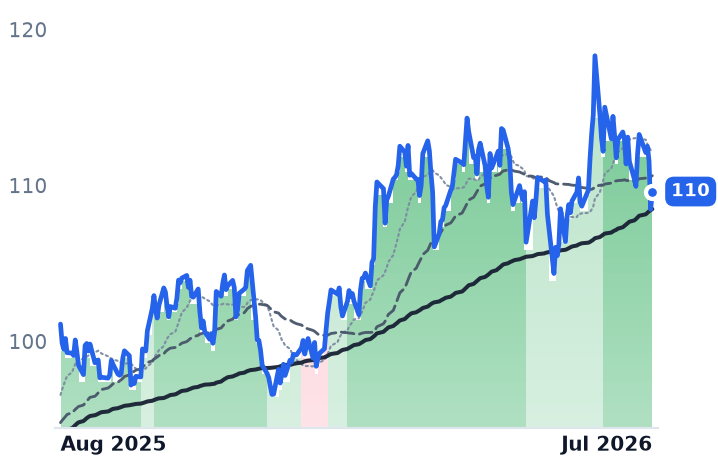
NEE | NextEra Energy | Vertically Integrated Utilities | ⚠️ Emerging Bear | −0.6% | +25.9% |
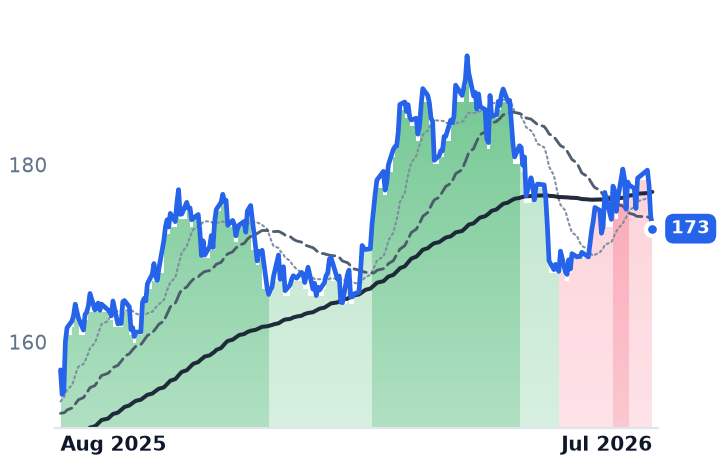
DUK | Duke Energy | Vertically Integrated Utilities | 🟢 Cont. Bull | −0.4% | +3.6% |
SO | The Southern | Vertically Integrated Utilities | 🟢 Cont. Bull | −1.5% | +0.9% |
AEE | Ameren | Vertically Integrated Utilities | 🟢 Cont. Bull | −3.0% | +8.4% |
ATO | Atmos Energy | Natural Gas Distribution | ⚠️ Emerging Bear | −0.6% | +10.2% |
AVA | Avista | US Electric & Gas Utilities | 🟢 Cont. Bull | −0.5% | +9.9% |
CMS | CMS Energy | Vertically Integrated Utilities | 🟢 Cont. Bull | −5.6% | −1.4% |
CNP | CenterPoint Energy | US Electric & Gas Utilities | 🟢 Cont. Bull | −4.5% | +9.2% |
DTE | DTE Energy | Vertically Integrated Utilities | 🟢 Cont. Bull | −6.3% | +3.3% |
ED | Consolidated Edison | Vertically Integrated Utilities | 🌱 Emerging Bull | −2.8% | +6.7% |
EIX | Edison International | Regional/International Utilities | 🟢 Cont. Bull | −0.8% | +38.5% |
ES | Eversource Energy | Vertically Integrated Utilities | 🟢 Cont. Bull | −2.2% | +11.3% |
FE | FirstEnergy | Vertically Integrated Utilities | ⚠️ Emerging Bear | +1.3% | +13.5% |
IDA | IDACORP | Vertically Integrated Utilities | 🟢 Cont. Bull | −5.4% | +16.1% |
LNT | Alliant Energy | Vertically Integrated Utilities | 🟢 Cont. Bull | −7.6% | +9.2% |
NI | NiSource | Natural Gas Distribution | 🟢 Cont. Bull | −5.6% | +3.9% |
PEG | Public Service Enterprise Group Incorporated | Vertically Integrated Utilities | ⚠️ Emerging Bear | −5.1% | −12.9% |
PNW | Pinnacle West Capital | Vertically Integrated Utilities | 🟢 Cont. Bull | −5.5% | +12.7% |
POR | Portland General Electric | Vertically Integrated Utilities | 🟢 Cont. Bull | −5.1% | +21.0% |
PPL | PPL | Transmission & Distribution Only | ⚠️ Emerging Bear | −2.5% | −0.4% |
WEC | WEC Energy | Vertically Integrated Utilities | 🟢 Cont. Bull | −6.2% | +0.8% |
XEL | Xcel Energy | Vertically Integrated Utilities | 🟢 Cont. Bull | −2.7% | +7.8% |
CWEN | Clearway Energy | Wind & Solar Developers | ⚠️ Emerging Bear | −4.1% | +1.0% |
BEP | Brookfield Renewable Partners | Diversified Renewable Generators | 🟢 Cont. Bull | −2.8% | +26.6% |
BWXT | BWX Technologies | Naval & Shipbuilding | ⚠️ Emerging Bear | −14.3% | +9.6% |
CCJ | Cameco | Uranium | ⚠️ Emerging Bear | −11.4% | +15.0% |
FRVO | Fervo Energy | Emerging & Specialized Energy | 🔴 Cont. Bear | −19.2% | −38.3% |
OKLO | Oklo | Emerging & Specialized Energy | ⚠️ Emerging Bear | −25.1% | −49.2% |
SRE | Sempra | US Electric & Gas Utilities | 🟢 Cont. Bull | −4.7% | +9.0% |
PCG | PG&E | Vertically Integrated Utilities | 🟢 Cont. Bull | +3.3% | +16.4% |
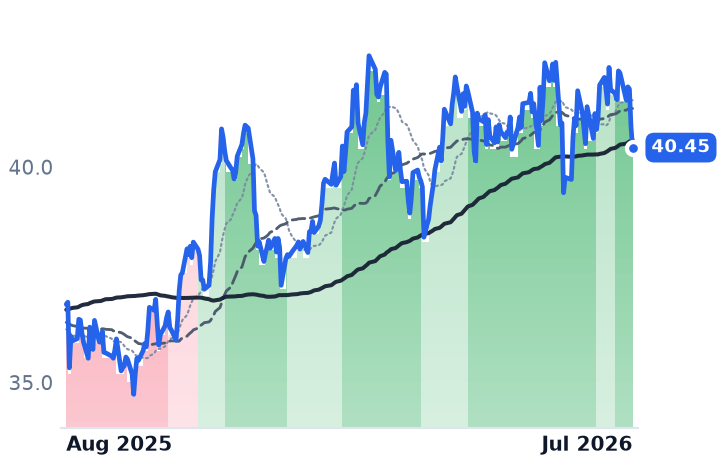
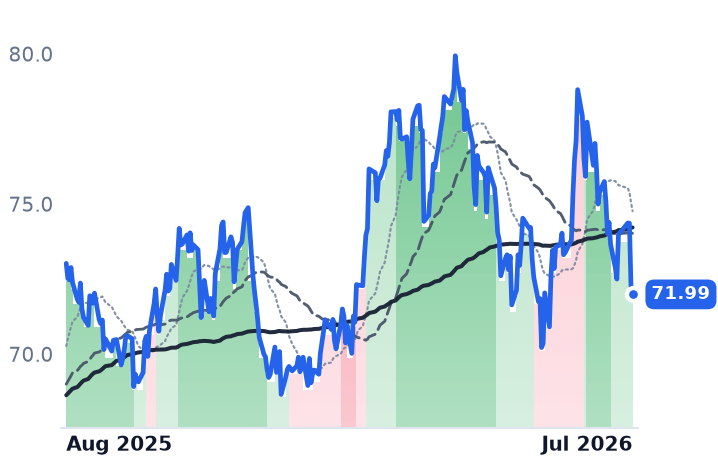
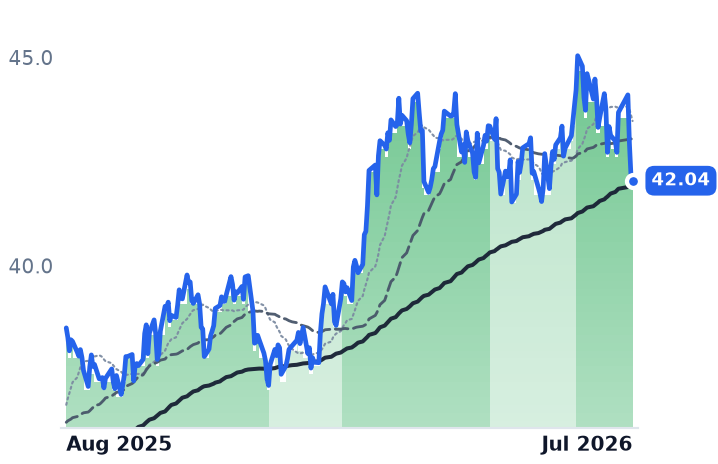
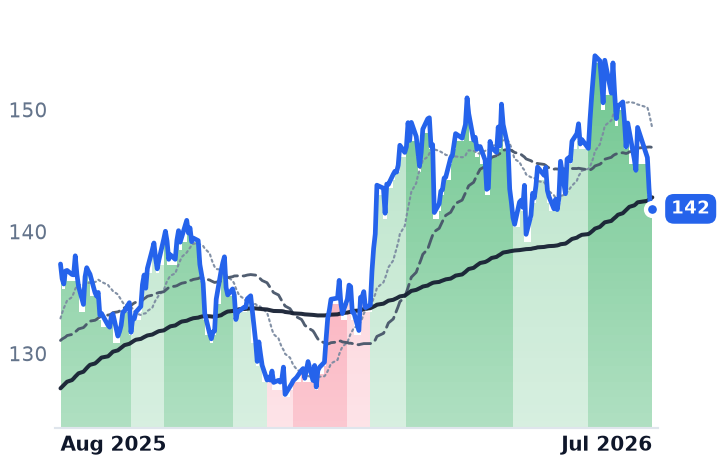
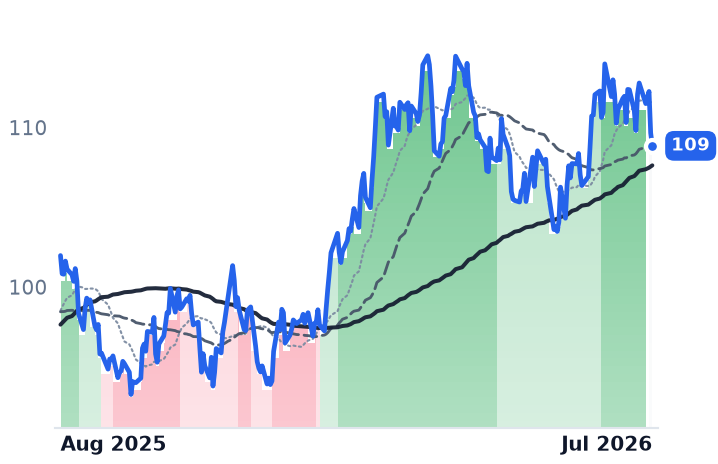
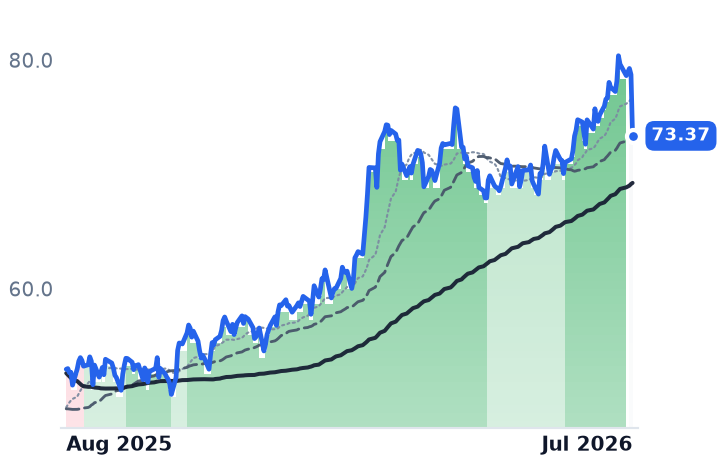
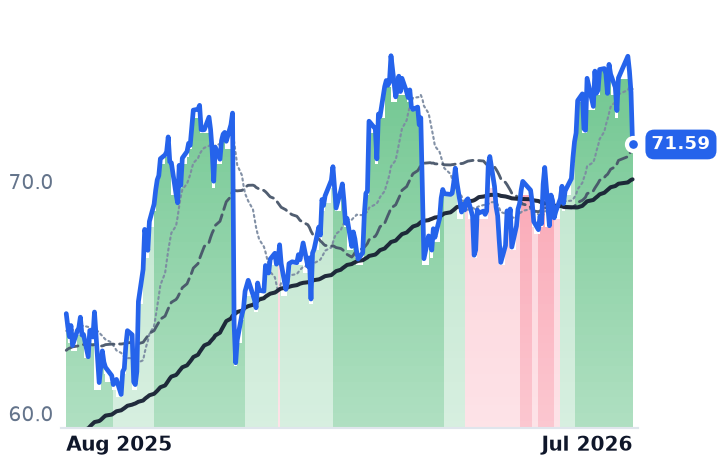
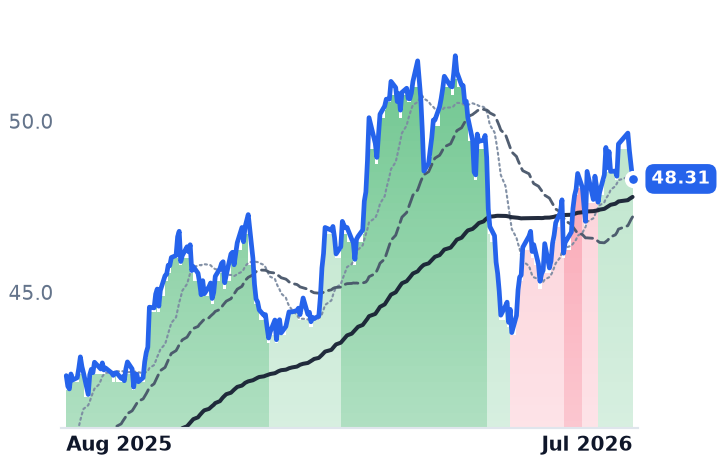
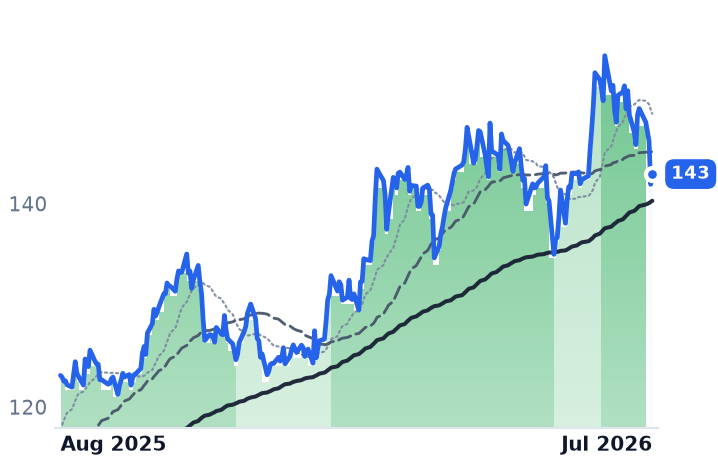
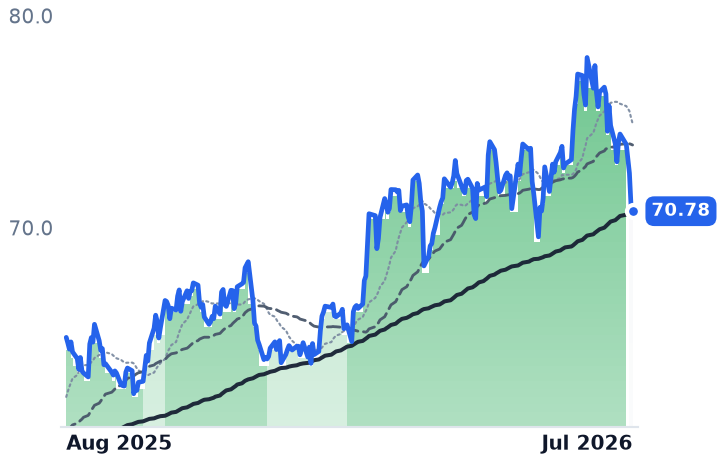
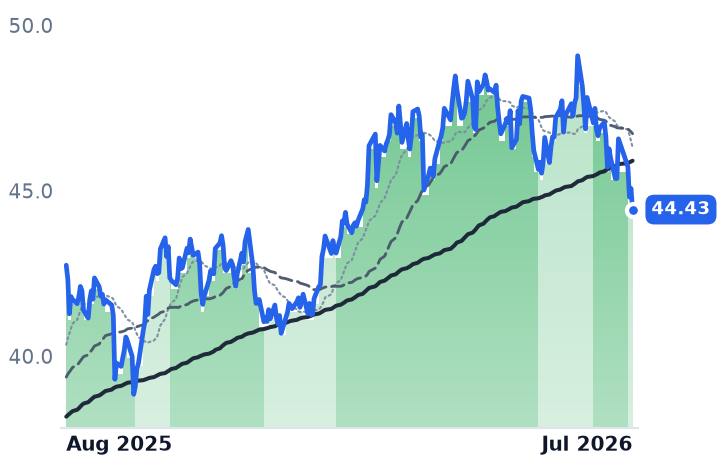
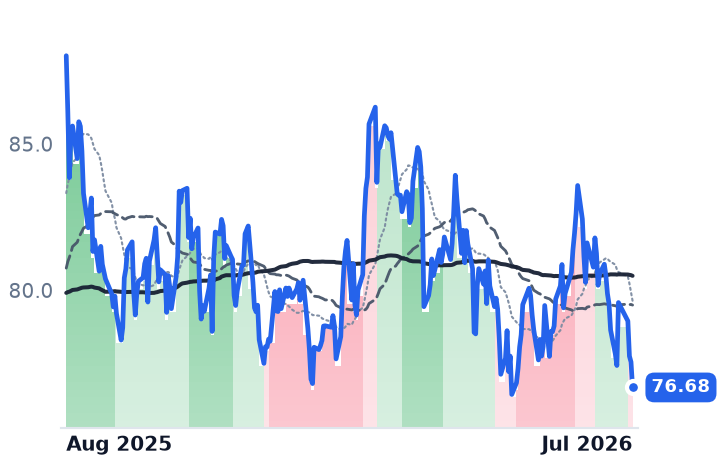
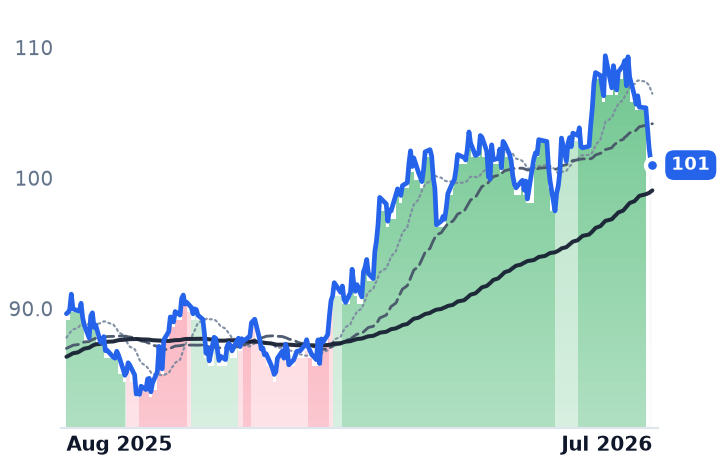
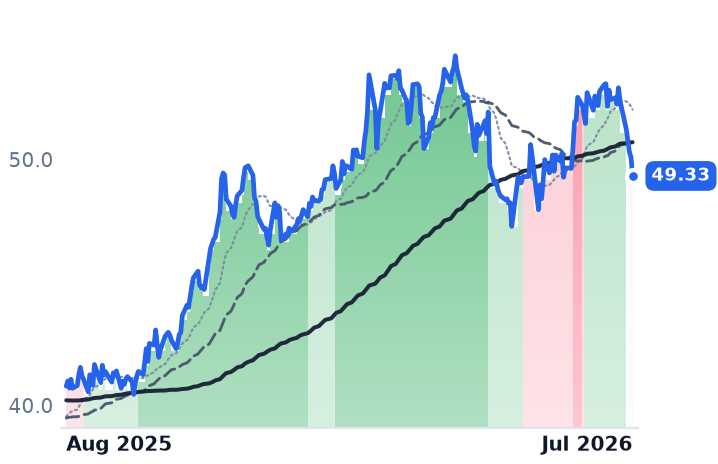
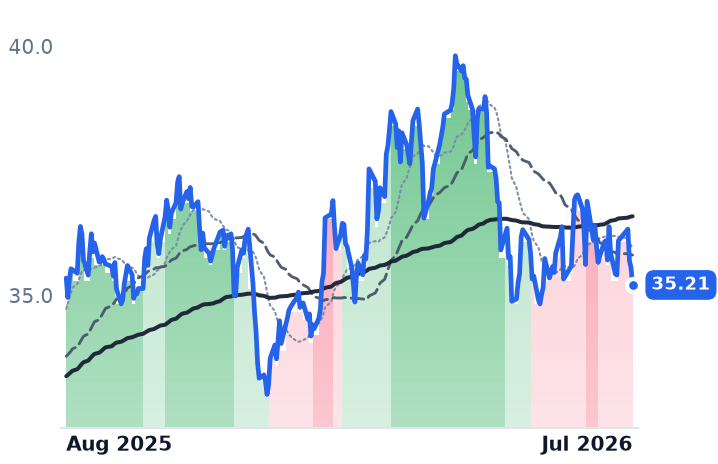
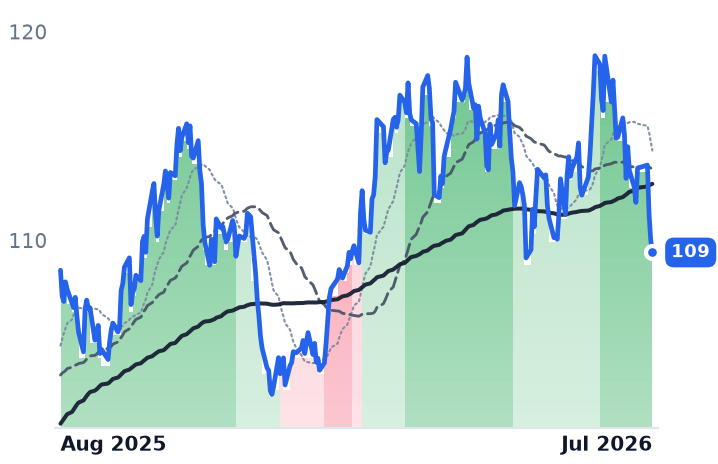
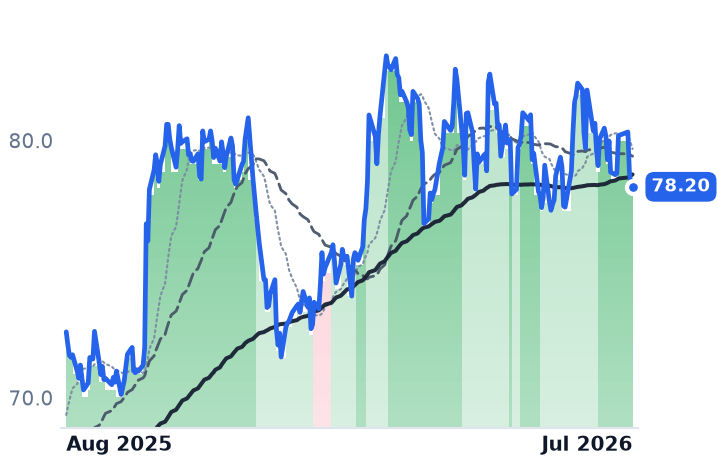
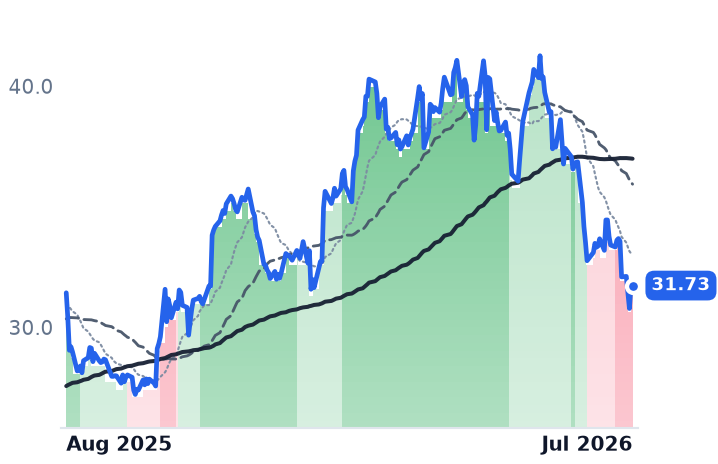
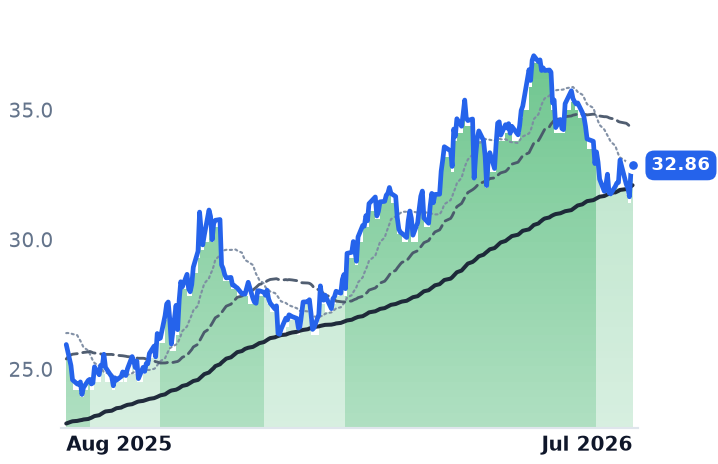
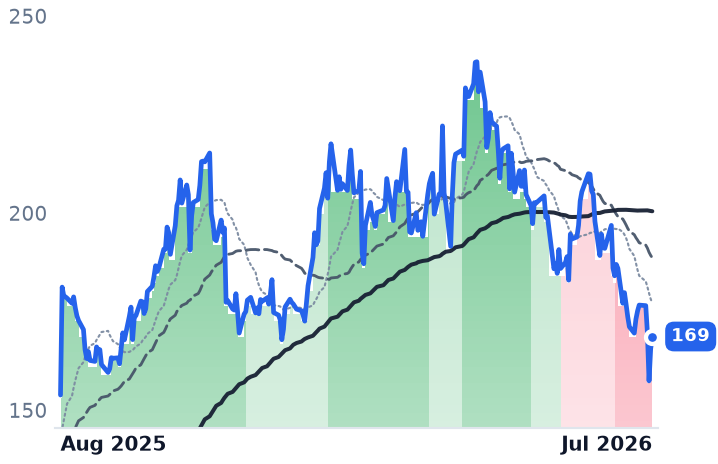
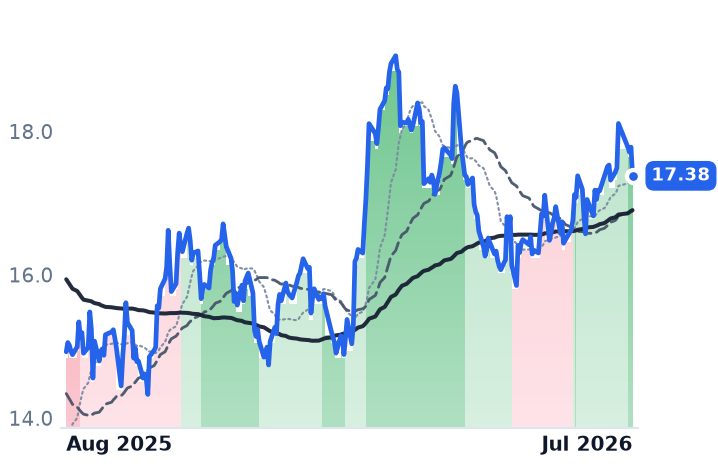
12-month price & trend
| Ticker | Mkt cap | P/E | P/E fwd | P/S | P/S fwd | P/GP | P/GP fwd | EV/EBITDA | FCF yld |
|---|---|---|---|---|---|---|---|---|---|
AEP | $68.1B | 18.6x | 19.7x | 3.1x | 2.9x | 7.7x | 7.2x | 13.7x | 9.1% |
D | $54.3B | 18.2x | 17.2x | 3.1x | 3.0x | 6.3x | 6.1x | 13.3x | -13.6% |
ETR | $49.9B | 27.6x | 24.8x | 3.8x | 3.6x | 9.8x | 9.3x | 13.6x | -6.0% |
| Ticker | Mkt cap | P/E | P/E fwd | P/S | P/S fwd | P/GP | P/GP fwd | EV/EBITDA | FCF yld |
|---|---|---|---|---|---|---|---|---|---|
NEE | $194.7B | 23.8x | 23.1x | 6.9x | 6.3x | 10.2x | 9.4x | 17.3x | 1.2% |
DUK | $94.3B | 18.3x | 18.1x | 2.8x | 2.8x | 4.1x | 4.1x | 11.5x | 7.0% |
SO | $104.3B | 23.8x | 20.2x | 3.5x | 3.4x | 8.1x | 7.8x | 12.4x | -3.7% |
| Ticker | Mkt cap | P/E | P/E fwd | P/S | P/S fwd | P/GP | P/GP fwd | EV/EBITDA | FCF yld |
|---|---|---|---|---|---|---|---|---|---|
AEE | $29.4B | 19.3x | 19.8x | 3.3x | 3.2x | 6.4x | 6.2x | 7.8x | -4.4% |
ATO | $29.5B | 21.8x | 21.1x | 6.0x | 5.6x | 9.8x | 9.2x | 15.3x | -6.8% |
AVA | $3.3B | 16.2x | 15.5x | 1.7x | 1.7x | 3.0x | 3.0x | 9.9x | 12.5% |
| Ticker | Mkt cap | P/E | P/E fwd | P/S | P/S fwd | P/GP | P/GP fwd | EV/EBITDA | FCF yld |
|---|---|---|---|---|---|---|---|---|---|
CMS | $22.1B | 19.5x | 18.4x | 2.5x | 2.5x | 3.9x | 3.9x | 12.7x | -9.2% |
CNP | $27.2B | 25.3x | 21.8x | 2.9x | 2.7x | 5.4x | 5.0x | 13.5x | -9.8% |
DTE | $29.1B | 22.9x | 18.1x | 1.8x | 1.8x | 4.6x | 4.6x | 13.7x | -5.1% |
| Ticker | Mkt cap | P/E | P/E fwd | P/S | P/S fwd | P/GP | P/GP fwd | EV/EBITDA | FCF yld |
|---|---|---|---|---|---|---|---|---|---|
ED | $38.8B | 17.7x | 17.3x | 2.3x | 2.2x | 3.5x | 3.4x | 9.4x | 7.2% |
EIX | $26.6B | 7.2x | 11.3x | 1.4x | 1.4x | 3.7x | 3.7x | 9.3x | -2.4% |
ES | $25.3B | 14.4x | 14.4x | 1.8x | 1.9x | 4.5x | 4.8x | 10.2x | 0.9% |
| Ticker | Mkt cap | P/E | P/E fwd | P/S | P/S fwd | P/GP | P/GP fwd | EV/EBITDA | FCF yld |
|---|---|---|---|---|---|---|---|---|---|
FE | $25.3B | 23.8x | 16.0x | 1.6x | 1.6x | 3.0x | 3.0x | 12.0x | 7.1% |
IDA | $7.8B | 23.2x | 21.9x | 4.4x | 3.9x | 21.8x | 19.3x | 16.1x | -10.3% |
LNT | $18.3B | 22.2x | 20.7x | 4.1x | 4.2x | 10.8x | 11.1x | 15.1x | -5.6% |
| Ticker | Mkt cap | P/E | P/E fwd | P/S | P/S fwd | P/GP | P/GP fwd | EV/EBITDA | FCF yld |
|---|---|---|---|---|---|---|---|---|---|
NI | $22.2B | 23.1x | 22.5x | 3.3x | 3.2x | 6.5x | 6.3x | 12.5x | -3.7% |
PEG | $38.1B | 16.9x | 17.5x | 3.0x | 3.1x | 3.5x | 3.6x | 11.2x | -0.2% |
PNW | $11.9B | 18.3x | 20.8x | 2.2x | 2.1x | 5.4x | 5.2x | 12.4x | -8.3% |
| Ticker | Mkt cap | P/E | P/E fwd | P/S | P/S fwd | P/GP | P/GP fwd | EV/EBITDA | FCF yld |
|---|---|---|---|---|---|---|---|---|---|
POR | $5.5B | 20.8x | 13.9x | 1.6x | 1.5x | 3.3x | 3.1x | 9.2x | 1.2% |
PPL | $26.2B | 21.5x | 17.9x | 2.8x | 2.7x | 8.0x | 7.7x | 12.0x | -6.2% |
WEC | $35.6B | 21.7x | 19.5x | 3.5x | 3.5x | 6.3x | 6.3x | 14.3x | -3.1% |
| Ticker | Mkt cap | P/E | P/E fwd | P/S | P/S fwd | P/GP | P/GP fwd | EV/EBITDA | FCF yld |
|---|---|---|---|---|---|---|---|---|---|
XEL | $48.6B | 23.3x | 19.0x | 3.3x | 3.1x | 17.5x | 16.4x | 13.9x | -6.7% |
CWEN | $6.5B | 793.3x | — | 4.4x | 3.9x | 8.6x | 7.6x | 14.3x | 9.0% |
BEP | $10.5B | 54.3x | — | 1.7x | 1.5x | 7.0x | 6.1x | 9.6x | -48.1% |
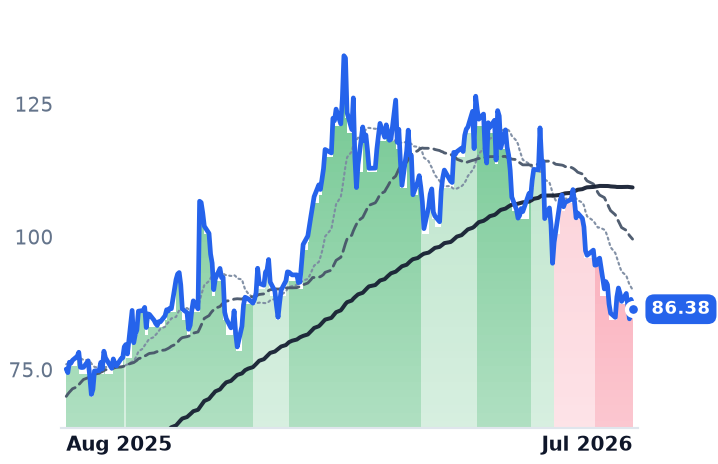
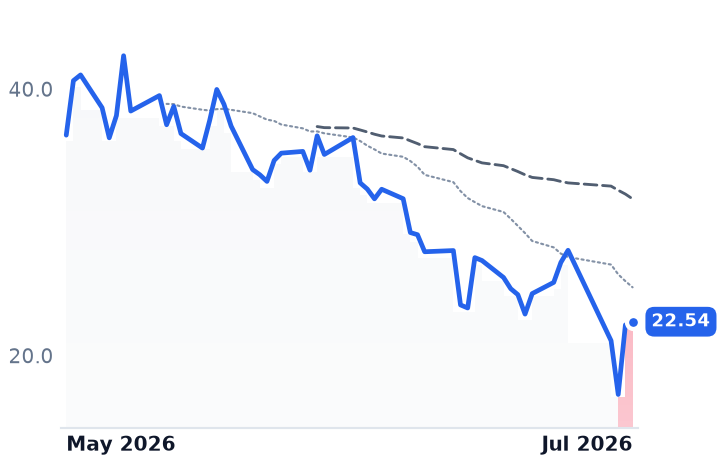
| Ticker | Mkt cap | P/E | P/E fwd | P/S | P/S fwd | P/GP | P/GP fwd | EV/EBITDA | FCF yld |
|---|---|---|---|---|---|---|---|---|---|
BWXT | $15.5B | 44.7x | 35.8x | 4.6x | 4.1x | 20.9x | 18.6x | 29.8x | 2.1% |
CCJ | $37.6B | 148.0x | 52.9x | 15.2x | 10.7x | 55.1x | 38.8x | 61.0x | 1.0% |
FRVO | $8.4B | — | — | — | — | — | — | — | — |
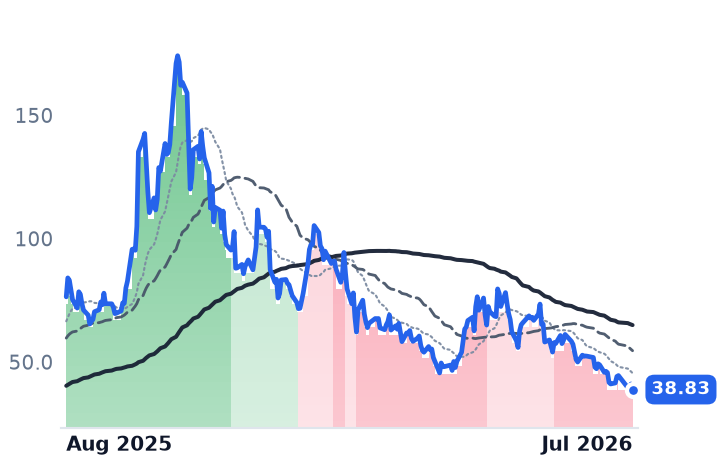
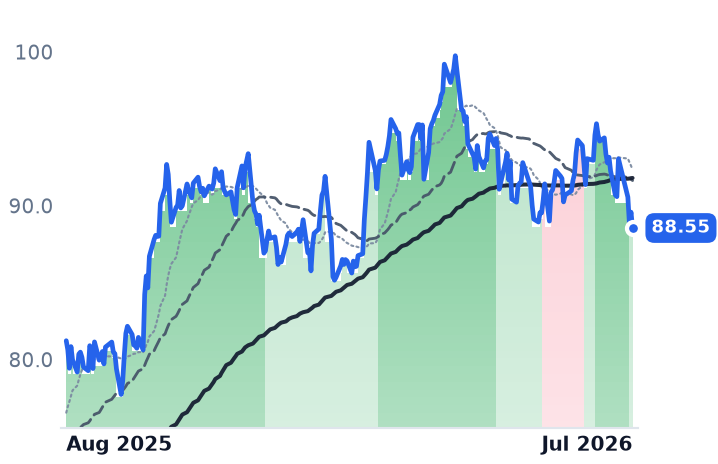
| Ticker | Mkt cap | P/E | P/E fwd | P/S | P/S fwd | P/GP | P/GP fwd | EV/EBITDA | FCF yld |
|---|---|---|---|---|---|---|---|---|---|
OKLO | $6.8B | n/m | — | n/m | — | n/m | — | n/m | -2.3% |
SRE | $59.1B | 28.6x | 17.7x | 4.3x | 4.2x | 13.2x | 12.9x | 15.4x | -9.9% |
PCG | $35.5B | 12.0x | 9.8x | 1.4x | 1.3x | 3.0x | 2.8x | 9.2x | -11.9% |
Valuation & fundamentals
Consensus projections
| Ticker | FY2026E | FY2027E | FY2028E | |
|---|---|---|---|---|
AEP | Revenue | +9.1% | +5.8% | +7.5% |
| EPS | +7.4% | +7.9% | +10.5% | |
D | Revenue | +12.2% | +6.0% | +5.3% |
| EPS | +5.1% | +6.2% | +6.3% | |
ETR | Revenue | +8.5% | +8.8% | +9.5% |
| EPS | +12.2% | +14.5% | +13.7% | |
NEE | Revenue | +9.0% | +9.3% | +8.6% |
| EPS | +9.4% | +8.8% | +8.4% | |
DUK | Revenue | +4.6% | +4.2% | +4.3% |
| EPS | +6.2% | +7.0% | +6.8% | |
SO | Revenue | +8.3% | +5.3% | +6.3% |
| EPS | +6.7% | +7.7% | +9.0% | |
AEE | Revenue | +6.3% | +6.0% | +6.2% |
| EPS | +7.0% | +8.0% | +8.4% | |
ATO | Revenue | +9.3% | +6.8% | +8.7% |
| EPS | +13.0% | +6.6% | +8.4% | |
AVA | Revenue | +2.4% | +3.5% | +3.5% |
| EPS | +3.8% | +7.7% | +4.4% | |
CMS | Revenue | +9.4% | +4.1% | +5.3% |
| EPS | +8.1% | +7.5% | +7.9% | |
CNP | Revenue | +9.3% | +4.7% | +5.0% |
| EPS | +8.3% | +9.1% | +8.8% | |
DTE | Revenue | +13.4% | +2.6% | +2.8% |
| EPS | +6.6% | +8.0% | +8.4% | |
ED | Revenue | +6.9% | +4.2% | +3.9% |
| EPS | +7.3% | +6.2% | +6.5% | |
EIX | Revenue | +2.0% | +4.5% | +3.3% |
| EPS | +0.6% | +6.4% | +6.3% | |
ES | Revenue | +4.6% | +3.5% | +6.6% |
| EPS | −1.4% | +5.6% | +6.2% | |
FE | Revenue | +8.0% | +5.1% | +4.9% |
| EPS | +7.2% | +7.8% | +7.9% | |
IDA | Revenue | +3.1% | +8.4% | +9.5% |
| EPS | +9.2% | +8.9% | +9.5% | |
LNT | Revenue | +6.8% | +4.3% | +6.3% |
| EPS | +6.5% | +7.7% | +9.4% | |
NI | Revenue | +13.1% | +5.5% | +6.5% |
| EPS | +9.2% | +8.8% | +8.8% | |
PEG | Revenue | +4.1% | +4.0% | +4.3% |
| EPS | +8.3% | +7.4% | +7.2% | |
PNW | Revenue | +4.2% | +7.2% | +5.9% |
| EPS | −4.9% | +17.3% | +9.8% | |
POR | Revenue | +5.8% | +6.8% | +5.2% |
| EPS | +8.0% | +5.1% | +5.7% | |
PPL | Revenue | +10.6% | +5.4% | +5.6% |
| EPS | +7.8% | +8.6% | +8.3% | |
WEC | Revenue | +8.0% | +5.0% | +7.5% |
| EPS | +6.6% | +7.2% | +8.2% | |
XEL | Revenue | +7.8% | +8.9% | +8.1% |
| EPS | +8.0% | +10.4% | +10.1% | |
CWEN | Revenue | +17.0% | +11.6% | +12.6% |
| EPS | −164.1% | −148.8% | +63.8% | |
BEP | Revenue | +8.3% | +11.0% | +0.9% |
| EPS | +22.8% | −18.4% | −12.6% | |
BWXT | Revenue | +19.7% | +9.4% | +7.5% |
| EPS | +23.2% | +11.1% | +11.2% | |
CCJ | Revenue | +2.8% | +10.7% | +9.4% |
| EPS | +13.8% | +62.5% | +20.5% | |
OKLO | Revenue | — | +359.5% | +731.8% |
| EPS | +20.1% | +13.8% | +10.2% | |
SRE | Revenue | −0.8% | −2.2% | +2.0% |
| EPS | +11.6% | +8.1% | +8.5% | |
PCG | Revenue | +4.0% | +3.3% | +3.7% |
| EPS | +9.6% | +9.4% | +9.3% |
Forward fiscal years only. Blank means no analyst coverage for that year.
American Electric Power (AEP), the Ohio-based transmission and generation utility that owns 90% of the country's 765kV high-voltage grid, Dominion Energy, the Virginia utility serving the world's densest data-center corridor, and peers Entergy, Duke Energy, Southern Company and NextEra Energy have carried the regulated utilities segment to a broad, not concentrated, gain: mean one-year return across all 25 vertically integrated utility names is +8.7%, with 21 of 25 positive. The strongest legs are Edison International (wildfire-liability recovery, +38%) alongside data-center-exposed names NextEra (+23.5%), Entergy (+20%), Portland General (+19%), IDACORP (+14.9%) and Dominion (+14.5%); the weak tail is Public Service Enterprise Group (-13.8%) and CenterPoint Energy (-2.8%). Twelve of the 25 currently sit in a sustained uptrend and none in a sustained downtrend — a sharp contrast with the adjacent merchant, nuclear and yieldco complex, where Clearway Energy, BWX Technologies, Cameco and Fervo Energy have all rolled into confirmed downtrends. No band contagion from that breakdown has reached the regulated cohort so far.
The business case is real
Capex and rate-base guidance have moved up, not down. AEP raised its five-year capital plan from $72B to $78B on contracted data-center load that has doubled to 63 gigawatts, implying better than 9% long-term earnings-per-share (EPS) growth. Entergy's plan grew from $43B to $57B after signing a Meta data-center agreement in Louisiana, where regulators approved three new gas plants plus transmission to serve it, per The Center Square; Entergy now guides to 12%+ EPS growth into 2030. Dominion's 50-gigawatt pipeline, anchored by Virginia's "Data Center Alley," backs a $65B five-year plan, and Duke Energy reaffirmed 2026 EPS guidance of $6.55-$6.80 alongside a $103B five-year capital plan and 7.6 gigawatts of signed AI contracts, according to ad-hoc-news.de. Regulators have also begun shifting stranded-cost risk toward the data centers themselves: Virginia's utility regulator approved a new Dominion tariff class requiring 14-year take-or-pay contracts from large users starting 2027, even as it capped Dominion's authorized return on equity at 9.8% instead of the requested 10.4%, per Inside Climate News. AEP Ohio's tariff carries an 85% take-or-pay demand floor, per Utility Dive, though manufacturers still dispute AEP's underlying load forecast.
But the price already reflects it
Trailing price-to-earnings ratios across the core names run from 19.8x (Duke) and 20.5x (AEP, Dominion) to 22.5x (NextEra), 24.8x (Southern) and 29.6x (Entergy) — all above the sector's own 25-year forward-multiple median near 16.8x and the roughly 18.2x estimate on 2026 sector earnings, per stockanalysis.com. Growth is confirming the rally, but the multiple has moved further, placing most of the cohort in what reads as a stretched advance rather than cheap compounding. The past 30 days show a uniform, sector-wide de-rating — all 25 members fell, averaging roughly -5% — that lines up with the 10-year Treasury yield's climb toward 4.74% by July 31, per CNBC, plus mounting political pressure over electricity bills that Utility Dive and Fitch describe as a deteriorating backdrop for cost recovery, per Utility Dive. An unresolved Federal Energy Regulatory Commission (FERC) show-cause process on large-load interconnection rules closes around mid-August, and Sightline Climate estimates up to half of the announced 2026 data-center pipeline may not materialize — both live risks to the load forecasts underpinning current capex plans, per The Center Square.
The setup
Where it stands — Regulated utilities are decoupling from the merchant/nuclear power breakdown, with real capex and EPS upgrades but trailing multiples above the sector's long-run median. Would confirm — Signed data-center megawatts convert to realized load growth in coming IRP updates without material cancellations. Would invalidate — Strongly bullish-band names roll into mild or strongly bearish as merchant-complex contagion spreads, or FERC's August ruling shifts stranded-cost risk back to utilities. Watch next — FERC's large-load interconnection show-cause deadline, due mid-August 2026. Valuation — Core names trade 19.8x-29.6x trailing earnings versus a 25-year sector median near 16.8x forward.