

SM Energy's +27% month is a late war-premium leg, not an early turn
Prompt v1.0
SM Energy's 27% July advance is real and grind-shaped, but it is the fourth month of an existing uptrend rather than an exit from a bear band — and the Middle East risk premium that powered it started unwinding on 27 July, one session after SM's last recorded close. At $33.19 the stock sits 34% above its 200-day average and roughly 11% below a consensus target that two brokers cut in July.
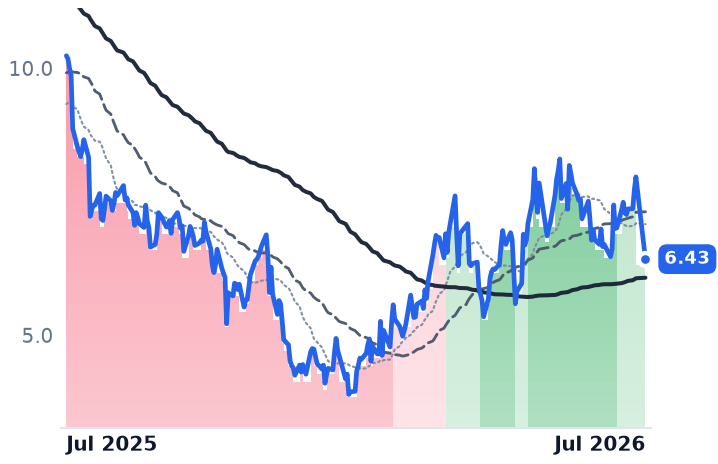
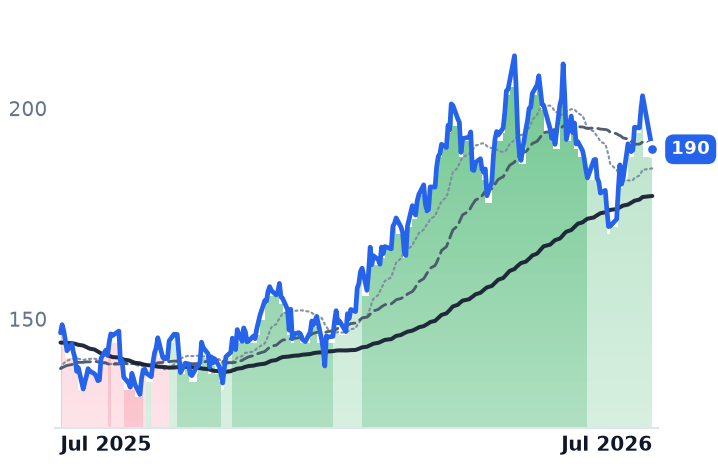
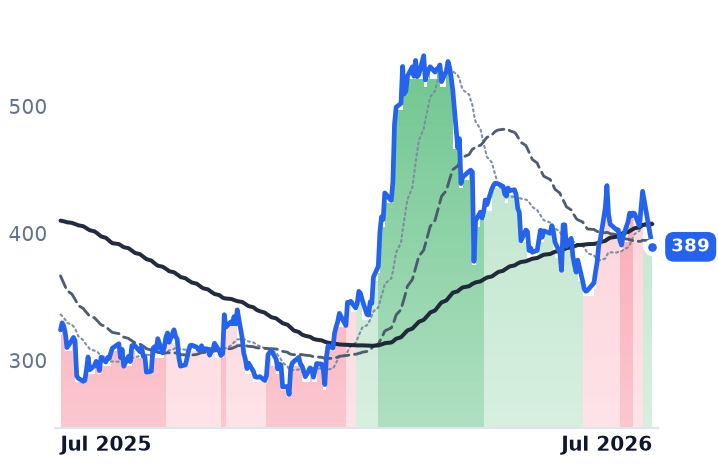
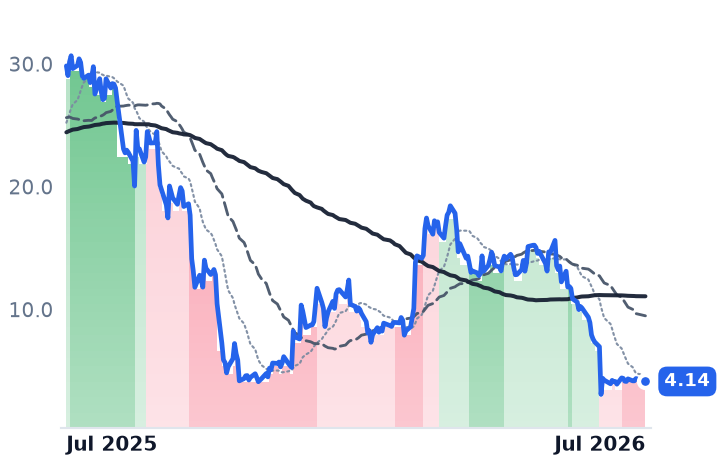
| Ticker | Company | Segment | Trend · 13mo | 30D | 1Y |
|---|---|---|---|---|---|
SM | SM Energy | Permian Basin Focused | 🌱 Emerging Bull | +13.4% | +6.1% |
MTDR | Matador Resources | Permian Basin Focused | 🌱 Emerging Bull | −7.3% | −9.5% |
PR | Permian Resources | Permian Basin Focused | 🟢 Cont. Bull | +6.8% | +42.0% |
DVN | Devon Energy | Diversified Onshore & Conventional | 🟢 Cont. Bull | +1.6% | +27.5% |
HPK | HighPeak Energy | Permian Basin Focused | 🌱 Emerging Bull | −4.1% | −37.2% |
FANG | Diamondback Energy | Permian Basin Focused | 🟢 Cont. Bull | +5.4% | +29.7% |
TPL | Texas Pacific Land | Royalty & Mineral Interests | 🌱 Emerging Bull | −7.3% | +20.2% |
SOC | Sable Offshore | Oil & Gas Production | 🔴 Cont. Bear | −40.6% | −86.1% |
SHEL | Shell | Upstream Exploration & Production | 🟢 Cont. Bull | +12.1% | +22.8% |
CVX | Chevron | Upstream Exploration & Production | 🟢 Cont. Bull | +11.3% | +23.9% |
12-month price & trend
| Ticker | Mkt cap | P/E | P/E fwd | P/S | P/S fwd | P/GP | P/GP fwd | EV/EBITDA | FCF yld |
|---|---|---|---|---|---|---|---|---|---|
SM | $3.7B | 28.7x | 4.6x | 1.0x | 0.5x | 2.2x | 1.2x | 4.9x | -6.0% |
MTDR | $7.5B | 15.4x | 8.3x | 2.1x | 1.9x | 2.3x | 2.1x | 5.2x | 0.8% |
PR | $14.9B | 26.1x | 12.4x | 2.9x | 2.4x | 8.2x | 6.7x | 5.6x | 2.3% |
| Ticker | Mkt cap | P/E | P/E fwd | P/S | P/S fwd | P/GP | P/GP fwd | EV/EBITDA | FCF yld |
|---|---|---|---|---|---|---|---|---|---|
DVN | $30.8B | 13.6x | 9.2x | 1.8x | 1.3x | 8.1x | 5.8x | 4.9x | 8.7% |
HPK | $897.1M | n/m | — | 1.2x | 1.0x | 7.0x | 6.2x | 3.8x | -2.6% |
FANG | $57.3B | 142.8x | 10.8x | 3.8x | 3.3x | 9.0x | 7.8x | 13.1x | 2.8% |
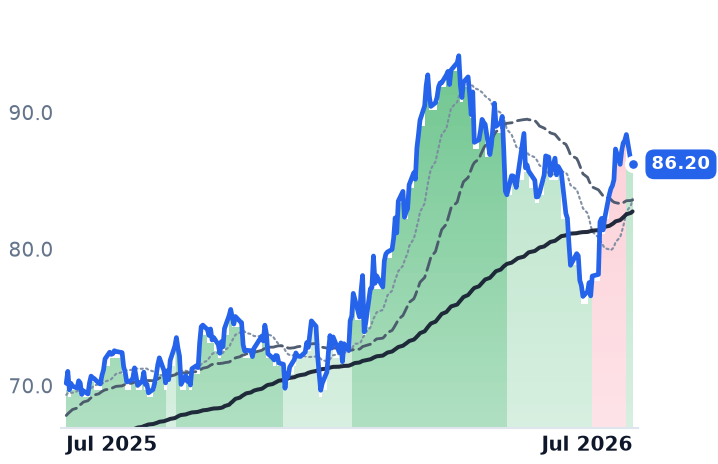
| Ticker | Mkt cap | P/E | P/E fwd | P/S | P/S fwd | P/GP | P/GP fwd | EV/EBITDA | FCF yld |
|---|---|---|---|---|---|---|---|---|---|
TPL | $26.6B | 52.7x | 42.3x | 31.7x | 26.6x | 32.4x | 27.2x | 38.1x | 1.9% |
SOC | $1.5B | n/m | 11.5x | — | 1.6x | — | — | n/m | -42.0% |
SHEL | $240.6B | 12.9x | 8.8x | 0.9x | 0.8x | 5.4x | 4.6x | 5.0x | 7.9% |
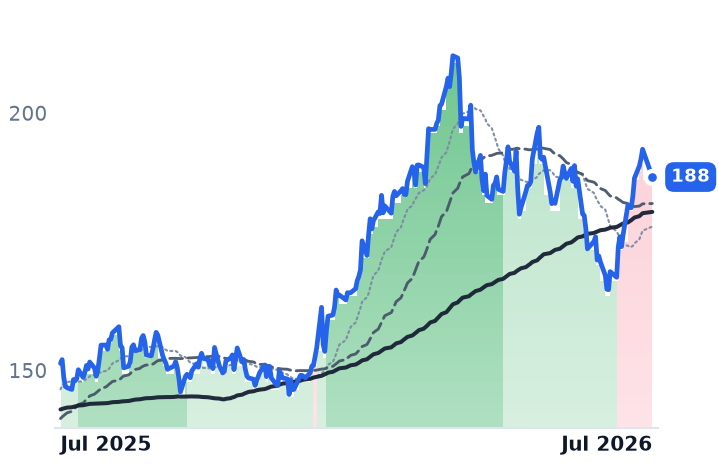
| Ticker | Mkt cap | P/E | P/E fwd | P/S | P/S fwd | P/GP | P/GP fwd | EV/EBITDA | FCF yld |
|---|---|---|---|---|---|---|---|---|---|
CVX | $380.5B | 34.4x | 14.2x | 2.0x | 1.7x | 8.0x | 6.6x | 10.4x | 3.5% |
Consensus projections
| Ticker | FY2026E | FY2027E | FY2028E | |
|---|---|---|---|---|
SM | Revenue | +119.1% | +3.2% | +1.1% |
| EPS | +30.2% | +5.8% | +4.3% | |
MTDR | Revenue | +10.3% | +9.6% | +1.3% |
| EPS | +29.6% | +14.9% | −0.5% | |
PR | Revenue | +19.0% | +4.4% | +1.3% |
| EPS | +44.8% | +23.1% | +2.6% | |
DVN | Revenue | +42.1% | +10.1% | +4.9% |
| EPS | +35.0% | −1.0% | +8.2% | |
HPK | Revenue | +1.9% | −14.4% | +6.8% |
| EPS | −118.0% | +334.8% | −157.0% | |
FANG | Revenue | +16.0% | −5.6% | +1.3% |
| EPS | +51.1% | −10.1% | +5.2% | |
TPL | Revenue | +26.0% | +11.3% | +14.5% |
| EPS | +30.3% | +11.2% | −100.0% | |
SOC | Revenue | +10057.7% | +30.8% | +1.7% |
| EPS | −130.4% | +102.0% | +15.0% | |
SHEL | Revenue | +17.3% | −6.5% | −0.1% |
| EPS | +52.5% | −7.0% | +5.7% | |
CVX | Revenue | +20.5% | −10.9% | −0.3% |
| EPS | +88.5% | −11.2% | +2.8% |
Forward fiscal years only. Blank means no analyst coverage for that year.
The band story doesn't hold
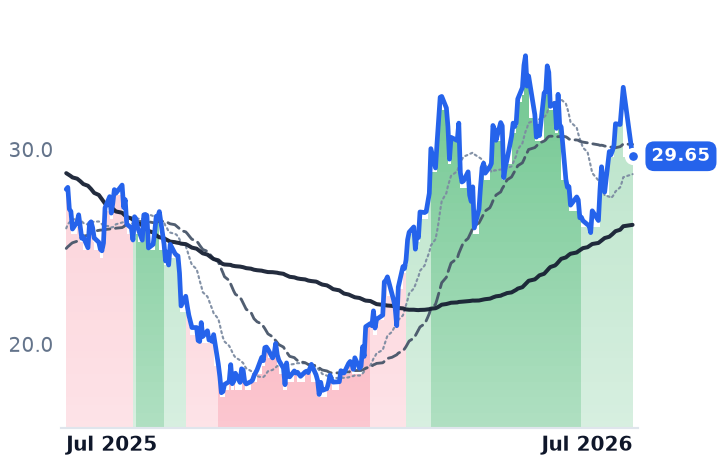
The premise of an early-stage re-rating requires bear-band exits. There aren't any. SM has been in bull trend bands continuously since 31 March 2026 — strongly bullish through mid-June, easing to mildly bullish by 30 June and holding there through 22 July. Its rise from $26.14 on 29 June to $33.19 on 22 July (+26.97%) is month four of an existing uptrend, and the stock is up roughly 77% year-to-date from $18.75 in January. The move is a grind, not a gap: nine up days against seven down, largest single session +7.5% on 13 July, contributing about 30% of the point move.
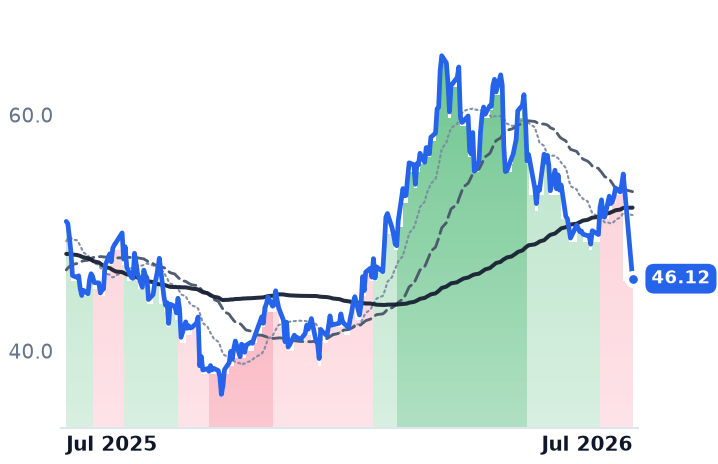
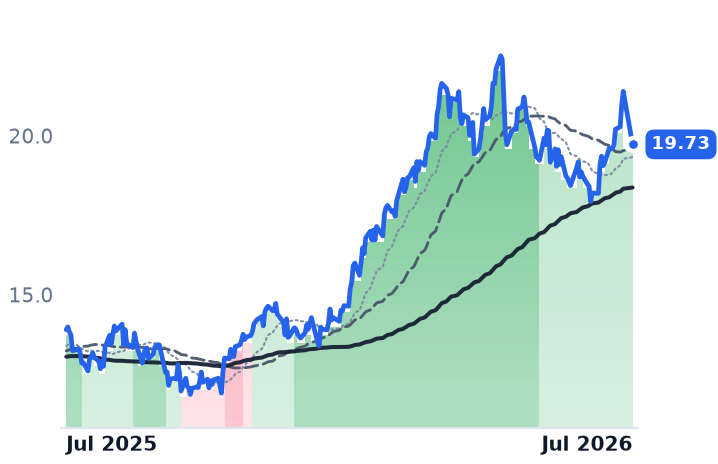
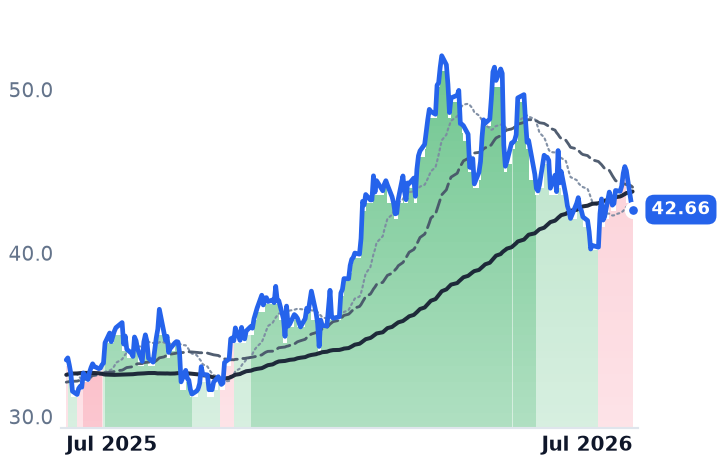
Peers tell the same continuation story, not a turn. PR has been mildly bullish since 29 May, HighPeak and FANG never left bull territory. The names that did move across bands moved the wrong way — MTDR and DVN flipped to mildly bearish around 10 July, SOC to strongly bearish. And SOC isn't a crude read: it fell 56% in one session on 30 June on a financing event. Thirty-day returns to 22 July: SM +21.1%, TPL +17.1%, PR +11.6%, HPK +10.9%, MTDR +9.2%, DVN +2.3%. On 90 days the cohort splits — HPK +28.7% and SM +14.2% against MTDR -9.0% and DVN -10.0%. Every name but SOC trades above its 200-day average. CIVI no longer trades; SM absorbed it.
The driver was a war premium, and it's already deflating
Oil rose more than 30% in July, with Brent crossing $100 on 23 July after reported Houthi attacks on Saudi tankers; Rapidan lifted its Q4 Brent forecast to near $100 from $85. Then Brent fell about 8.7% on 27 July on US–Iran talks — DVN -4.2%, SHEL -2.3% that session, while SM's local series stops 22 July. Company-specific fuel came from JPMorgan's upgrade to Overweight, PT $47, an explicitly cohort-wide free-cash-flow-yield call. The $12.8bn Civitas merger closed 30 January and lifted Q1 revenue to $1,479m from $845m — six months before the July tape.
What's left
SM closed 22 July 34% above its $24.70 200-day and 4.7% under its 52-week high, against a consensus near $37 that Truist and Mizuho both cut in July — about 11% of runway. Q2 results land 5 August, a forward risk event, not a completed catalyst.
The structural case is genuinely intact: Dallas Fed breakevens near $62/bbl outside the Permian and Eagle Ford, a Q1 activity index swinging to +21.0, $38bn of Q1 upstream M&A headlined by Devon–Coterra, and Rystad naming PR, MTDR, HPK and CHRD in a coming SMID consolidation wave. But the bearish balance is unspent: OPEC+ adds 548,000 b/d in August, EIA cut its 2026 Brent path ~14% to about $82, and the IEA still models a record 2026 surplus above 4 mb/d. Internal analysis from 18 May already flagged SM's post-Civitas synergies and ~4.6x forward PE — the thesis is old, and the tape has now priced a lot of it.