

Ormat's Profit Growth Came From Batteries, Not the Geothermal Data Centers Want
Hypothesis Opus 5 · Research Opus 5 · Writing Opus 5 · Prompt v1.5
Geothermal is the rung of the artificial-intelligence power stack that is supposed to be simplest: round-the-clock, carbon-free, sited next to a campus. The two US-listed ways to own it just moved in opposite directions, and the reason is not rates.
Ormat Technologies, which owns geothermal plants worldwide, lifted second-quarter gross profit 20.8% and expanded consolidated gross margin 220 basis points to 26.5%. Almost none of it came from contracted geothermal: its Electricity segment grew 5.8% and had its full-year guide trimmed, while energy-storage revenue nearly tripled on merchant power prices. Fervo Energy, the enhanced-geothermal developer that listed in May, fell 39% over 30 days after guiding 2027 revenue to $60–80m on a third party's transmission constraint.
Ormat now costs 20.1x trailing gross profit, down from 25.9x in May while that profit grew 21.7%. Fervo is diverging; Ormat's de-rating happened before August.
| Ticker | Company | Segment | Trend · 13mo | 30D | 1Y |
|---|---|---|---|---|---|
| The subject · what this brief is about | |||||
FRVO | Fervo Energy | Emerging & Specialized Energy | 🔴 Cont. Bear | −39.0% | −53.4% |
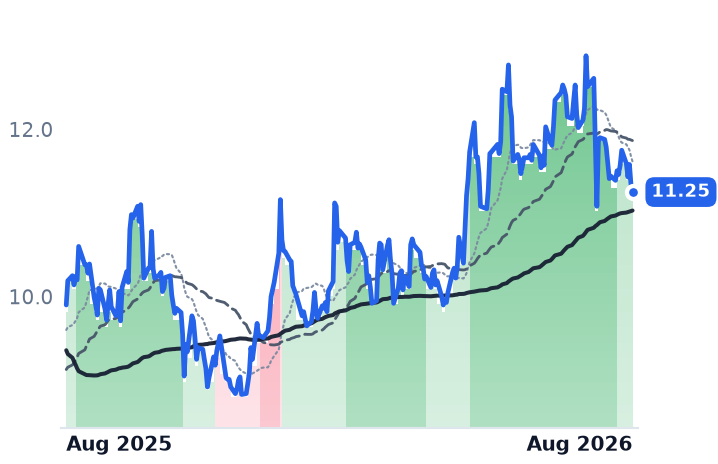
ORA | Ormat Technologies | Geothermal & Specialized | ⚠️ Emerging Bear | +4.6% | +17.5% |
| Compared against · context, not the story | |||||
OKLO | Oklo | Emerging & Specialized Energy | 🔴 Cont. Bear | −4.7% | −36.9% |
FRMI | Fermi | Emerging & Specialized Energy | 🔴 Cont. Bear | −9.5% | −81.7% |
VST | Vistra | Integrated Retail & Generation | 🔴 Cont. Bear | −17.6% | −27.5% |
NRG | NRG Energy | Integrated Retail & Generation | ⚠️ Emerging Bear | −18.1% | −21.0% |
TLN | Talen Energy | Wholesale Power Producers | 🟢 Cont. Bull | −16.4% | −11.8% |
CEG | Constellation Energy | Diversified Renewable Generators | ⚠️ Emerging Bear | −0.6% | −12.4% |
AEP | American Electric Power | Vertically Integrated Utilities | 🟢 Cont. Bull | −6.7% | +11.4% |
D | Dominion Energy | Vertically Integrated Utilities | 🟢 Cont. Bull | −5.5% | +13.3% |
DUK | Duke Energy | Vertically Integrated Utilities | 🟢 Cont. Bull | −6.1% | −1.6% |
SO | The Southern | Vertically Integrated Utilities | 🟢 Cont. Bull | −5.2% | −2.4% |
XEL | Xcel Energy | Vertically Integrated Utilities | 🟢 Cont. Bull | −3.0% | +8.8% |
NEE | NextEra Energy | Vertically Integrated Utilities | ⚠️ Emerging Bear | −5.5% | +13.4% |
CWEN | Clearway Energy | Wind & Solar Developers | ⚠️ Emerging Bear | −3.1% | +14.2% |
BEP | Brookfield Renewable Partners | Diversified Renewable Generators | 🟢 Cont. Bull | +2.9% | +35.3% |
XIFR | XPLR Infrastructure | Renewable & Infrastructure Assets | 🟢 Cont. Bull | −12.7% | +13.6% |
GEV | GE Vernova | GE Vernova Integrated | 🟢 Cont. Bull | −2.7% | +58.5% |
FSLR | First Solar | Solar Module Manufacturers | ⚠️ Emerging Bear | +3.4% | +12.5% |
BKR | Baker Hughes | Well Services & Stimulation | 🟢 Cont. Bull | +11.3% | +46.2% |
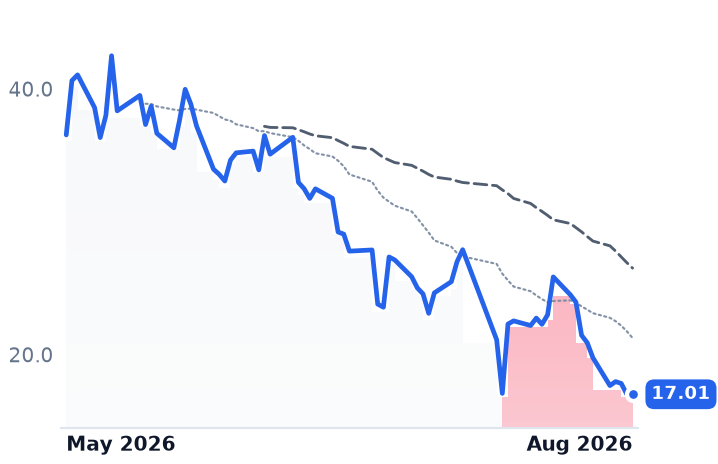
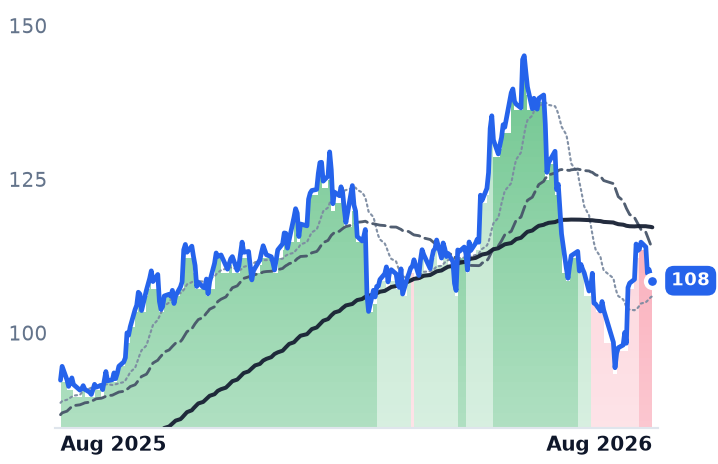
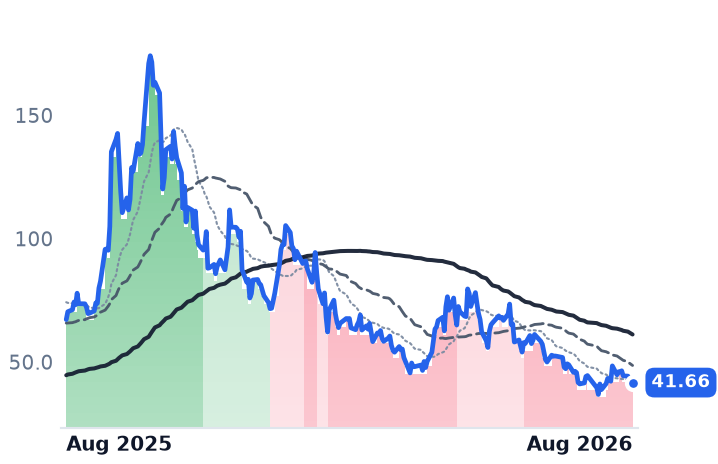
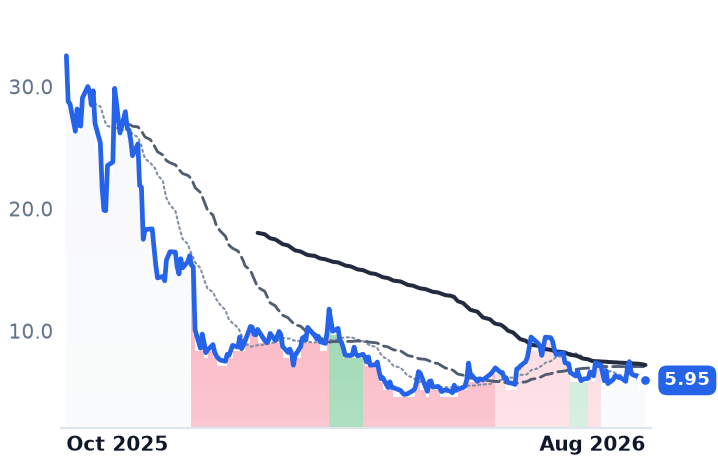
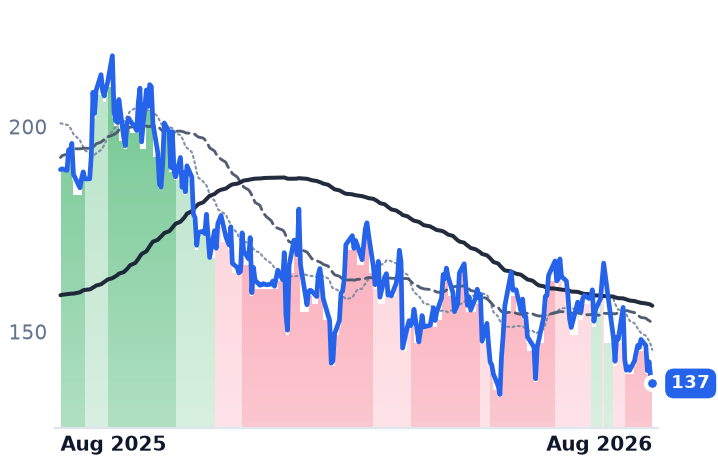
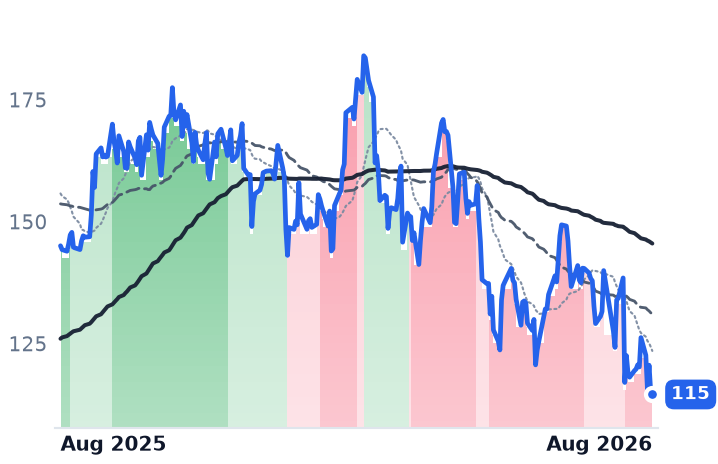
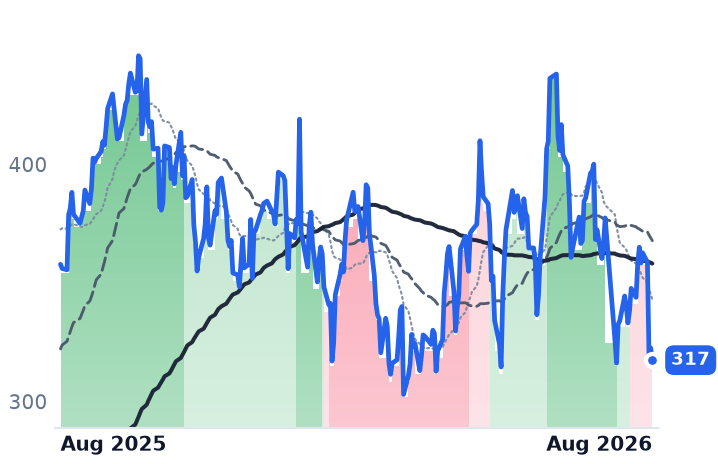
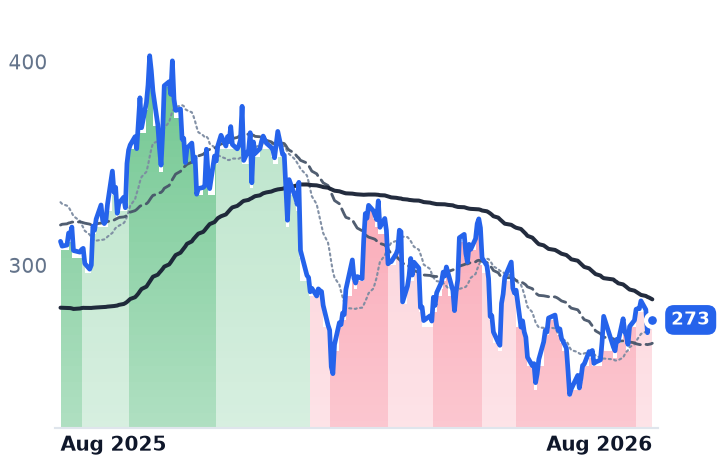
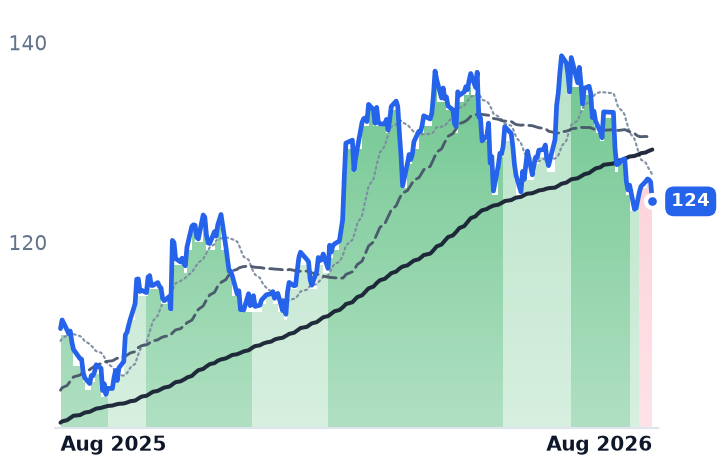
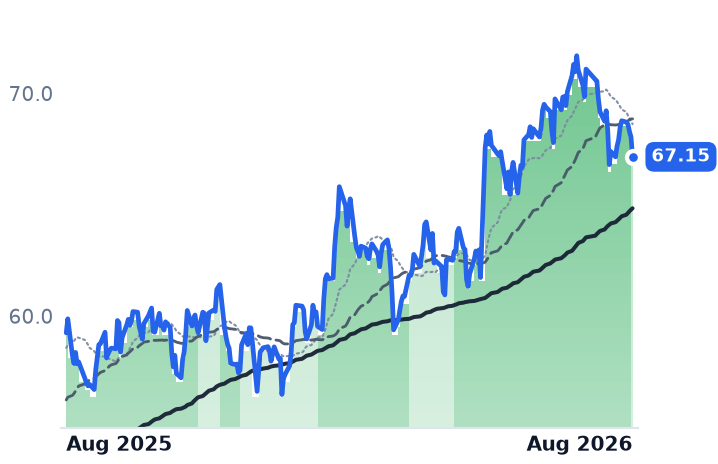
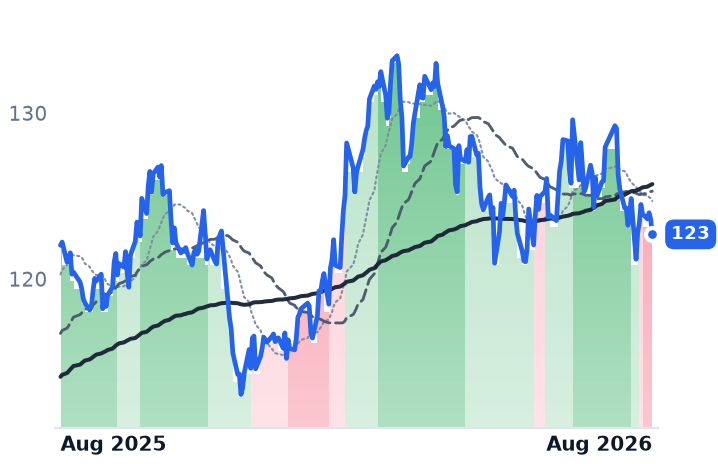
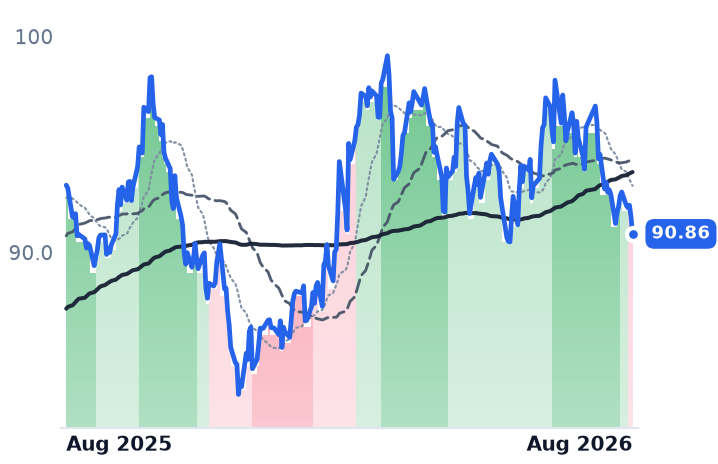
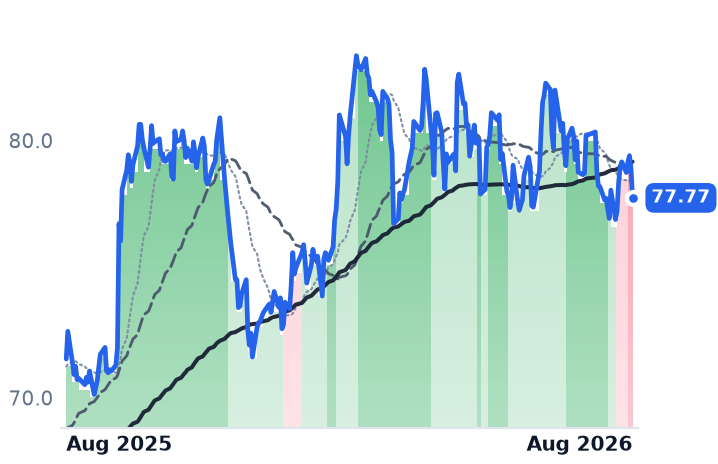
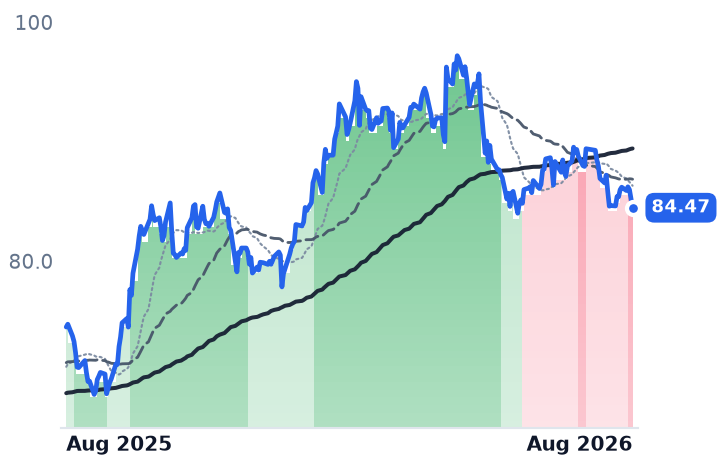
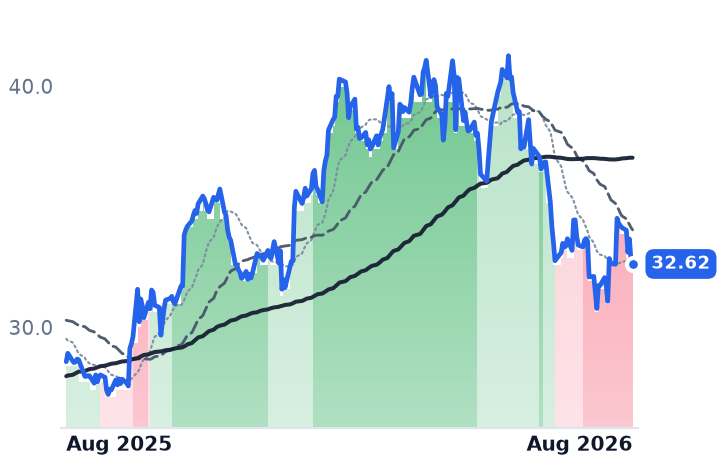
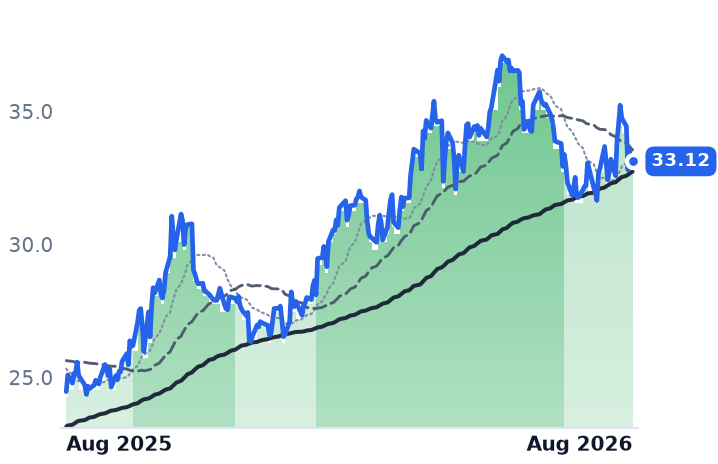
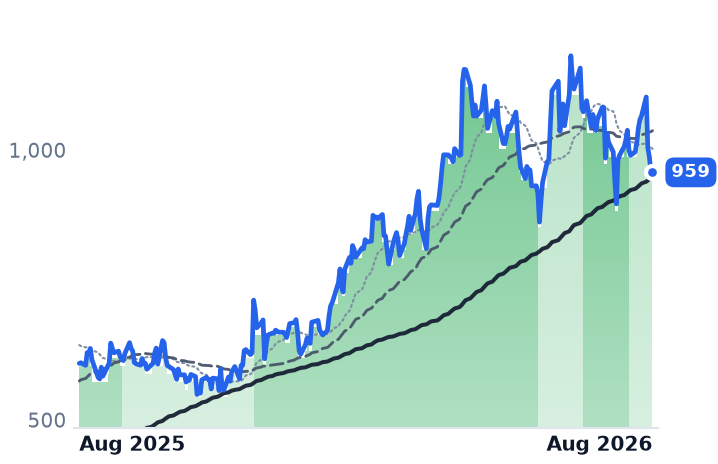
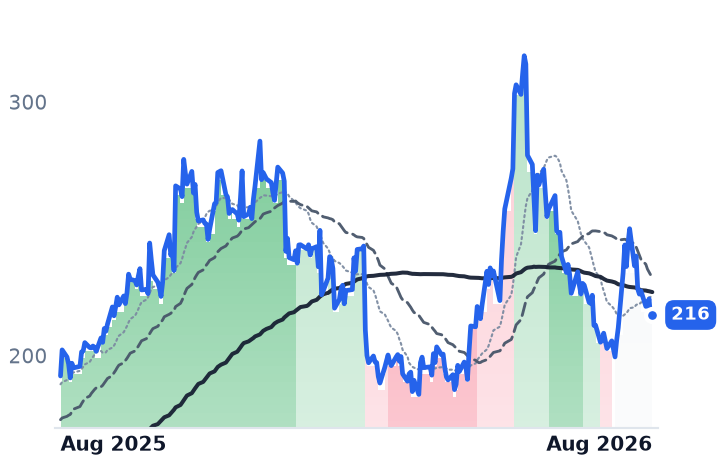
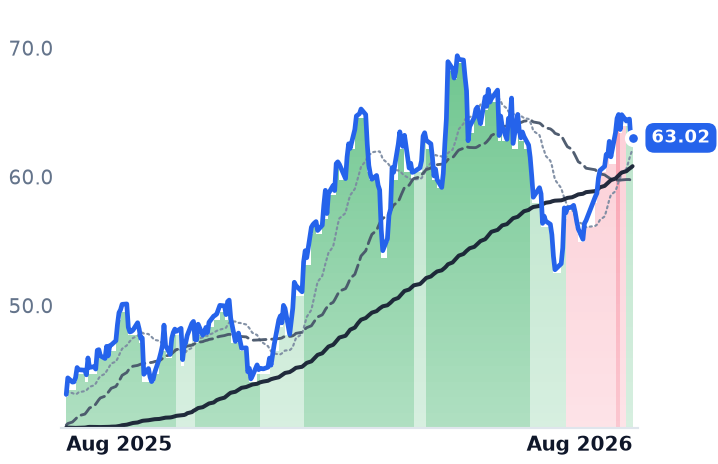
12-month price & trend
| Ticker | Mkt cap | P/E | P/E fwd | P/S | P/S fwd | P/GP | P/GP fwd | EV/EBITDA | FCF yld |
|---|---|---|---|---|---|---|---|---|---|
FRVO | $4.9B | n/m | — | — | 833.0x | — | — | n/m | -9.1% |
ORA | $6.7B | 52.1x | 42.9x | 5.6x | 5.7x | 20.1x | 20.3x | 22.0x | -4.0% |
OKLO | $7.2B | n/m | — | — | — | — | — | n/m | -3.8% |
| Ticker | Mkt cap | P/E | P/E fwd | P/S | P/S fwd | P/GP | P/GP fwd | EV/EBITDA | FCF yld |
|---|---|---|---|---|---|---|---|---|---|
FRMI | $3.8B | n/m | — | n/m | 208.4x | — | — | n/m | -31.0% |
VST | $45.9B | 22.7x | 15.4x | 2.9x | 2.0x | 22.2x | 15.5x | 10.1x | 3.0% |
NRG | $23.9B | 29.6x | 12.7x | 0.6x | 0.7x | 4.0x | 4.0x | 11.2x | 1.5% |
| Ticker | Mkt cap | P/E | P/E fwd | P/S | P/S fwd | P/GP | P/GP fwd | EV/EBITDA | FCF yld |
|---|---|---|---|---|---|---|---|---|---|
TLN | $14.3B | n/m | 14.9x | 4.0x | 3.2x | 9.1x | 7.1x | 29.7x | 3.6% |
CEG | $101.4B | 27.5x | 24.1x | 3.2x | 3.1x | 3.4x | 3.2x | 14.7x | 0.3% |
AEP | $65.8B | 20.8x | 19.0x | 2.9x | 2.8x | 6.0x | 5.7x | 13.8x | 13.6% |
| Ticker | Mkt cap | P/E | P/E fwd | P/S | P/S fwd | P/GP | P/GP fwd | EV/EBITDA | FCF yld |
|---|---|---|---|---|---|---|---|---|---|
D | $58.6B | 23.0x | 18.6x | 3.2x | 3.2x | 6.5x | 6.5x | 15.2x | -11.7% |
DUK | $96.6B | 18.6x | 18.5x | 2.9x | 2.9x | 4.2x | 4.2x | 11.6x | 1.6% |
SO | $106.6B | 22.2x | 20.2x | 3.5x | 3.5x | 8.1x | 8.0x | 12.7x | 2.4% |
| Ticker | Mkt cap | P/E | P/E fwd | P/S | P/S fwd | P/GP | P/GP fwd | EV/EBITDA | FCF yld |
|---|---|---|---|---|---|---|---|---|---|
XEL | $48.6B | 23.3x | 19.0x | 3.3x | 3.1x | 17.4x | 16.2x | 13.9x | -6.7% |
NEE | $174.5B | 18.7x | 20.8x | 6.0x | 5.6x | 8.4x | 7.8x | 15.9x | -5.8% |
CWEN | $6.6B | 42.5x | — | 4.2x | 4.0x | 8.0x | 7.6x | 14.6x | 10.1% |
| Ticker | Mkt cap | P/E | P/E fwd | P/S | P/S fwd | P/GP | P/GP fwd | EV/EBITDA | FCF yld |
|---|---|---|---|---|---|---|---|---|---|
BEP | $10.1B | 71.5x | — | 1.6x | 1.5x | 6.5x | 6.2x | 9.9x | -46.9% |
XIFR | $1.1B | 16.6x | 8.2x | 0.9x | 0.8x | 5.0x | 4.5x | 8.9x | -60.4% |
GEV | $254.8B | 27.1x | 31.1x | 6.2x | 5.5x | 30.5x | 27.3x | 28.4x | 4.9% |
| Ticker | Mkt cap | P/E | P/E fwd | P/S | P/S fwd | P/GP | P/GP fwd | EV/EBITDA | FCF yld |
|---|---|---|---|---|---|---|---|---|---|
FSLR | $22.7B | 13.0x | 11.9x | 4.2x | 4.5x | 9.6x | 10.2x | 8.6x | 5.1% |
BKR | $64.0B | 20.5x | 24.9x | 2.3x | 2.3x | 9.8x | 9.7x | 13.6x | 4.9% |
Consensus projections
| Ticker | FY2026E | FY2027E | FY2028E | |
|---|---|---|---|---|
FRVO | Revenue | +4122.5% | +1151.1% | +216.0% |
| EPS | −91.9% | −17.9% | −36.7% | |
ORA | Revenue | +21.2% | −0.1% | +11.5% |
| EPS | +15.5% | −0.5% | +27.3% | |
OKLO | Revenue | — | +247.3% | +577.4% |
| EPS | +50.0% | +10.3% | +16.5% | |
FRMI | Revenue | +14.5% | +2797.8% | +327.6% |
| EPS | +326.2% | −116.4% | +1983.0% | |
VST | Revenue | +18.9% | +9.1% | +4.6% |
| EPS | +85.4% | +19.1% | +17.0% | |
NRG | Revenue | +20.5% | +1.8% | +4.9% |
| EPS | +14.6% | +24.0% | +16.0% | |
TLN | Revenue | +85.7% | +15.6% | +5.1% |
| EPS | +256.0% | +51.3% | +20.9% | |
CEG | Revenue | +35.3% | +4.1% | +5.2% |
| EPS | +25.2% | +13.1% | +28.6% | |
AEP | Revenue | +9.5% | +5.9% | +7.6% |
| EPS | +7.9% | +7.6% | +10.7% | |
D | Revenue | +13.3% | +6.3% | +5.7% |
| EPS | +5.0% | +6.3% | +7.0% | |
DUK | Revenue | +5.8% | +4.6% | +4.2% |
| EPS | +6.3% | +6.9% | +7.0% | |
SO | Revenue | +7.7% | +5.5% | +6.1% |
| EPS | +6.8% | +7.5% | +9.2% | |
XEL | Revenue | +7.8% | +8.9% | +8.1% |
| EPS | +8.0% | +10.4% | +10.1% | |
NEE | Revenue | +10.4% | +9.9% | +8.6% |
| EPS | +9.0% | +9.2% | +8.3% | |
CWEN | Revenue | +14.8% | +10.8% | +13.4% |
| EPS | −133.6% | −152.5% | +132.7% | |
BEP | Revenue | +3.8% | +9.0% | −3.4% |
| EPS | +14.0% | −11.7% | +9.4% | |
XIFR | Revenue | +0.1% | +6.2% | +2.2% |
| EPS | −999.6% | −27.2% | −79.4% | |
GEV | Revenue | +23.9% | +14.7% | +15.2% |
| EPS | +323.0% | −19.0% | +39.9% | |
FSLR | Revenue | −1.1% | +17.0% | +11.0% |
| EPS | +21.1% | +34.6% | +22.8% | |
BKR | Revenue | +1.9% | +9.8% | +7.0% |
| EPS | +5.3% | +14.3% | +18.5% |
Forward fiscal years only. Blank means no analyst coverage for that year.
The geothermal company that made money last quarter did not make most of it from geothermal.
Ormat Technologies, a Reno-based operator of geothermal and recovered-energy power plants across the United States, Kenya, Indonesia and Chile, reported second-quarter revenue of $258.8m, up 10.6%. Gross profit rose 20.8% to $68.7m and consolidated gross margin widened 220 basis points to 26.5%. The engine was Energy Storage, where revenue jumped 195% to $42.8m at a 56.2% segment gross margin, earned on merchant prices in PJM Interconnection, the mid-Atlantic grid. Management expects that margin to settle at 40–50% for the year.
The Electricity segment — the contracted geothermal baseload at the center of the data-center power argument — grew 5.8% to $169.3m, helped by the acquired Blue Mountain plant, higher Puna rates and less curtailment. Its full-year guide was cut by roughly $5m to $710–725m on one-to-two-month commissioning delays at two Caribbean projects. Below the gross-profit line, capital intensity bites: operating income fell 3.2% and net income 3.4%, on $3.4bn of debt at a 3.9% average rate, or 4.3x adjusted earnings before interest, taxes, depreciation and amortization (EBITDA).
What actually moved Fervo
Fervo Energy, a Houston developer with 199 employees that borrows horizontal drilling and fiber-optic sensing from shale to mine heat from hot rock, is the opposite balance sheet. It has 658 megawatts under binding power purchase agreements (PPAs) representing a $7.2bn revenue backlog — including two 15-year contracts totaling 320 MW with Southern California Edison — and raised its 2030 capacity target to 1.1 gigawatts. Its widely cited 3-gigawatt framework with Google is described in Fervo's own registration statement as non-binding, with no obligation on Google to buy power.
Quarterly revenue was $113,000. On 12 August Fervo reported a $55.9m net loss, or -$0.38 a share against estimates nearer -$0.09, and guided 2027 revenue to $60–80m; the shares fell 16.6% that session. The guide is not an execution failure — it reflects curtailment on third-party transmission lines leaving Cape Station after the line's operator added another asset. GeoBlocks 1 and 2 are mechanically complete, with first power targeted for the fourth quarter, and the drilling curve is improving: a record 19,500-foot well drilled in 21 days.
Over the 30 days to 21 August, Fervo fell 39% while Ormat rose 4.6%. In the four sessions around Fervo's print, Ormat moved -0.4%. The long bond explains only the tail: the 30-year Treasury yield reached 5.311% on 17 August, a 19-year high, and from 14 to 21 August Ormat lost 5.5% and Fervo 13.9%, against 1.2% to 3.1% declines at regulated utilities. Nor is tax policy the culprit: under the 2025 federal budget law, geothermal keeps the full credit if construction starts by 2033, while wind and solar face 2026 deadlines.
The divergence that matters
Ormat's de-rating happened in June and July, not August. Shares fell 22.6% from 16 June, the day Bernstein initiated coverage at Underperform with a $115 target, doubting it could compete with Fervo in enhanced geothermal. Ormat's answer is procurement, not laboratory work: a collaboration with oilfield-services firm SLB whose Desert Peak pilot drills in the fourth quarter, a $25m stake in Sage Geosystems, and a new 100-megawatt modular turbine unit for large-scale enhanced systems. Its data-center exposure is already signed — roughly 13 MW to Switch on a 20-year term and up to 150 MW through NV Energy to serve Google's Nevada operations.
The price paid for that has fallen while the profit grew. Ormat costs 20.1x trailing gross profit, against about 25.9x in May and 26.5x in February, even as trailing gross profit rose 21.7% to $331.9m. Enterprise value to trailing EBITDA is 22.0x — the fairer lens for a leveraged generator than 52.1x trailing earnings. The catch sits in consensus: analysts model FY2026 revenue of $1.177bn, then $1.176bn in 2027. Flat.
Fervo cannot be valued on earnings. It trades at 1.78x book, and $2.1bn of cash is 43% of its market value, leaving enterprise value near $4.5m per contracted megawatt. Second-half capex of $850–900m against that cash implies roughly fourteen months of runway before project debt or equity is needed. The May initial public offering raised $2.04bn at $27.00 a share, putting a standard lockup expiry in mid-November — inside the window.
The setup
Where it stands — One profitable incumbent re-rated cheaper on growing profit; one developer marked down on its own loss and a transmission constraint. Would confirm — Fervo delivers first power from GeoBlock 1 by 31 December and announces a behind-the-meter data-center contract. Would invalidate — Ormat's Electricity segment misses the reduced $710–725m guide, or storage margin falls below the 40% floor. Watch next — Fervo's IPO lockup expires mid-November 2026; Ormat's third-quarter report follows in early November. Valuation — Ormat: 20.1x trailing gross profit versus 25.9x in May, 42.9x forward earnings; Fervo: 1.78x book, no earnings.