

AI Engineering-Services Bucket's Bear Label Masks a Sharp Split, Not Cohort Rot
Hypothesis Opus 5 · Research Sonnet 5 · Writing Sonnet 5 · Prompt v1.0
The seven-name AI2 Engineering Services & Grid Interconnection bucket's -4% 30-day and still bearish label is driven almost entirely by the government/water design-consultancy leg (ACM, STN, WSP.TO, TTEK), whose backlogs and book-to-bill are still growing; the T&D and site-services leg (MYRG, WSC, and UTI as a labor-pipeline proxy) has been in strong- or mild-bull bands for months, and AECOM's 222-day strongly bearish streak looks more like a cash-flow/valuation de-rating than a data-center demand problem.
| Ticker | Company | Segment | Trend · 13mo | 30D | 1Y |
|---|---|---|---|---|---|
| The subject · what this brief is about | |||||
ACM | Aecom | Design & Engineering Consulting | ⚠️ Emerging Bear | +5.9% | −34.3% |
STN | Stantec | Design & Engineering Consulting | 🔴 Cont. Bear | +4.0% | −33.9% |
WSP.TO | WSP Global | Engineering & Construction | 🔴 Cont. Bear | −2.6% | −40.3% |
TTEK | Tetra Tech | Design & Engineering Consulting | ⚠️ Emerging Bear | +17.0% | −9.5% |
MYRG | MYR | Electrical & Power Infrastructure | 🟢 Cont. Bull | −35.7% | +62.5% |
UTI | Universal Technical Institute | Career & Technical Training | 🌱 Emerging Bull | −0.7% | +30.0% |
WSC | WillScot | Modular & Portable Storage | 🌱 Emerging Bull | −16.1% | −21.9% |
| Compared against · context, not the story | |||||
EME | EMCOR | Electrical & Power Infrastructure | 🟢 Cont. Bull | −17.4% | +5.9% |
12-month price & trend
| Ticker | Mkt cap | P/E | P/E fwd | P/S | P/S fwd | P/GP | P/GP fwd | EV/EBITDA | FCF yld |
|---|---|---|---|---|---|---|---|---|---|
ACM | $9.3B | 17.2x | 12.2x | 0.6x | 1.2x | 7.5x | 15.3x | 9.3x | 4.4% |
STN | $8.0B | 23.0x | 16.0x | 1.4x | 1.1x | 3.3x | 2.6x | 12.4x | 6.0% |
WSP.TO | $23.1B | 23.3x | 14.9x | 1.3x | 1.4x | 7.3x | 8.1x | 13.3x | 7.5% |
| Ticker | Mkt cap | P/E | P/E fwd | P/S | P/S fwd | P/GP | P/GP fwd | EV/EBITDA | FCF yld |
|---|---|---|---|---|---|---|---|---|---|
TTEK | $8.6B | 19.9x | 21.1x | 1.7x | 2.0x | 9.0x | 10.5x | 14.1x | 6.4% |
MYRG | $5.2B | 31.3x | 28.3x | 1.3x | 1.2x | 10.4x | 9.8x | 18.4x | 4.3% |
UTI | $2.2B | 49.9x | 50.3x | 2.5x | 2.4x | 5.1x | 4.9x | 21.4x | 0.1% |
| Ticker | Mkt cap | P/E | P/E fwd | P/S | P/S fwd | P/GP | P/GP fwd | EV/EBITDA | FCF yld |
|---|---|---|---|---|---|---|---|---|---|
WSC | $4.3B | n/m | 21.9x | 1.9x | 1.9x | 3.9x | 3.9x | 22.6x | 12.5% |
EME | $40.7B | 30.8x | 31.1x | 2.3x | 2.1x | 11.7x | 11.0x | 19.8x | 2.7% |
Consensus projections
| Ticker | FY2026E | FY2027E | FY2028E | |
|---|---|---|---|---|
ACM | Revenue | +4.5% | +6.1% | +4.2% |
| EPS | +13.7% | +12.8% | +13.4% | |
STN | Revenue | +10.4% | +5.8% | +7.3% |
| EPS | +14.5% | +11.1% | +22.0% | |
WSP.TO | Revenue | +18.9% | +7.5% | +6.9% |
| EPS | +19.5% | +14.6% | +13.8% | |
TTEK | Revenue | −3.7% | +4.3% | +2.0% |
| EPS | +3.8% | +10.1% | +11.7% | |
MYRG | Revenue | +19.4% | +14.0% | +9.1% |
| EPS | +66.3% | +18.1% | +22.2% | |
UTI | Revenue | +9.4% | +9.0% | +9.3% |
| EPS | −26.2% | +9.5% | +58.5% | |
WSC | Revenue | −0.0% | +3.3% | +4.9% |
| EPS | −3.3% | +22.3% | +34.3% | |
EME | Revenue | +13.3% | +7.5% | +6.9% |
| EPS | +15.8% | +11.2% | +13.6% |
Forward fiscal years only. Blank means no analyst coverage for that year.
What the bands actually show
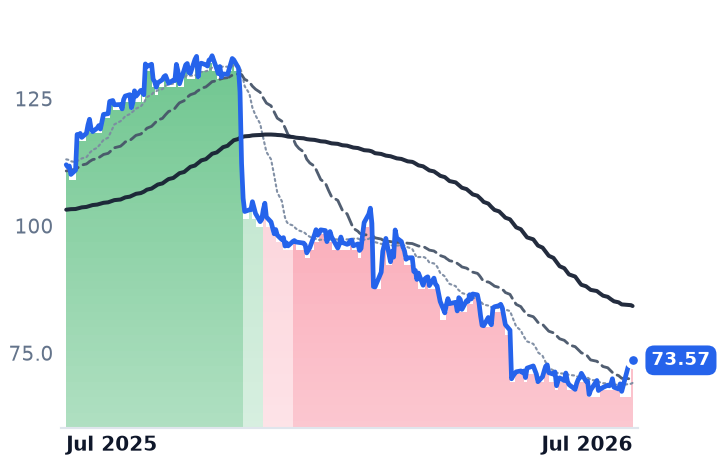
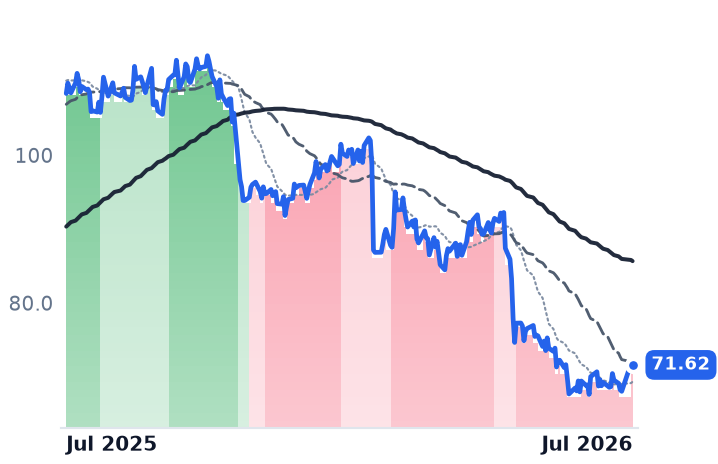
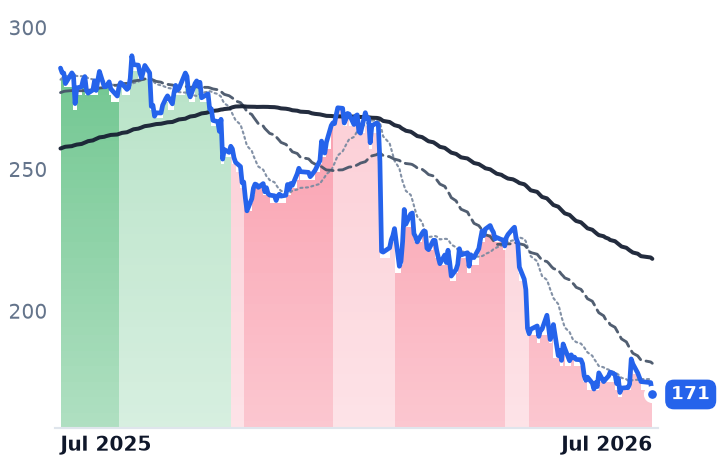
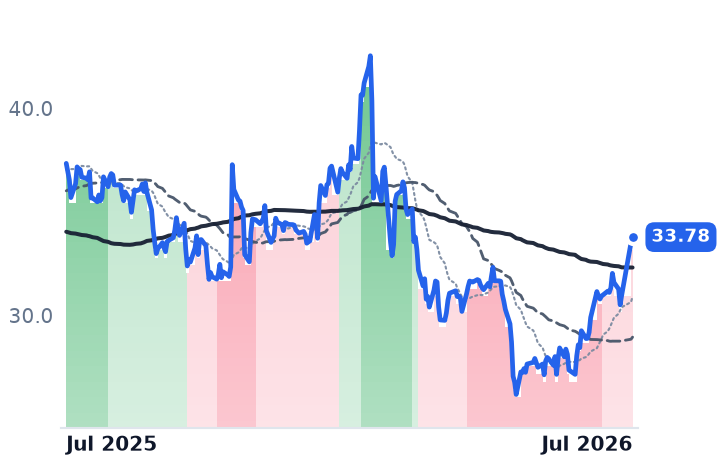
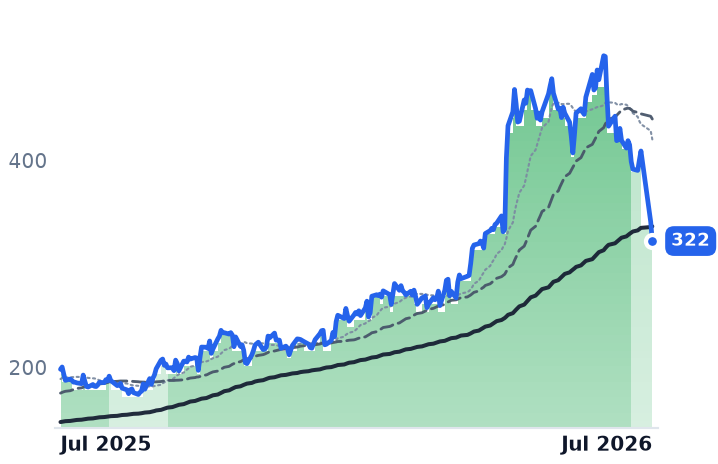
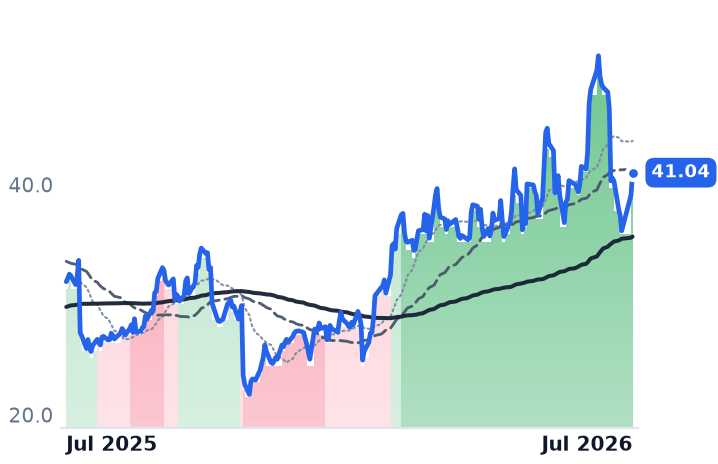
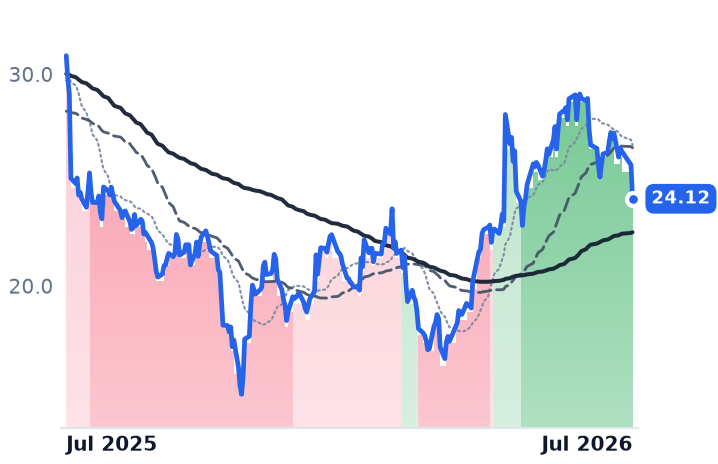
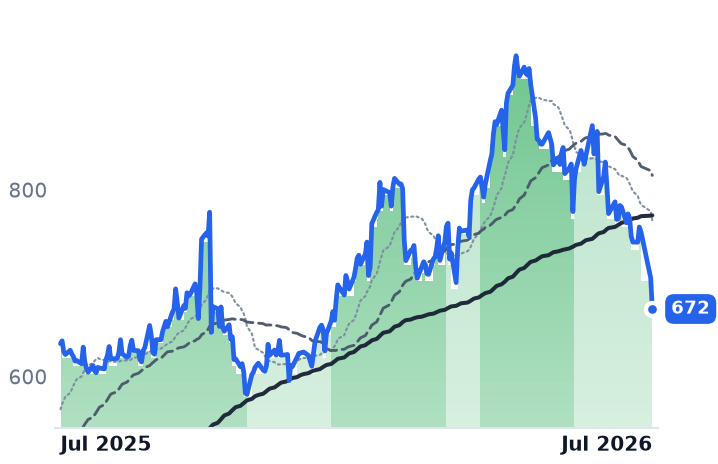
As of July 29, AECOM, Stantec and WSP Global sit in strongly bearish bands and Tetra Tech in mildly bearish, while MYR Group is mildly bullish and both WillScot and Universal Technical Institute are strongly bullish. AECOM has been continuously strongly bearish since December 22, 2025 — 222 straight days. Trailing 12-month returns confirm the split: ACM -34.9%, STN -34.0%, WSP.TO -40.6%, TTEK -10.0% versus MYRG +62.5% and UTI +30.0% (WSC lags at -22.6%). The bucket's -4% average 30-day return is an artifact of averaging a group whose actual dispersion runs from ACM +5.4% to MYRG -35.7% over the same window — the label obscures rather than describes what's happening.
The consultancy leg looks de-rated, not broken
AECOM's May 12 sell-off was triggered by a revenue miss and negative free cash flow, not weakening demand — flat $3.80B revenue against $4.01B consensus and FCF of -$27.4M versus +$178.4M a year earlier, even as adjusted EPS beat and guidance ticked up Yahoo Finance. Despite that reaction, AECOM's backlog kept climbing to a record ~$26B with book-to-burn above 1.0 for a 21st straight quarter, while Zacks' FY26 EPS estimate actually rose Barchart. Tetra Tech's backlog rose 8% sequentially to $4.28B on federal defense and water-utility work, and a Black & Veatch–Stantec joint venture just won an $85M Army Corps design contract, with the sector still drawing on roughly $15B in annual IIJA funding plus emerging AI-datacenter cooling demand Stocktitan. That said, the IIJA expires September 30, 2026, and Congress has already rescinded over $2.3B in allocations, a real funding-cliff overhang for this leg FundingLandscape.
The T&D and site-services leg tells a different story
WillScot's data-center-linked volume rose 70% year-over-year, and Q1 modular activations were up 8% for a second straight quarter even as broad non-residential construction starts fell 6% IndexBox. MYR Group's steep 30-day drop lines up with its July 29 earnings release rather than a confirmed post-print reaction Stocktitan. Adjacent name EMCOR's mildly bullish-to-mildly bearish flip also appears tied to pre-earnings positioning rather than a fresh downgrade — Goldman held a Hold rating on July 20, and the decline preceded its own July 30 print QuiverQuant.
Together, the evidence points to a valuation and funding-policy story in the consulting leg layered on top of a still-intact grid-services leg — the bucket's still bearish label captures the former while obscuring the latter.