

Gas Producers Grind Into Bear Bands While Midstream and LNG Stay Bullish
Hypothesis Opus 5 · Research Sonnet 5 · Writing Sonnet 5 · Prompt v1.0
Five gas-weighted E&Ps (CRK, EQT, RRC, AR, TOU.TO) have been sliding into bear trend bands over a genuine 30-90+ day window behind a persistent storage surplus and Permian associated-gas growth, but the midstream/LNG leg (WMB, KMI, LNG) and Canadian producer ARX.TO remain in bull bands, so last week's sharp Henry Hub drop looks like it's compounding an existing producer downtrend rather than confirming a whole-category bear turn.
| Ticker | Company | Segment | Trend · 13mo | 30D | 1Y |
|---|---|---|---|---|---|
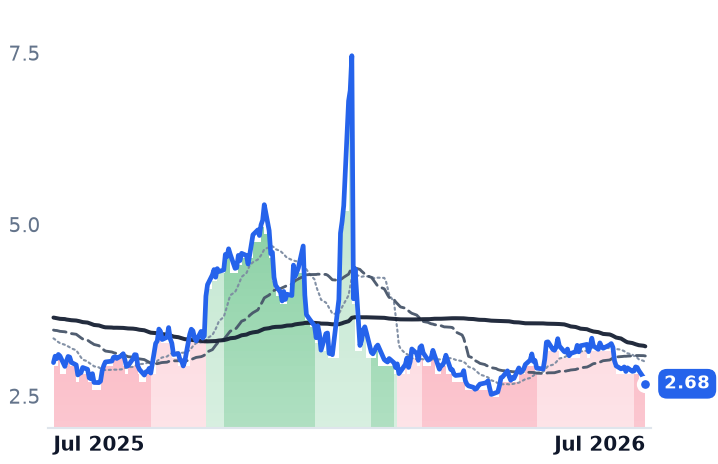
NG=F | Natural Gas Sep 26 | — | 🔴 Cont. Bear | −15.8% | −10.3% |
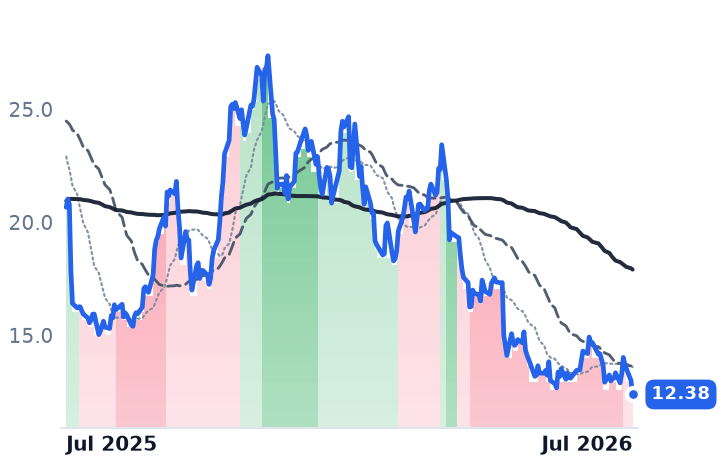
CRK | Comstock Resources | Diversified Onshore & Conventional | ⚠️ Emerging Bear | −12.8% | −40.1% |
EQT | EQT | Appalachian Shale Gas | ⚠️ Emerging Bear | −0.7% | +0.4% |
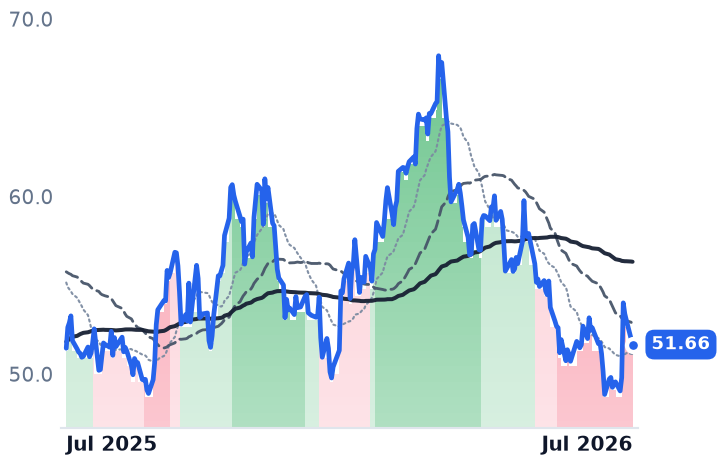
RRC | Range Resources | Appalachian Shale Gas | 🔴 Cont. Bear | +5.3% | +8.4% |
AR | Antero Resources | Appalachian Shale Gas | 🔴 Cont. Bear | −1.6% | +3.8% |
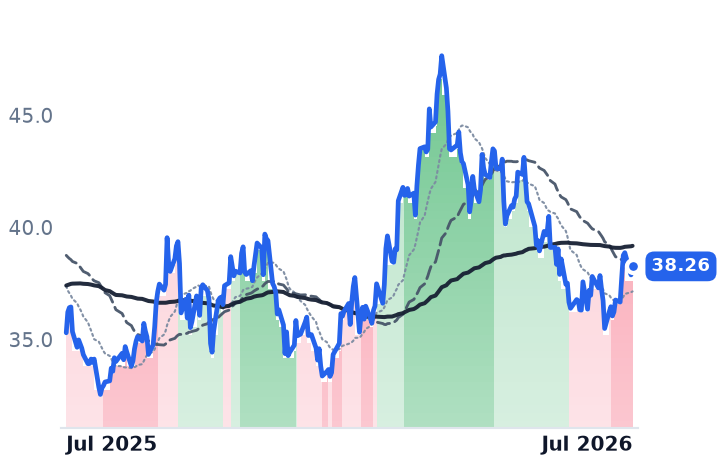
TOU.TO | Tourmaline Oil | Oil & Gas Exploration & Production | ⚠️ Emerging Bear | +6.3% | +6.0% |
ARX.TO | ARC Resources | — | 🌱 Emerging Bull | +8.5% | +21.4% |
WMB | The Williams Companies | Natural Gas Pipelines & Transmission | 🟢 Cont. Bull | −6.5% | +24.9% |
KMI | Kinder Morgan | Natural Gas Pipelines & Transmission | 🟢 Cont. Bull | −2.0% | +19.9% |
LNG | Cheniere Energy | LNG Export & Infrastructure | 🟢 Cont. Bull | +3.4% | +11.2% |
12-month price & trend
| Ticker | Mkt cap | P/E | P/E fwd | P/S | P/S fwd | P/GP | P/GP fwd | EV/EBITDA | FCF yld |
|---|---|---|---|---|---|---|---|---|---|
NG=F | — | — | — | — | — | — | — | — | — |
CRK | $3.9B | 7.6x | 32.0x | 2.1x | 2.0x | 3.1x | 3.0x | 5.2x | -18.7% |
EQT | $33.8B | 11.9x | 12.8x | 3.6x | 3.6x | 5.3x | 5.2x | 6.4x | 11.1% |
| Ticker | Mkt cap | P/E | P/E fwd | P/S | P/S fwd | P/GP | P/GP fwd | EV/EBITDA | FCF yld |
|---|---|---|---|---|---|---|---|---|---|
RRC | $9.3B | 11.0x | 9.7x | 2.8x | 2.6x | 5.9x | 5.5x | 7.2x | 12.6% |
AR | $11.6B | 10.8x | 9.0x | 2.0x | 1.7x | 4.4x | 3.8x | 6.8x | 12.1% |
TOU.TO | $23.0B | 61.0x | 13.1x | 4.0x | 3.4x | 75.6x | 65.7x | 6.7x | 0.9% |
| Ticker | Mkt cap | P/E | P/E fwd | P/S | P/S fwd | P/GP | P/GP fwd | EV/EBITDA | FCF yld |
|---|---|---|---|---|---|---|---|---|---|
ARX.TO | — | — | — | — | — | — | — | — | — |
WMB | $90.1B | 29.2x | 30.4x | 7.4x | 7.3x | 10.0x | 10.0x | 16.2x | -0.2% |
KMI | $70.7B | 20.3x | 20.9x | 3.9x | 3.9x | 7.2x | 7.1x | 12.7x | 5.5% |
| Ticker | Mkt cap | P/E | P/E fwd | P/S | P/S fwd | P/GP | P/GP fwd | EV/EBITDA | FCF yld |
|---|---|---|---|---|---|---|---|---|---|
LNG | $56.9B | 20.1x | — | 2.6x | 2.6x | 4.8x | 4.8x | 10.0x | 12.4% |
Consensus projections
| Ticker | FY2026E | FY2027E | FY2028E | |
|---|---|---|---|---|
CRK | Revenue | +2.5% | +16.5% | +12.5% |
| EPS | −20.6% | +71.4% | +79.2% | |
EQT | Revenue | +12.9% | −0.5% | +9.5% |
| EPS | +43.8% | −5.2% | +31.6% | |
RRC | Revenue | +17.7% | +2.8% | +7.2% |
| EPS | +41.8% | −3.5% | +16.8% | |
AR | Revenue | +30.3% | +0.3% | +7.0% |
| EPS | +130.9% | +1.8% | +26.1% | |
TOU.TO | Revenue | +10.2% | +8.9% | −1.3% |
| EPS | +44.6% | +7.4% | +6.3% | |
WMB | Revenue | +7.4% | +9.9% | +12.7% |
| EPS | +14.1% | +4.5% | +18.3% | |
KMI | Revenue | +8.2% | +1.9% | +5.8% |
| EPS | +18.1% | +0.8% | +8.6% | |
LNG | Revenue | +11.9% | +6.0% | +3.4% |
| EPS | −141.4% | −345.2% | −8.0% |
Forward fiscal years only. Blank means no analyst coverage for that year.
A real producer-side transition, not a one-week wobble
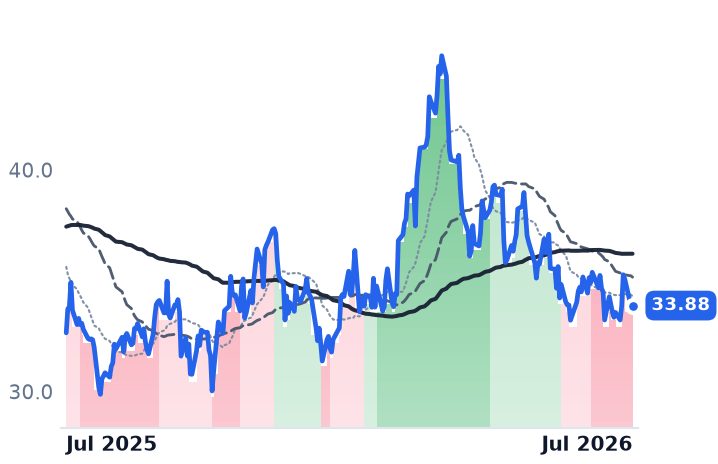
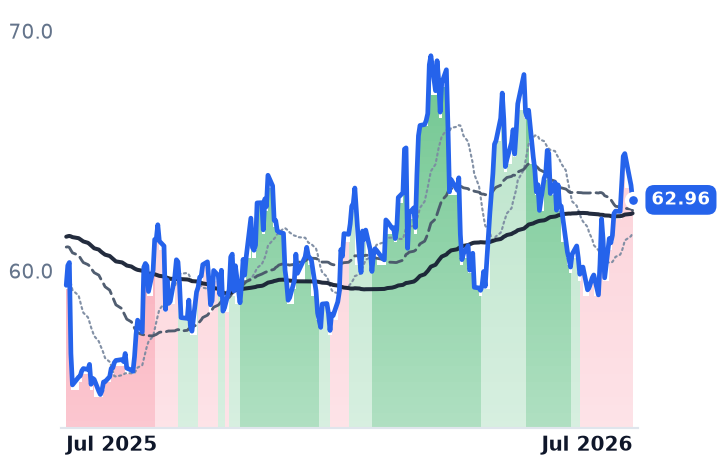
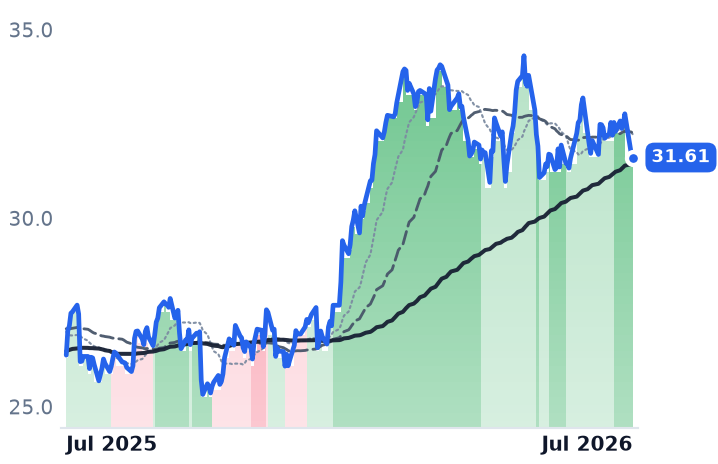
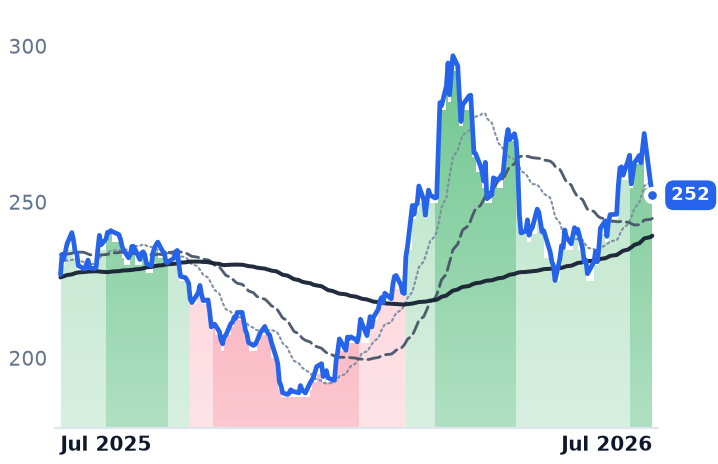
Trend-band data shows the pure-play gas producer cohort actually rolled over months ago, not last week. CRK flipped to strongly bearish on April 14, EQT moved from bull to mildly bearish on May 26 and strongly bearish by June 9, RRC went mildly bearish on June 17 and strongly bearish by July 14, AR completed a clean glide from strongly bullish to strongly bearish between late April and July 1, and TOU.TO turned mildly bearish on June 24. Henry Hub futures (NG=F) themselves have oscillated in mild/strong bear bands since March, deepening back to strongly bearish on July 21 and closing at $2.679 on July 28, down roughly 8% over five sessions.
That producer downtrend has real fundamental legs. US working gas storage sat 183-185 Bcf above the five-year average through mid-July, a persistent (if not obviously widening) surplus per EIA storage data, and the EIA's outlook points to record production, led by Permian growth, capping prices. Separately, EIA cut its 2027 Henry Hub forecast 11% specifically on associated-gas supply from the Permian. An internal analysis note from early May had already flagged CRK's bear-band flip alongside a strip trading below many Haynesville breakevens, predating the current sell-off by roughly three months. EQT's own unlevered breakeven near $2.00/MMBtu, per independent research, suggests it isn't yet in curtailment territory even at current prices.
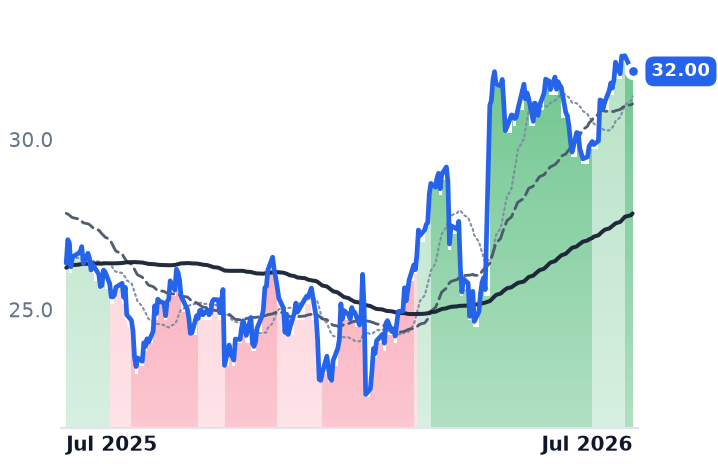
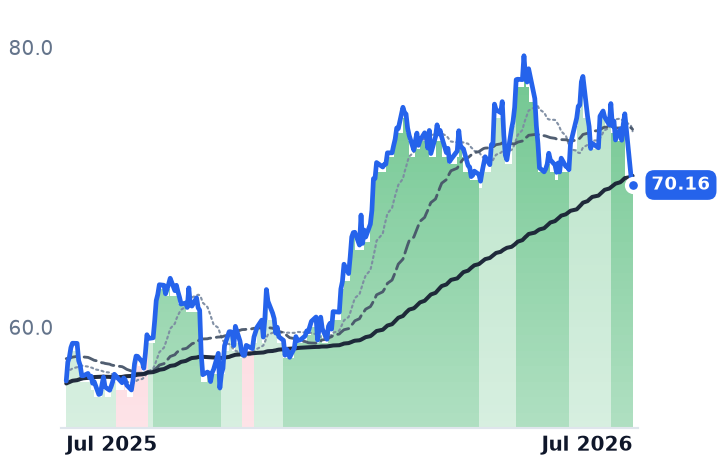
Midstream and LNG haven't confirmed the same regime
WMB and KMI cycled between mildly bullish and strongly bullish all quarter, and LNG only confirmed strongly bullish on July 14 — meaning its current pullback started from a freshly bullish trend, not a deteriorating one. Recent weakness in WMB (-6.8%) and LNG (-7.3%) lines up with a broader July 27 energy-complex risk-off day as gas hit an 11-week low alongside falling oil, plus scheduled Freeport LNG maintenance cutting feedgas. Neither looks like a fundamental turn: the 2027 winter Henry Hub strip still points above $4, US LNG exports are forecast to grow nearly 30% by 2027, and JPMorgan raised its LNG price target into the pullback per the same Cheniere coverage. Canadian producer ARX.TO has stayed in strongly bullish nearly the entire period, undercutting any claim of a uniform cohort-wide bear turn.