

PRIM & KRMN: Two Industrial Mid-Caps Down 30–40%, Two Very Different Stories
Prompt v1.0
Primoris (PRIM) suffered a single-event earnings collapse driven by self-inflicted solar execution failures, while Karman (KRMN) is in a slower valuation decompression weighed by leverage, insider selling, and post-IPO reality checks — yet both companies' underlying demand themes (datacenter power, missile defense) remain structurally intact, creating a tale of two very different risk profiles masquerading as a similar sector pullback.
| Ticker | Company | Segment | Trend · 13mo | 30D | 1Y |
|---|---|---|---|---|---|
PRIM | Primoris Services | Energy & Power Project Solutions | 🟢 Cont. Bull | −36.0% | +53.9% |
KRMN | Karman | Missiles, Weapons & Fire Control | 🟢 Cont. Bull | −27.8% | +56.8% |
MTZ | MasTec | Electrical & Power Infrastructure | 🟢 Cont. Bull | +15.9% | +179.5% |
EME | EMCOR | Electrical & Power Infrastructure | 🟢 Cont. Bull | +15.2% | +110.1% |
PWR | Quanta Services | Electrical & Power Infrastructure | 🟢 Cont. Bull | +28.0% | +128.8% |
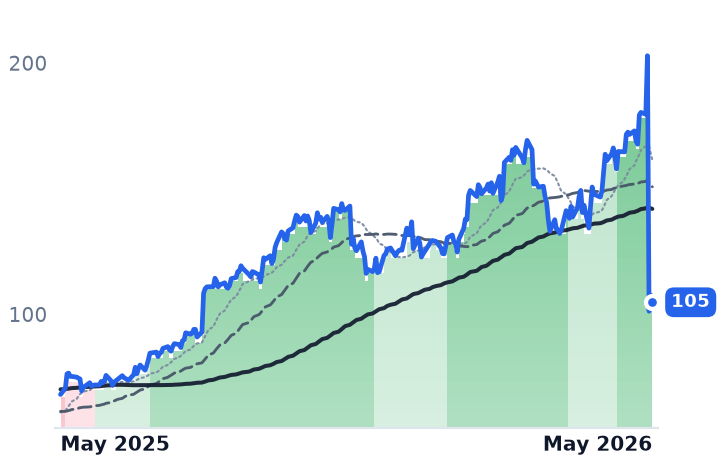
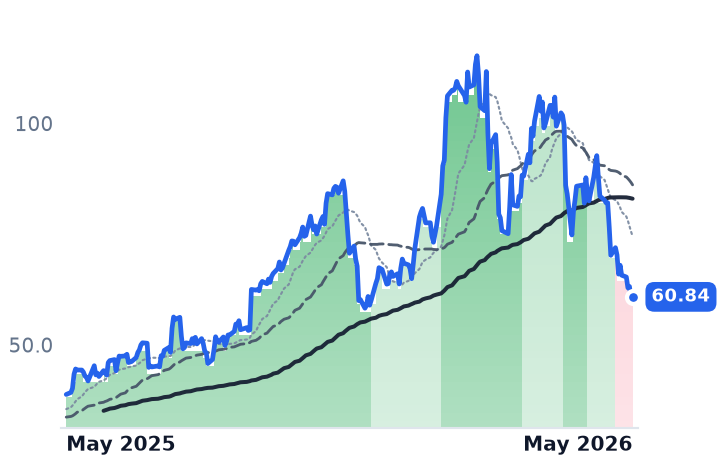
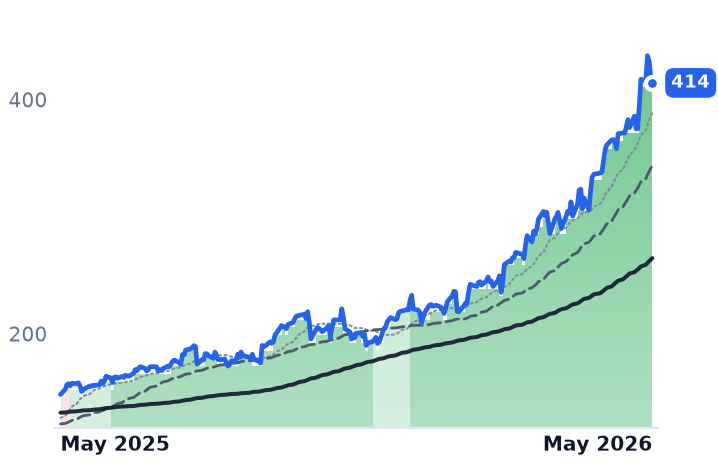
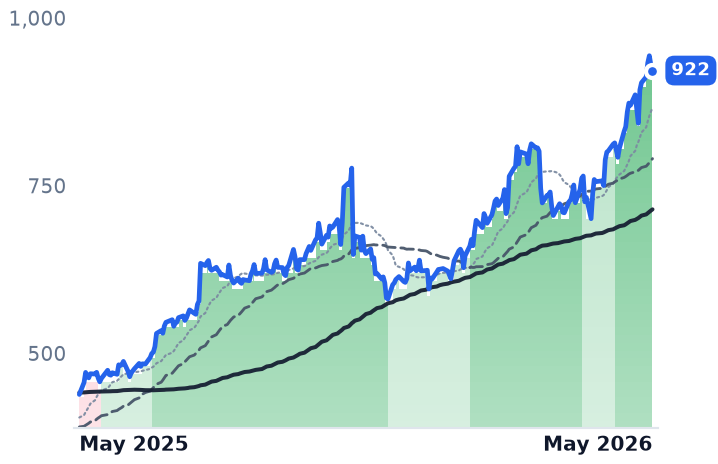
12-month price & trend
| Ticker | Mkt cap | P/E | P/E fwd | P/S | P/S fwd | P/GP | P/GP fwd | EV/EBITDA | FCF yld |
|---|---|---|---|---|---|---|---|---|---|
PRIM | $6.1B | 24.7x | 23.4x | 0.8x | 0.8x | 7.9x | 7.7x | 14.4x | 2.7% |
KRMN | $8.3B | 277.7x | 101.1x | 15.9x | 11.4x | 41.5x | 29.7x | 66.1x | -0.4% |
MTZ | $21.1B | 41.4x | 28.6x | 1.3x | 1.2x | 11.4x | 10.0x | 21.9x | 1.2% |
| Ticker | Mkt cap | P/E | P/E fwd | P/S | P/S fwd | P/GP | P/GP fwd | EV/EBITDA | FCF yld |
|---|---|---|---|---|---|---|---|---|---|
EME | $40.7B | 30.8x | 31.1x | 2.3x | 2.1x | 11.7x | 11.0x | 19.8x | 2.7% |
PWR | $100.3B | 75.5x | 42.9x | 3.1x | 2.7x | 21.2x | 18.5x | 35.1x | 2.4% |
Consensus projections
| Ticker | FY2026E | FY2027E | FY2028E | |
|---|---|---|---|---|
PRIM | Revenue | +2.8% | +11.4% | +7.6% |
| EPS | −12.3% | +24.1% | +10.2% | |
KRMN | Revenue | +55.3% | +28.0% | +25.9% |
| EPS | +71.4% | +51.4% | +31.2% | |
MTZ | Revenue | +30.5% | +20.3% | +14.5% |
| EPS | +43.0% | +34.8% | +28.0% | |
EME | Revenue | +13.3% | +7.5% | +6.9% |
| EPS | +15.8% | +11.2% | +13.6% | |
PWR | Revenue | +34.0% | +15.2% | +13.1% |
| EPS | +46.4% | +16.9% | +17.3% |
Forward fiscal years only. Blank means no analyst coverage for that year.
What's happening
Two mid-cap industrials riding the hottest secular themes of 2025–2026 — AI-driven power infrastructure and defense modernization — have shed 30–40% from recent peaks while their sector peers rip higher. But peel back the tape and these are fundamentally different situations.
PRIM: Single-event earnings gap, not a slow bleed
Primoris's -42% five-day collapse (May 5–8) was a hard earnings reset, not a multi-week deterioration. The price chart shows PRIM actually recovered to ~$180 by May 5 before a catastrophic one-day gap on May 6 to ~$101 on 13.2M shares (vs. a ~1M daily average) — squarely a single-event earnings gap.
PRIM Q1 2026 adjusted EPS came in at $0.59, missing the Zacks consensus of $0.87 by 32%, with revenue of $1.56B missing estimates by 10%. Management traced the damage to six solar projects booked in 2024 that suffered cost overruns from labor issues, project redesigns, geographic inexperience, and weather — forcing a full-year adjusted EPS guidance cut to $4.80–$5.00 from prior guidance of $5.80–$6.00.
Management quantified a ~$110M full-year EBITDA impact in three buckets: ~$45M from a ~$400M renewables revenue pullback, ~$35–40M in Q1 project cost overruns, and ~$25M in residual margin drag as projects complete in Q2–Q3. Energy segment gross margin collapsed to 7.6% from 10.7% the prior year, and overall gross margin fell to 8.6% from 10.4%.
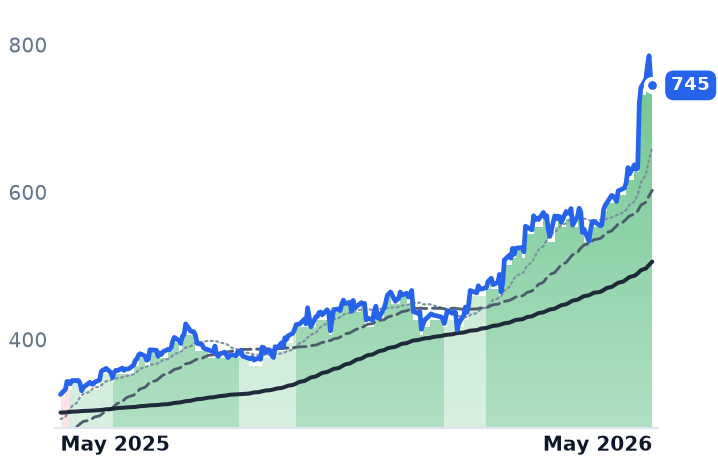
Critically, this is company-specific — not sector-wide. EPC peers MTZ gained +76% over the same three-month window ($235 → $414), PWR gained +60% ($464 → $745), and EME gained +30% ($708 → $921), all holding strong-bull trend bands throughout. PRIM's problems are self-inflicted.
The underlying franchise is intact. Utilities segment backlog grew $476M YoY to $6.9B; communications bookings topped $400M in Q1 alone tied to fiber/datacenter buildout; the gas generation funnel exceeded $7.1B. Total backlog stands at $11.6B ($7.5B in MSAs), with $1.1B in verbal awards expected to sign in H2 2026 and $2.8B additional signed by year-end. The May 1 acquisition of Paynecrest ($400M, funded by term loan) adds an electrical contractor with ~40% datacenter revenue exposure to a key hyperscaler client. At ~$105, forward P/E has reset to ~18x — a material discount from pre-earnings levels and approaching peer multiples.
KRMN: Gradual valuation decompression with structural overhangs
Karman's -38% three-month decline from its ~$106 March peak to ~$61 by May 8 is a different beast — a genuine multi-week technical deterioration. Its SMA-crossover trend band transitioned from strong-bull in late March to mild-bull through April, then flipped to mild-bear on April 27.
The fundamental demand thesis is unambiguously strong: Q4 2025 earnings raised 2026 revenue guidance to $715–730M (+53% YoY) and $207–218M adj. EBITDA (+46%), with $1B+ funded backlog providing ~80% revenue visibility. Pentagon-planned production increases — ~100% for AIM-9X, ~200% for THAAD and Standard Missile, ~300% for PAC-3 — and the Golden Dome initiative are direct tailwinds for KRMN's missile defense and hypersonics programs.
But the overhangs are real. KRMN insiders have made 0 purchases and 8 sales in the past six months, including ex-CEO Tony Koblinski selling 300,000 shares for ~$19.6M, with no insider buying post-drawdown. The company filed a brief 10-K delay in April 2026; Evercore ISI (Outperform, $125 PT) characterized it as procedural, noting a similar delay occurred during the IPO process. Net leverage sits at ~3x adjusted EBITDA with an interest coverage ratio of only 1.64x — elevated for a company still burning cash. TTM free cash flow is -$48.7M; analysts project FCF of $63M in 2026 and $92M in 2027.
The April 24 drop of -8.2% had no clear company-specific catalyst — analysts attributed it to post-earnings valuation re-rating, leverage/integration concerns from January's Seemann/MSC acquisition, and broad risk-off in aerospace/defense names. Institutional ownership is broadly stable at 73.3%, with Vanguard adding 5.6M shares (+151%), though T. Rowe Price removed 1.27M shares (-97.8%).
The valuation math remains the central challenge: trailing EV/EBITDA of 70.6x, trailing P/S of 16.8x, and forward FY2026 P/E of ~90x leave virtually no margin for integration missteps. Evercore, Piper Sandler ($127 PT, Overweight), KeyBanc, and Truist remain constructive on the thesis, while BWS Financial maintains a Sell citing FCF and rising contract assets.
Why it matters
These are two disconnects with entirely different characteristics. PRIM's drop is sharp, event-driven, and bounded by identifiable project-level remediation with a clear timeline (Q2–Q3 project completion, Paynecrest ramp, gas gen awards) — and the post-reset multiple is now meaningful relative to peers. KRMN's decline is slower but structurally more complex: a post-IPO valuation correction meeting real leverage, negative FCF, persistent insider selling, and contract-timing uncertainties from the federal CR — all while the defense demand backdrop strengthens. Both situations warrant continued monitoring of execution delivery rather than theme validity.