

NetApp's Earnings Multiple Doubled in 15 Weeks on 5% Revenue Growth
Hypothesis Opus 5 · Research Opus 5 · Writing Opus 5 · Prompt v1.4
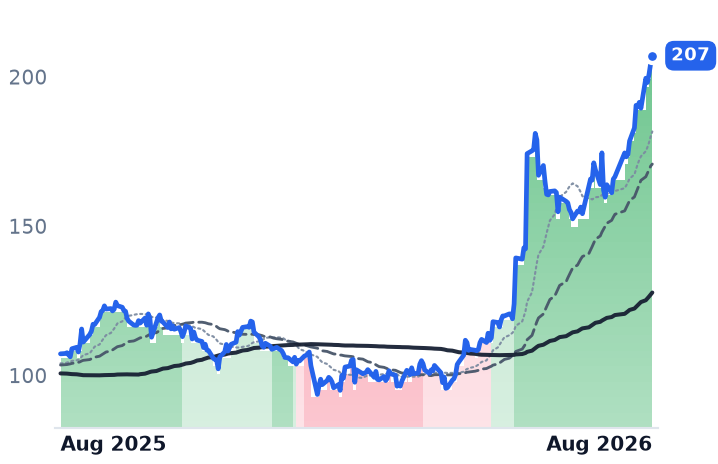
Three companies sold into the same AI build-out — a storage maker, a test-instrument maker and a small developer cloud — look like one advancing group. They are not. NetApp supplied nearly 60% of the month's gain, and it did so with no earnings report inside the window.
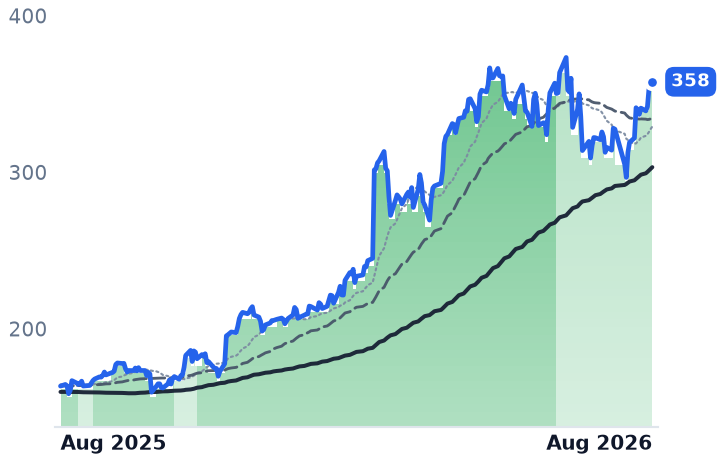
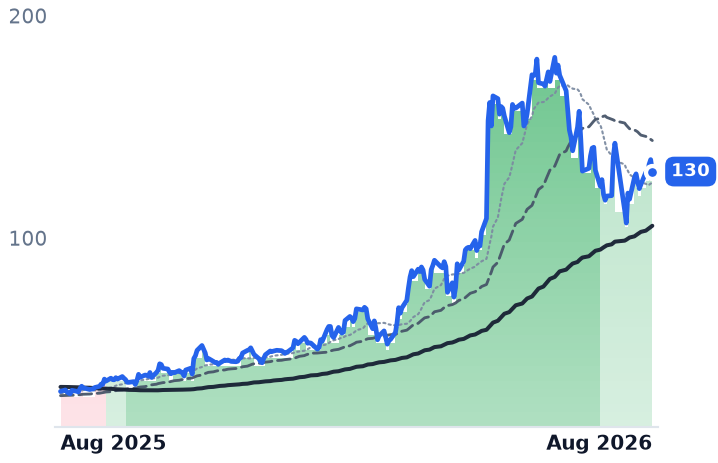
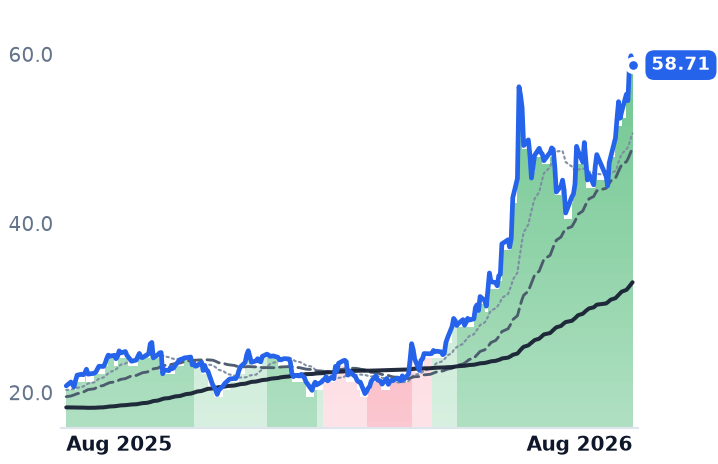
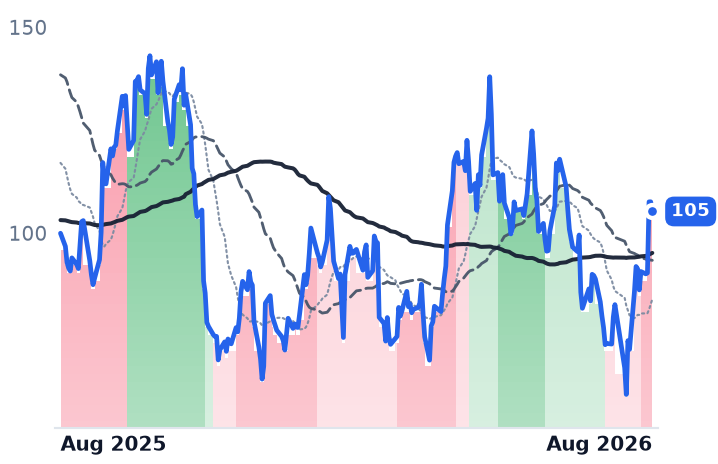
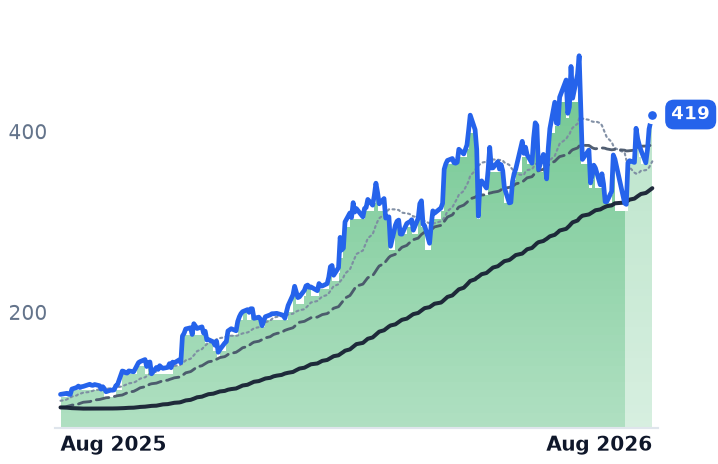
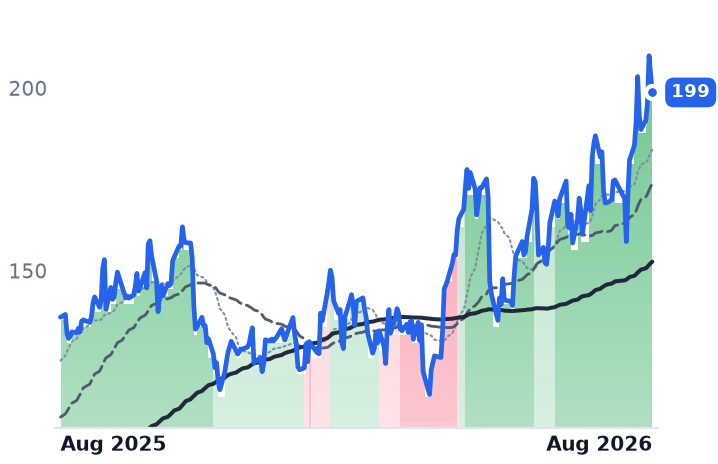
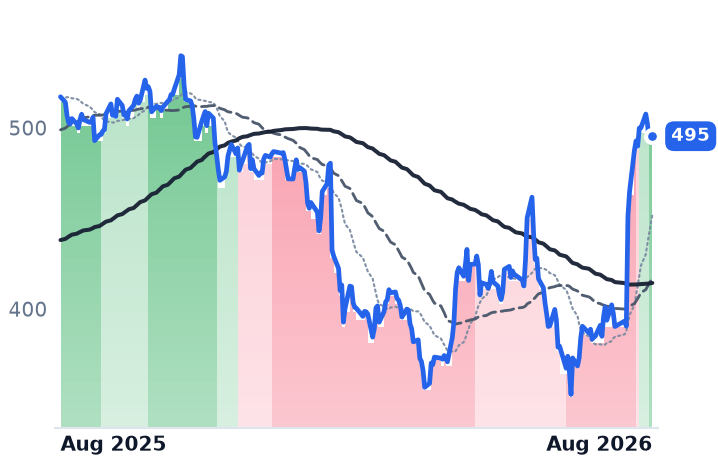
NetApp's fiscal 2026 revenue grew 5.4%, to $6.925bn. Its trailing price-to-earnings multiple has gone from 18.2x in early May to 32.2x, and at $207.08 the shares sit above Morgan Stanley's freshly raised $173 target. Keysight is the opposite case: revenue rose 31.5% last quarter, orders hit a record $2.05bn, and its multiple is unchanged since May — earnings grew into the price. DigitalOcean grew fastest and fell furthest, because its gross margin is going the wrong way.
Keysight reports on 18 August.
| Ticker | Company | Segment | Trend · 13mo | 30D | 1Y |
|---|---|---|---|---|---|
| The subject · what this brief is about | |||||
NTAP | NetApp | Enterprise Storage & Software | 🟢 Cont. Bull | +29.7% | +93.1% |
KEYS | Keysight Technologies | Instrumentation & Test Equipment | 🟢 Cont. Bull | +14.4% | +119.0% |
DOCN | DigitalOcean | Cloud Infrastructure & Platforms | 🟢 Cont. Bull | +11.0% | +318.6% |
| Compared against · context, not the story | |||||
DELL | Dell Technologies | Enterprise Storage & Software | 🟢 Cont. Bull | +25.4% | +258.9% |
HPE | Hewlett Packard Enterprise | Enterprise Storage & Software | 🟢 Cont. Bull | +30.1% | +182.4% |
STX | Seagate Technology | Data Storage Devices | 🟢 Cont. Bull | +30.6% | +535.1% |
SMCI | Super Micro Computer | Server & Infrastructure Systems | 🔴 Cont. Bear | +61.4% | −12.2% |
NBIS | Nebius | Cloud Infrastructure & AI | 🟢 Cont. Bull | +61.7% | +287.7% |
CRWV | CoreWeave | Cloud GPU Computing | 🔴 Cont. Bear | +44.4% | +5.3% |
TER | Teradyne | Semiconduct Equipment | 🟢 Cont. Bull | +29.9% | +283.6% |
ANET | Arista Networks | Cloud Networking | 🟢 Cont. Bull | +18.0% | +44.8% |
NTNX | Nutanix | Cloud Infrastructure & Platforms | 🌱 Emerging Bull | +19.3% | −3.0% |
MSFT | Microsoft | Cloud Infrastructure & Platforms | 🔴 Cont. Bear | +23.5% | −4.2% |
ORCL | Oracle | Cloud Infrastructure & Platforms | 🔴 Cont. Bear | +21.2% | −38.9% |
CLS | Celestica | Electronic Manufacturing Services | 🟢 Cont. Bull | +10.3% | +71.4% |
WDC | Western Digital | Data Storage Devices | 🟢 Cont. Bull | +9.0% | +579.5% |
KLAC | KLA | Semiconduct Equipment | ⚠️ Emerging Bear | −7.1% | −76.6% |
ADI | Analog Devices | Analog & Mixed-Signal | 🟢 Cont. Bull | +2.3% | +69.9% |
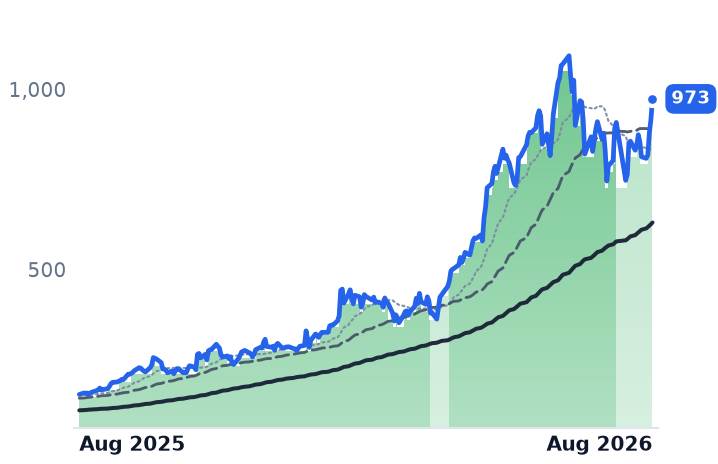
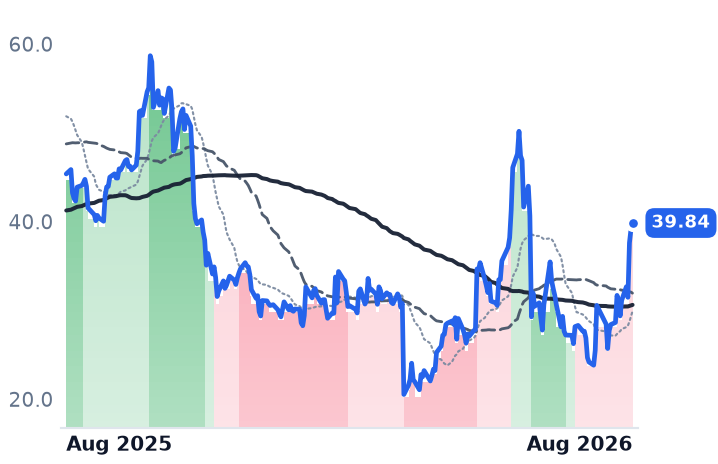
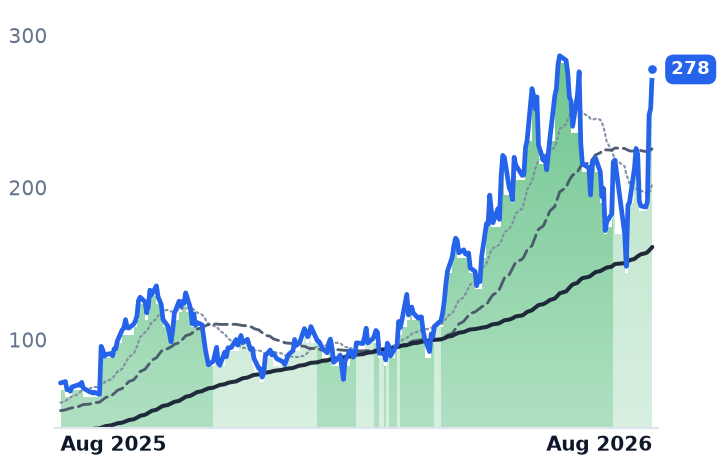
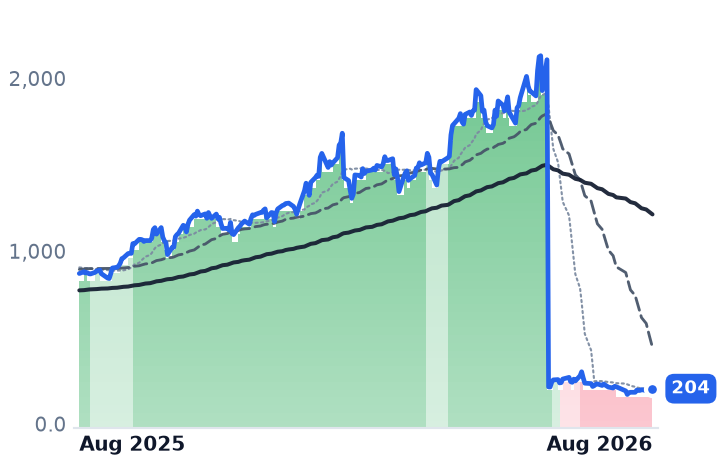
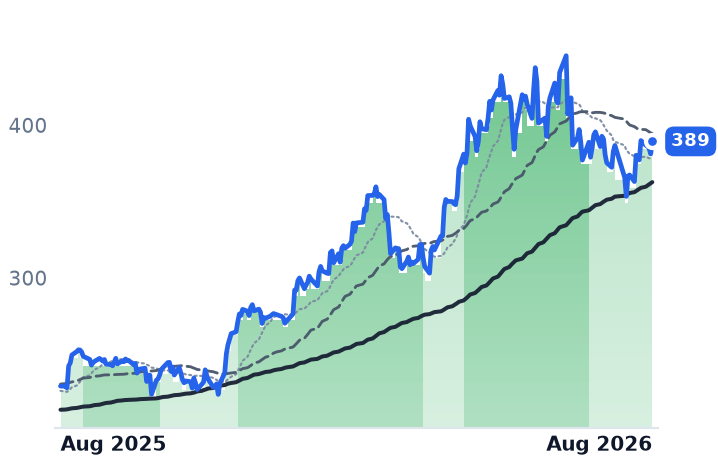
12-month price & trend
| Ticker | Mkt cap | P/E | P/E fwd | P/S | P/S fwd | P/GP | P/GP fwd | EV/EBITDA | FCF yld |
|---|---|---|---|---|---|---|---|---|---|
NTAP | $40.6B | 32.2x | 23.2x | 5.9x | 5.4x | 8.3x | 7.7x | 21.1x | 4.6% |
KEYS | $61.1B | 58.9x | 35.2x | 10.0x | 8.9x | 15.8x | 13.9x | 42.7x | 2.4% |
DOCN | $15.2B | 51.6x | 89.4x | 15.0x | 12.9x | 26.3x | 22.6x | 42.6x | 0.1% |
| Ticker | Mkt cap | P/E | P/E fwd | P/S | P/S fwd | P/GP | P/GP fwd | EV/EBITDA | FCF yld |
|---|---|---|---|---|---|---|---|---|---|
DELL | $326.2B | 38.4x | 26.6x | 2.4x | 1.9x | 12.8x | 10.0x | 23.4x | 2.9% |
HPE | $79.2B | 54.9x | 17.5x | 2.0x | 1.8x | 6.2x | 5.4x | 23.7x | 5.0% |
STX | $178.4B | 73.9x | 53.5x | 16.2x | 14.8x | 39.0x | 35.7x | 53.6x | 1.5% |
| Ticker | Mkt cap | P/E | P/E fwd | P/S | P/S fwd | P/GP | P/GP fwd | EV/EBITDA | FCF yld |
|---|---|---|---|---|---|---|---|---|---|
SMCI | $25.8B | 10.9x | 12.3x | 0.7x | 0.5x | 6.1x | 4.5x | 8.2x | -27.1% |
NBIS | $45.6B | 56.0x | — | 51.9x | 13.5x | 108.3x | 28.2x | 32.8x | -5.4% |
CRWV | $46.6B | n/m | — | 7.5x | 3.7x | 10.8x | 5.3x | 25.7x | -22.8% |
| Ticker | Mkt cap | P/E | P/E fwd | P/S | P/S fwd | P/GP | P/GP fwd | EV/EBITDA | FCF yld |
|---|---|---|---|---|---|---|---|---|---|
TER | $59.3B | 51.8x | 41.2x | 13.3x | 11.5x | 22.4x | 19.4x | 40.7x | 1.3% |
ANET | $256.4B | 63.4x | 50.6x | 24.3x | 20.6x | 38.6x | 32.7x | 49.8x | 2.0% |
NTNX | $18.0B | 65.3x | 30.4x | 6.5x | 5.6x | 7.5x | 6.5x | 53.3x | 4.3% |
| Ticker | Mkt cap | P/E | P/E fwd | P/S | P/S fwd | P/GP | P/GP fwd | EV/EBITDA | FCF yld |
|---|---|---|---|---|---|---|---|---|---|
MSFT | $3.7T | 27.5x | 25.2x | 11.1x | 9.4x | 16.3x | 13.9x | 18.2x | 1.8% |
ORCL | $433.0B | 25.3x | 18.7x | 6.4x | 4.8x | 9.8x | 7.3x | 17.4x | -5.5% |
CLS | $38.5B | 34.5x | 29.5x | 2.5x | 1.9x | 21.3x | 16.2x | 25.7x | 1.3% |
| Ticker | Mkt cap | P/E | P/E fwd | P/S | P/S fwd | P/GP | P/GP fwd | EV/EBITDA | FCF yld |
|---|---|---|---|---|---|---|---|---|---|
WDC | $166.1B | 25.6x | 48.3x | 14.1x | 12.9x | 31.1x | 28.4x | 31.1x | 1.7% |
KLAC | $261.9B | 54.4x | 36.6x | 19.3x | 14.5x | 31.5x | 23.6x | 46.2x | 1.4% |
ADI | $185.7B | 56.4x | 30.7x | 14.6x | 12.6x | 22.6x | 19.5x | 30.8x | 2.5% |
Consensus projections
| Ticker | FY2026E | FY2027E | FY2028E | |
|---|---|---|---|---|
NTAP | Revenue | +4.3% | +9.2% | +5.5% |
| EPS | +10.4% | +11.6% | +10.5% | |
KEYS | Revenue | +29.2% | +11.4% | +9.1% |
| EPS | +43.7% | +16.6% | +12.7% | |
DOCN | Revenue | +31.2% | +53.5% | +43.7% |
| EPS | −29.0% | +23.2% | +60.4% | |
DELL | Revenue | +16.2% | +53.6% | +14.2% |
| EPS | +27.3% | +85.4% | +21.0% | |
HPE | Revenue | +30.3% | +11.2% | +5.7% |
| EPS | +80.1% | +17.6% | +9.6% | |
STX | Revenue | +32.7% | +35.9% | +24.9% |
| EPS | +86.9% | +77.9% | +48.0% | |
SMCI | Revenue | +77.7% | +34.0% | +19.7% |
| EPS | +33.5% | +15.5% | +13.7% | |
NBIS | Revenue | +512.2% | +244.5% | +86.2% |
| EPS | +126.3% | +35.2% | −23.8% | |
CRWV | Revenue | +147.1% | +98.0% | +60.2% |
| EPS | +194.1% | −65.7% | −325.8% | |
TER | Revenue | +67.0% | +21.3% | +24.5% |
| EPS | +158.9% | +27.6% | +31.5% | |
ANET | Revenue | +40.0% | +27.7% | +21.9% |
| EPS | +39.6% | +25.5% | +23.9% | |
NTNX | Revenue | +12.1% | +12.8% | +12.5% |
| EPS | +10.9% | +13.6% | +16.3% | |
MSFT | Revenue | +18.0% | +18.2% | +19.6% |
| EPS | +26.7% | +15.4% | +18.5% | |
ORCL | Revenue | +17.8% | +33.2% | +45.5% |
| EPS | +25.3% | +7.6% | +35.6% | |
CLS | Revenue | +67.0% | +69.3% | +32.3% |
| EPS | +90.2% | +74.7% | +34.3% | |
WDC | Revenue | +36.9% | +37.2% | +26.5% |
| EPS | +106.2% | +72.8% | +48.0% | |
KLAC | Revenue | +12.2% | +33.9% | +19.0% |
| EPS | +14.5% | +47.8% | +21.0% | |
ADI | Revenue | +34.6% | +16.0% | +9.7% |
| EPS | +59.8% | +21.6% | +15.0% |
Forward fiscal years only. Blank means no analyst coverage for that year.
Three businesses that sell into the same artificial-intelligence build-out have been lumped together as one advancing group, and the arithmetic doesn't hold. NetApp, which sells all-flash storage arrays and the ONTAP software that runs them, plus first-party cloud storage services resold through Microsoft Azure and Amazon Web Services, rose 27.7% in the month to 14 August. Keysight Technologies, which makes the oscilloscopes, signal analysers and bit-error-rate testers engineers use to validate 800-gigabit and 1.6-terabit networking hardware, rose 10.9%. DigitalOcean, a developer-first cloud renting virtual machines and graphics-processing-unit (GPU) hours to start-ups and small businesses, rose 8.6%.
NetApp alone accounts for roughly 59% of that average. And nothing happened at NetApp inside the window: the company guided fiscal 2027 revenue to $7.325bn–$7.575bn back in May and does not report the July quarter until 2 September.
What NetApp actually did
Fiscal 2026 revenue, for the year ended April, was $6.925bn — growth of 5.4%. The trajectory inside that year improved genuinely, from 1.2% year-on-year in the first quarter to 12.5% in the fourth, and fourth-quarter operating income rose 52.6%. The company reported record all-flash array revenue of $1.2bn, up 18%, and record public-cloud revenue of $182m. It bought DataPelago in July to speed data processing for AI workloads.
What moved was the multiple, not the business. In early May the shares traded at 18.2x trailing earnings and 4.55x gross profit. They now trade at 32.2x and 8.29x. Forward gross profit is 7.68x — almost nothing has been priced out, meaning the market is not expecting the growth rate to change much. Morgan Stanley upgraded the stock only to Equal-weight on 8 August and raised its target to $173, 16% below where the shares closed. A separate target lift to $210 on AI storage demand leaves the price essentially at the top of the range. Consensus has fiscal 2027 revenue up 9.2%.
Keysight: earnings grew into the price
Keysight's April quarter was its best ever. Revenue rose 31.5% to $1.717bn; gross profit rose 44.7%; operating income nearly doubled, and operating margin reached 23.7% against 15.8% a year earlier. Orders hit a record $2.05bn, up 56%, well above revenue, and first-half AI-related revenue already exceeded all of fiscal 2025.
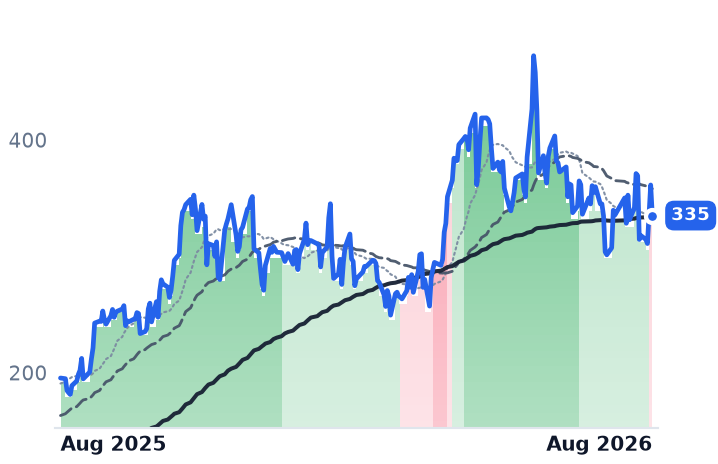
The striking part is the valuation. Trailing price-to-earnings is 58.9x against 59.2x in early May — unchanged, on a market capitalization 6% larger. Forward earnings are 35.2x, a 40% compression that assumes the roughly 44% earnings growth consensus already models for the year ending October. This is a recent inflection rather than a trend: fiscal 2024 revenue fell 8.9%. Keysight reports the July quarter after the close on 18 August.
DigitalOcean grew fastest and fell furthest
DigitalOcean's June-quarter revenue accelerated to 28.6%, the fastest in years, and AI customer annual recurring revenue reached $234m, up 212%. Remaining performance obligations jumped to $894m from $71m as the company signed its first nine-figure commitments.
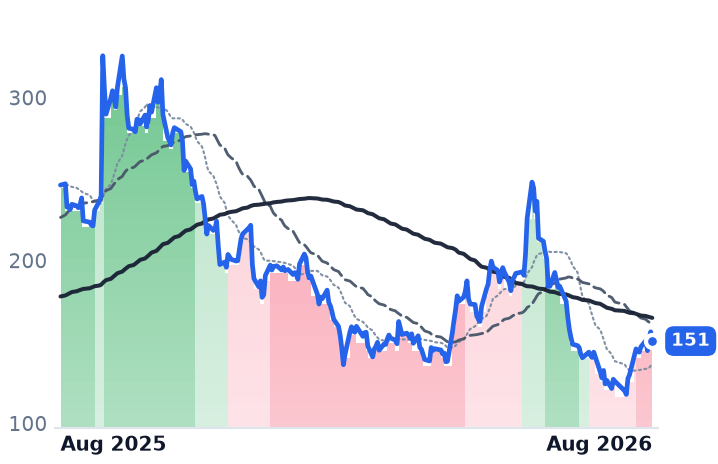
Gross profit grew only 18.1%. Gross margin fell to 55.0% from 59.9% as GPU and data-center depreciation scaled, and reported operating income fell 17.5%. The shares dropped almost 8% premarket on the beat and sit 28.3% below their six-month high, even as forward enterprise-value-to-revenue has fallen from about 15.5x in May to roughly 13x. Trailing earnings are 51.6x; forward earnings are 89.4x, because consensus expects reported earnings per share to fall 29% this year.
The month was borrowed
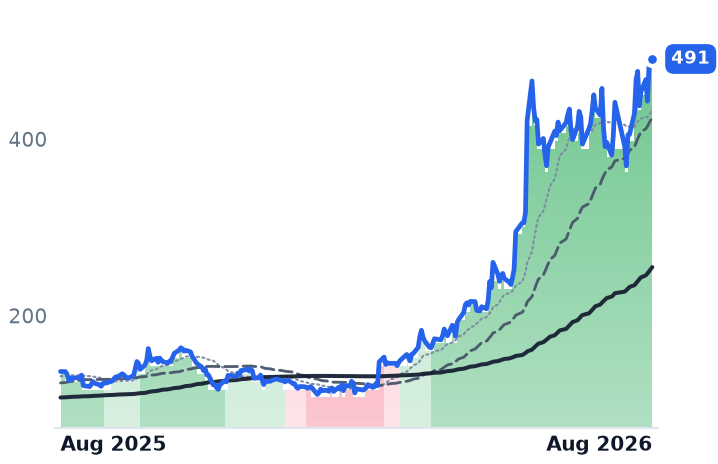
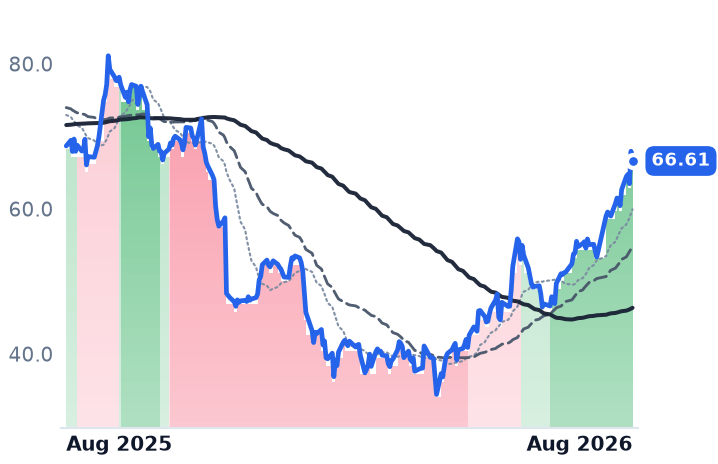
Shift the same 30-day window back two weeks, to July, and the three-name average flips to minus 3.2%, with DigitalOcean down 18.7%. The late-July selloff across data-center-linked names followed a shift in how AI capital spending is funded — incremental annual debt rose from 9% of hyperscaler capex in fiscal 2024 to 32% by mid-2026. August was the snap-back, and it was sector-wide: over the identical window Dell rose 18.9%, Hewlett Packard Enterprise 23.9% and Super Micro 48.2%. DigitalOcean and Keysight both lagged that group.
The setup
Where it stands — NetApp carries the month on a doubled multiple and 5% growth; Keysight carries the fundamentals on an unchanged one.
Would confirm — Keysight's 18 August print showing orders again above revenue and full-year revenue growth held near 29%.
Would invalidate — NetApp's 2 September quarter growing double digits with fiscal 2027 guidance raised above $7.575bn.
Watch next — Keysight fiscal third quarter, 18 August; NetApp first quarter, 2 September.
Valuation — NetApp 32.2x trailing, 23.2x forward, versus 18.2x in May; Keysight 58.9x trailing, 35.2x forward, versus 59.2x.