

Corning's Fiber Profit Rose 77%. Phone Glass, Not Fiber, Set the Guidance That Sank It
Hypothesis Opus 5 · Research Opus 5 · Writing Opus 5 · Prompt v1.5
Corning's optical unit is capacity-constrained, and its shares have handed back an entire re-rating anyway. In the June quarter the business that sells fiber, cable and connectors into AI data centers grew sales 32% to $2.07bn and earned $438m, a record margin for the segment. Guidance for the September quarter then arrived at $4.9–5.0bn, at or below the $5.0bn consensus, and the stock fell 19.3% in a session — its worst day since March 2020.
What management blamed was not fiber. Memory-chip inflation is raising the bill of materials inside smartphones, and Corning expects handset units to fall by a mid-teens percentage this year, which lands on Gorilla Glass. On price-to-gross-profit the shares now sit at 19.7x forward, against roughly 35.7x at the late-June peak — below Lumentum and Applied Optoelectronics, above Coherent — while consensus 2027 earnings of $4.30 a share have not been cut.
| Ticker | Company | Segment | Trend · 13mo | 30D | 1Y |
|---|---|---|---|---|---|
| The subject · what this brief is about | |||||
GLW | Corning | Display & Optical Materials | 🟢 Cont. Bull | +4.4% | +150.2% |
| Compared against · context, not the story | |||||
COHR | Coherent | Instrumentation & Test Equipment | 🟢 Cont. Bull | +7.4% | +249.2% |
LITE | Lumentum | Optical Transport & Switching | 🟢 Cont. Bull | +14.1% | +640.3% |
AAOI | Applied Optoelectronics | RF & Wireless | 🟢 Cont. Bull | +27.6% | +477.1% |
CRDO | Credo Technology | Optical Transport & Switching | 🟢 Cont. Bull | +16.0% | +131.4% |
ALAB | Astera Labs | Specialty Semiconductors | 🟢 Cont. Bull | −1.8% | +77.4% |
FN | Fabrinet | Specialty Manufacturing & Components | ⚠️ Emerging Bear | −2.4% | +69.2% |
CIEN | Ciena | Optical Transport & Switching | 🟢 Cont. Bull | +7.1% | +356.8% |
APH | Amphenol | Connectors & Interconnect Systems | 🟢 Cont. Bull | +6.0% | +45.9% |
NVDA | NVIDIA | AI & Data Center GPUs | 🟢 Cont. Bull | +8.1% | +25.1% |
MU | Micron Technology | Memory (DRAM/NAND) | 🟢 Cont. Bull | +8.7% | +671.9% |
VRT | Vertiv | Data Center Power & Thermal | 🟢 Cont. Bull | −6.6% | +111.4% |
ANET | Arista Networks | Cloud Networking | 🟢 Cont. Bull | +14.1% | +45.5% |
AVGO | Broadcom | Semiconductor Subsystems | 🟢 Cont. Bull | +0.5% | +29.6% |
TSM | Taiwan Semiconductor Manufacturing | Logic Foundries | 🟢 Cont. Bull | +2.8% | +79.2% |
AMAT | Applied Materials | Semiconduct Equipment | 🟢 Cont. Bull | −2.2% | +219.0% |
SPY | State Street SPDR S&P 500 ETF Trust | Asset Management | 🟢 Cont. Bull | +3.4% | +21.0% |
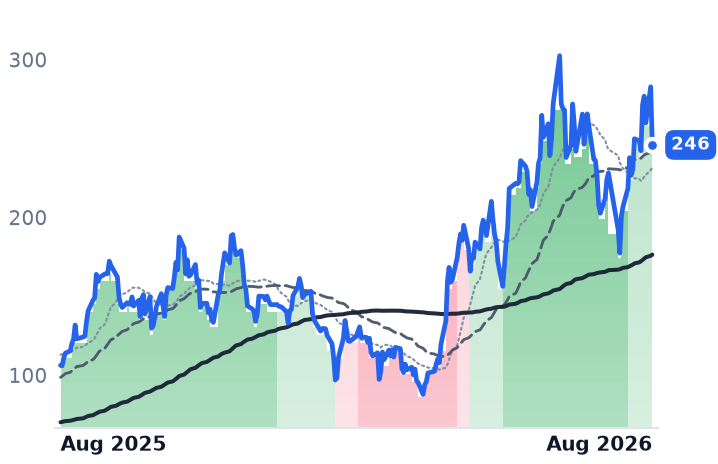
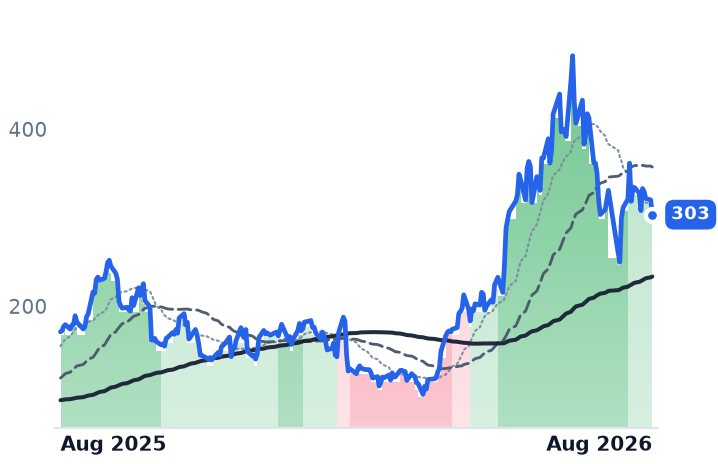
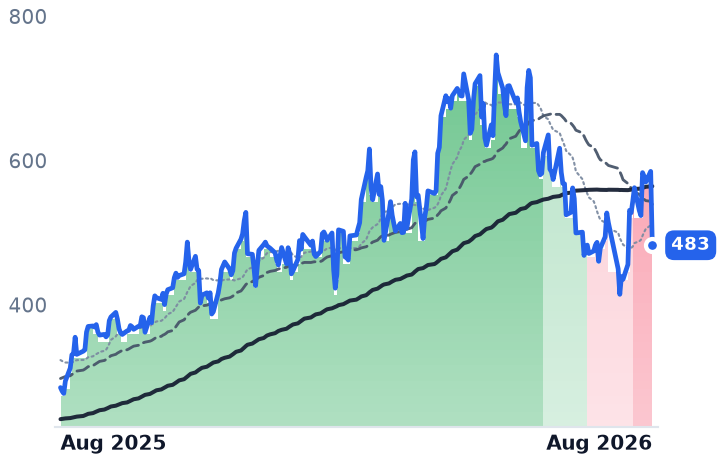
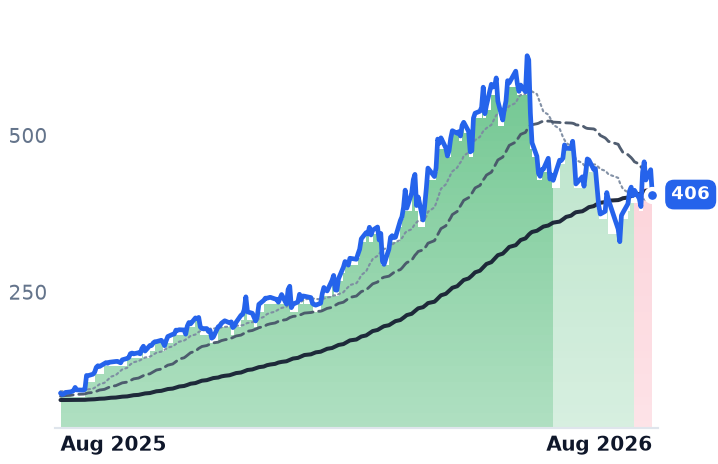
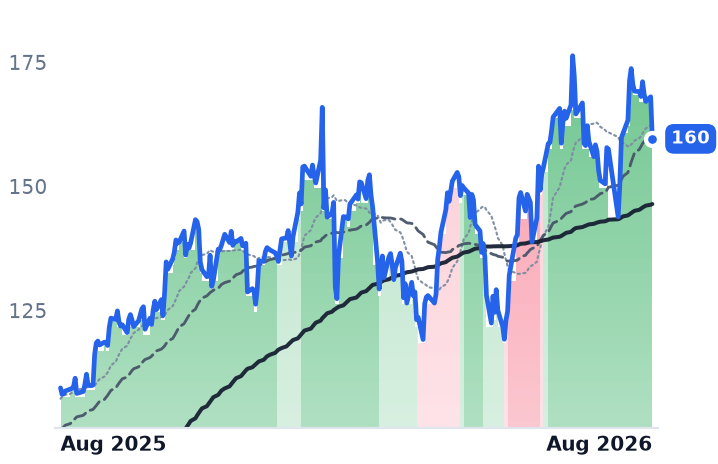
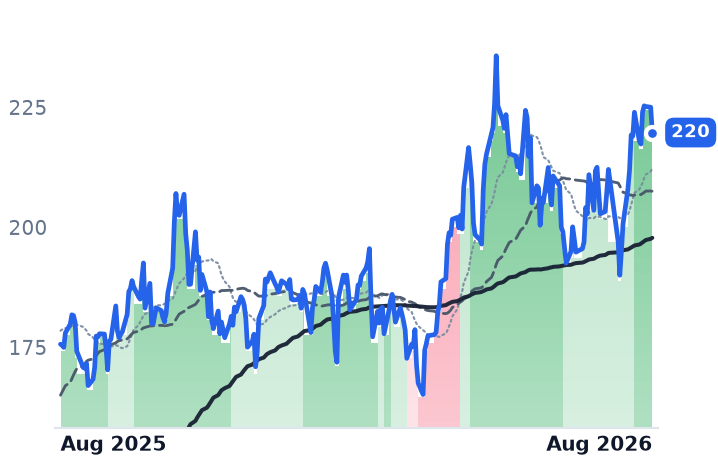
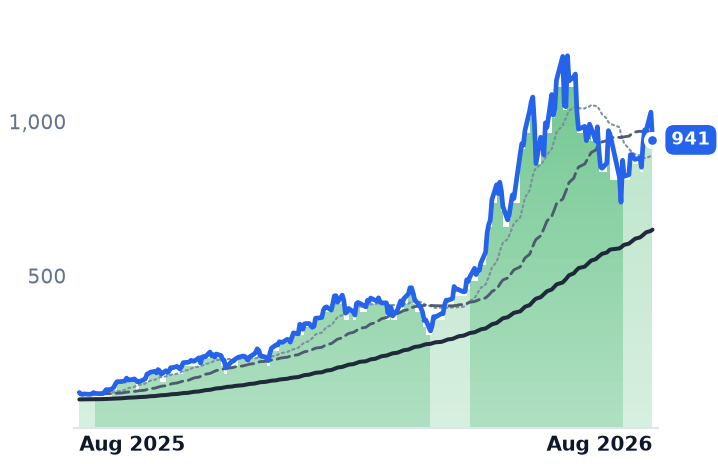
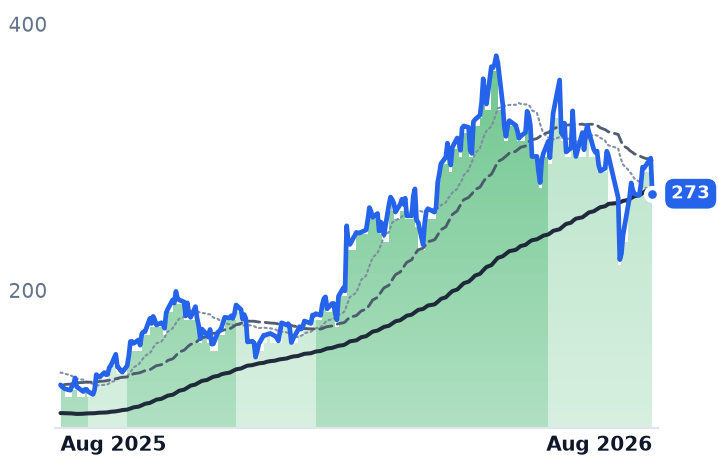
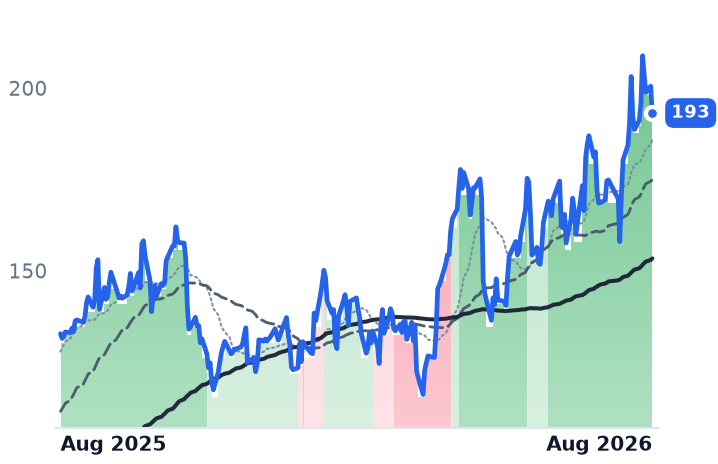
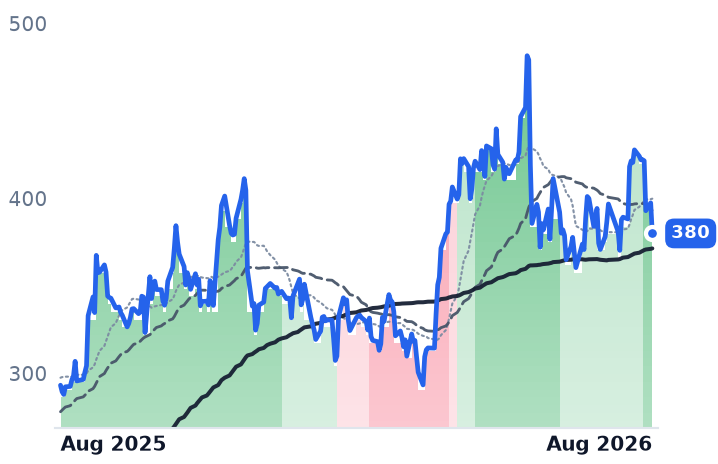
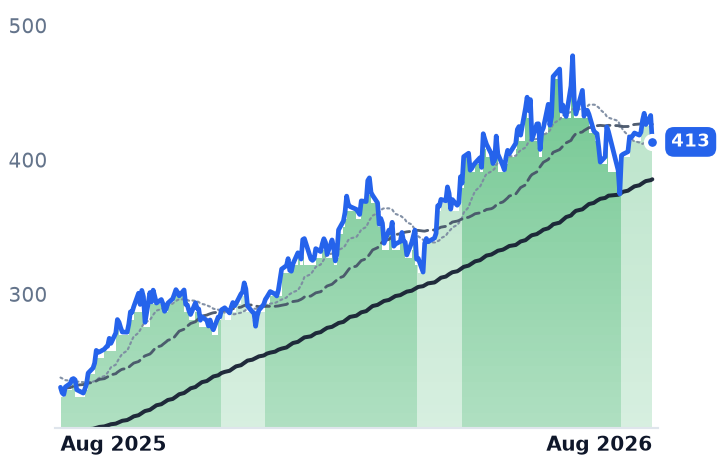
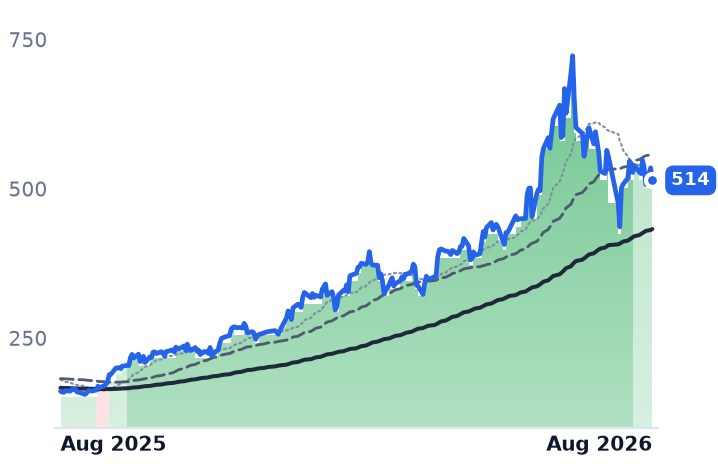
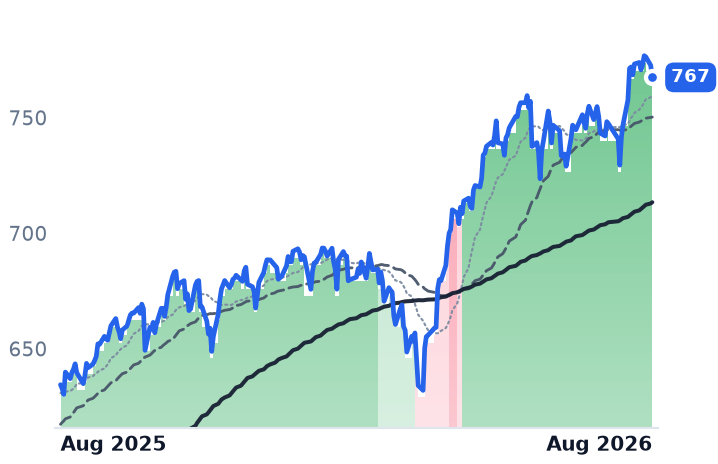
12-month price & trend
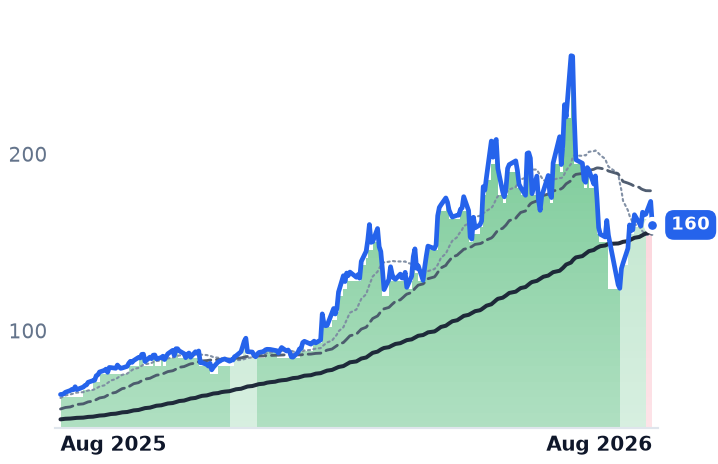
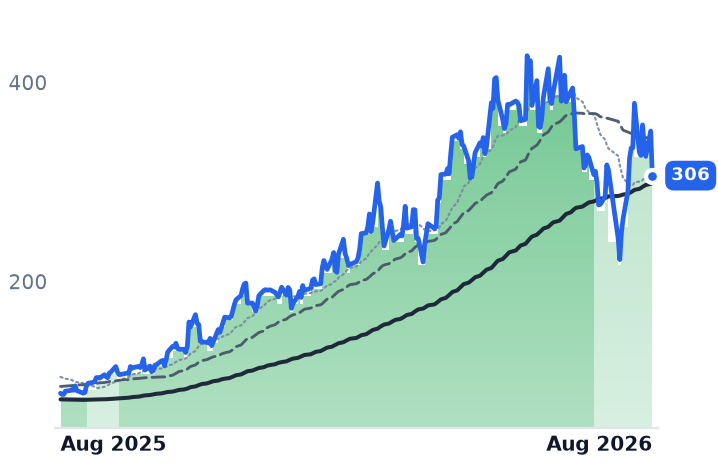
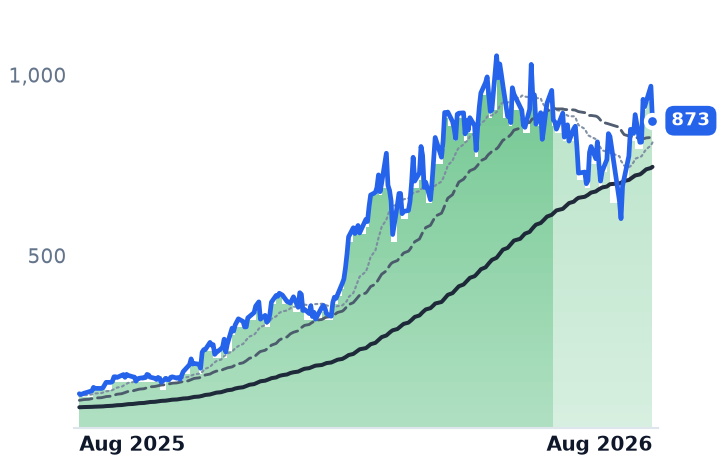
| Ticker | Mkt cap | P/E | P/E fwd | P/S | P/S fwd | P/GP | P/GP fwd | EV/EBITDA | FCF yld |
|---|---|---|---|---|---|---|---|---|---|
GLW | $137.7B | 72.4x | 48.9x | 8.1x | 7.2x | 22.4x | 19.7x | 37.1x | 1.7% |
COHR | $68.7B | 80.7x | 42.0x | 9.7x | 7.1x | 25.7x | 18.9x | 53.7x | -85.8% |
LITE | $75.4B | n/m | 52.1x | 25.0x | 13.3x | 60.0x | 31.9x | n/m | 0.7% |
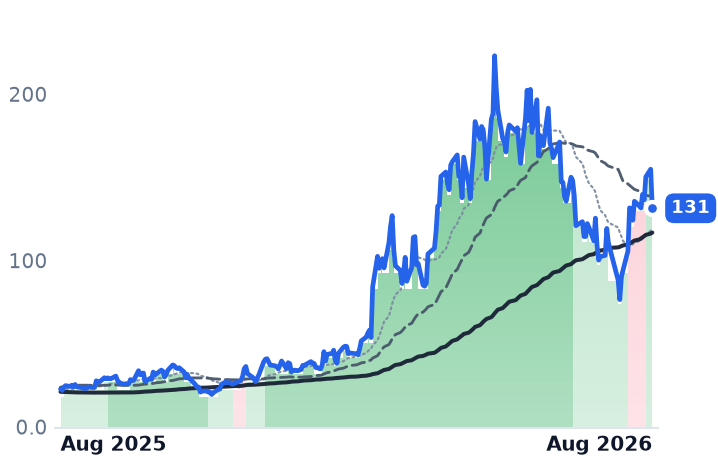
| Ticker | Mkt cap | P/E | P/E fwd | P/S | P/S fwd | P/GP | P/GP fwd | EV/EBITDA | FCF yld |
|---|---|---|---|---|---|---|---|---|---|
AAOI | $12.4B | n/m | 149.9x | 20.9x | 11.9x | 72.1x | 41.3x | n/m | -3.3% |
CRDO | $52.7B | 107.9x | 46.2x | 39.5x | 21.6x | 58.1x | 31.8x | 101.1x | 0.8% |
ALAB | $54.9B | 147.5x | 81.4x | 45.7x | 29.5x | 60.8x | 39.3x | 164.0x | 0.5% |
| Ticker | Mkt cap | P/E | P/E fwd | P/S | P/S fwd | P/GP | P/GP fwd | EV/EBITDA | FCF yld |
|---|---|---|---|---|---|---|---|---|---|
FN | $20.4B | 48.5x | 33.1x | 4.8x | 3.6x | 40.3x | 30.0x | 39.3x | 0.2% |
CIEN | $60.7B | 138.8x | 65.6x | 10.9x | 9.6x | 25.3x | 22.3x | 83.8x | 1.4% |
APH | $206.0B | 39.8x | 31.7x | 7.1x | 5.8x | 18.4x | 15.2x | 23.5x | 2.3% |
| Ticker | Mkt cap | P/E | P/E fwd | P/S | P/S fwd | P/GP | P/GP fwd | EV/EBITDA | FCF yld |
|---|---|---|---|---|---|---|---|---|---|
NVDA | $5.5T | 34.3x | 25.0x | 21.5x | 13.9x | 29.0x | 18.7x | 28.3x | 2.2% |
MU | $1.0T | 19.9x | 12.2x | 11.2x | 7.8x | 15.4x | 10.7x | 14.5x | 2.6% |
VRT | $142.5B | 91.1x | 57.7x | 13.1x | 10.3x | 36.3x | 28.5x | 61.1x | 1.6% |
| Ticker | Mkt cap | P/E | P/E fwd | P/S | P/S fwd | P/GP | P/GP fwd | EV/EBITDA | FCF yld |
|---|---|---|---|---|---|---|---|---|---|
ANET | $256.4B | 63.4x | 50.6x | 24.3x | 20.6x | 38.6x | 32.7x | 49.8x | 2.0% |
AVGO | $1.8T | 61.4x | 32.8x | 24.0x | 17.1x | 35.8x | 25.6x | 44.1x | 1.8% |
TSM | $2.1T | 30.5x | — | 14.3x | — | 23.1x | — | 19.4x | 1.7% |
| Ticker | Mkt cap | P/E | P/E fwd | P/S | P/S fwd | P/GP | P/GP fwd | EV/EBITDA | FCF yld |
|---|---|---|---|---|---|---|---|---|---|
AMAT | $425.0B | 45.9x | 43.6x | 13.8x | 12.7x | 27.9x | 25.7x | 37.3x | 1.5% |
SPY | $773.0B | — | — | — | — | — | — | — | — |
Consensus projections
| Ticker | FY2026E | FY2027E | FY2028E | |
|---|---|---|---|---|
GLW | Revenue | +17.5% | +18.7% | +21.0% |
| EPS | +29.6% | +31.7% | +36.5% | |
COHR | Revenue | +21.9% | +37.7% | +38.2% |
| EPS | +55.9% | +53.4% | +58.4% | |
LITE | Revenue | +83.9% | +89.0% | +54.6% |
| EPS | +314.0% | +125.9% | +58.9% | |
AAOI | Revenue | +129.8% | +169.3% | +48.7% |
| EPS | −417.3% | +454.2% | +102.6% | |
CRDO | Revenue | +211.9% | +83.3% | +49.4% |
| EPS | +423.2% | +85.0% | +47.8% | |
ALAB | Revenue | +123.4% | +59.4% | +26.8% |
| EPS | +121.0% | +61.4% | +25.0% | |
FN | Revenue | +35.6% | +23.6% | +21.3% |
| EPS | +36.0% | +24.7% | +24.0% | |
CIEN | Revenue | +34.5% | +27.0% | +27.2% |
| EPS | +160.2% | +47.6% | +48.1% | |
APH | Revenue | +54.2% | +17.7% | +12.2% |
| EPS | +59.4% | +22.0% | +13.0% | |
NVDA | Revenue | +65.1% | +84.2% | +43.2% |
| EPS | +59.0% | +91.7% | +42.0% | |
MU | Revenue | +248.0% | +92.8% | +11.4% |
| EPS | +804.9% | +111.2% | +7.9% | |
VRT | Revenue | +35.2% | +25.8% | +19.4% |
| EPS | +55.6% | +33.8% | +25.8% | |
ANET | Revenue | +40.0% | +27.7% | +21.9% |
| EPS | +39.6% | +25.5% | +23.9% | |
AVGO | Revenue | +66.6% | +65.5% | +33.9% |
| EPS | +71.7% | +68.7% | +33.7% | |
TSM | Revenue | +38.0% | +27.0% | +22.6% |
| EPS | +54.5% | +25.3% | +21.6% | |
AMAT | Revenue | +18.3% | +28.9% | +20.8% |
| EPS | +31.2% | +38.7% | +28.8% |
Forward fiscal years only. Blank means no analyst coverage for that year.
Corning beat on both sales and earnings for its June quarter. Then it told investors to expect $4.9bn to $5.0bn of core sales in the September quarter. Wall Street had been modeling the top of that range. The shares fell 19.3% the next session, leading a rout across optical stocks and marking the company's worst day since March 2020.
Corning is a 175-year-old glass and materials maker that now sells four largely unrelated things: optical fiber, cable and connectors to telecom carriers and data-center operators; glass substrates for televisions and phone screens; ceramic emissions parts for vehicles; and polysilicon for solar. Only the first has anything to do with artificial intelligence, and the market spent the first half of 2026 pricing the whole company as though it were the only one.
The engine is accelerating
Optical Communications grew sales 32% year on year to $2.07bn in the June quarter, with the enterprise networks line — the part that sells into hyperscaler campuses — up 65% and generative-AI product sales close to double. Segment net income rose 77% to $438m, a record 21% margin, and management's description of the constraint was blunt: if it could make more, it could sell more.
The mechanism is content per graphics processing unit (GPU), and it is unusually concrete. Clusters above roughly 130,000 GPUs require a third optical layer, which adds about 50% more content. Each bandwidth step doubles fiber counts; the move from NVIDIA's Hopper generation to Blackwell took fiber per GPU from eight to sixteen. Should scale-up interconnect inside the rack shift from copper to optical, that figure could reach 160. Management expects 1.3x to 1.5x optical content per GPU by 2028 on the conservative path alone.
That is why three of the largest technology spenders have tied up capacity in advance. Meta committed up to $6bn in January, NVIDIA followed in May with capital attached — pre-funded warrants and a commitment to expand US optical connectivity capacity tenfold, including new plants in North Carolina and Texas — and Amazon signed a multiyear fiber agreement in June. Corning's internal Springboard plan was upgraded in May, not trimmed: a $20bn sales run-rate by end-2026, $30bn by 2028, $40bn by 2030.
The drag is the other half
The guidance that cost the stock a fifth of its value came from the consumer side. DRAM and NAND memory prices are inflating the bill of materials in a smartphone, and Corning now expects handset units to fall by a mid-teens percentage in 2026 — a demand problem it did not create and cannot fix. In the same quarter it folded Display and Specialty Materials into a single Glass Innovations segment and carved out a new Solar segment. Solar sales grew 90% but the segment lost $7m at the margin line on a $30m extended maintenance shutdown at its wafer plant. Automotive grew 2% into a market down 2%.
The honest caveat is that consolidated growth has slowed for four consecutive quarters, from 20.9% to 16.6%. But the mix improved: operating income grew 21.8% on that 16.6%, gross margin held at 36.1% against 36.0% a year earlier, and free cash flow was $1.42bn.
What the price now assumes
Because Lumentum and Applied Optoelectronics both carry losses that make price-to-earnings meaningless, the comparable lens across this group is price-to-gross-profit. Corning trades at 22.4x trailing and 19.7x forward, back below the 23.2x it commanded on 3 May and far under the roughly 35.7x implied at its 29 June closing peak of $255.69. Coherent, a $69bn maker of lasers and datacom optics whose June quarter grew 33.7% to $2.05bn, is cheaper at 18.9x forward. Lumentum, whose quarterly revenue doubled to $1.01bn before a $7.16bn charge, sits at 31.9x. Applied Optoelectronics, a $12bn transceiver supplier growing 86% but loss-making at a 27.7% gross margin, is at 41.3x.
On earnings, 48.9x forward is not cheap in absolute terms — though it is marginally below the roughly 52x premium that looked like the central risk in this name back in May. Consensus has not moved against it: 2027 revenue of $22.8bn and earnings of $4.30 a share imply 31.7% profit growth.
The trend signal only turned negative on 14 August, when the 50-day average crossed below the 200-day — six weeks after the fall that caused it. On 18 August the whole complex reset again after Fabrinet dropped sharply on a beat; Corning fell 7.7% while the broad market gave up 0.7%. It remains up roughly 148% over twelve months, and down only over the three-month window.
The setup
Where it stands — Corning's fiber segment is sold out and growing 32%, while its consumer-glass and solar halves are absorbing a memory-driven handset downturn. Would confirm — September-quarter core sales landing at or above the $5.0bn top of guidance, with optical margin holding near 21%. Would invalidate — Optical Communications growth falling below 20% year on year, or 2027 consensus earnings dropping from $4.30. Watch next — Third-quarter results in late October, plus any restatement of the $20bn end-2026 Springboard run-rate. Valuation — 19.7x forward price-to-gross-profit versus roughly 35.7x at the June peak; 48.9x forward earnings against Coherent's 42.0x.