

NetApp Says Flash-Memory Costs Will Cut Its Gross Margin. The Shares Nearly Doubled.
Hypothesis Opus 5 · Research Opus 5 · Writing Opus 5 · Prompt v1.5
Three companies that sell the finished box — servers and storage arrays — to corporate buyers rather than to hyperscalers have re-rated violently this year, and almost none of it came from earning more gross profit.
NetApp guided fiscal 2027 gross margin down to 68.5–69.5% from 71.3%, naming memory and flash costs, and its shares gained 22% the next session anyway. Dell's revenue nearly doubled last quarter to $43.8bn while gross margin fell 337 basis points; operating leverage, not price pass-through, rescued the profit line. Hewlett Packard Enterprise is the exception and the odd one out — its margin expansion is Juniper networking mix and debt paydown, not a server cycle.
Measured against trailing gross profit, Dell has moved from 3.69x in February to 11.37x while those gross-profit dollars grew 19%. All three report within two weeks.
| Ticker | Company | Segment | Trend · 13mo | 30D | 1Y |
|---|---|---|---|---|---|
| The subject · what this brief is about | |||||
DELL | Dell Technologies | Enterprise Storage & Software | 🟢 Cont. Bull | +8.3% | +244.3% |
HPE | Hewlett Packard Enterprise | Enterprise Storage & Software | 🟢 Cont. Bull | +13.7% | +157.0% |
NTAP | NetApp | Enterprise Storage & Software | 🟢 Cont. Bull | +17.3% | +82.0% |
| Compared against · context, not the story | |||||
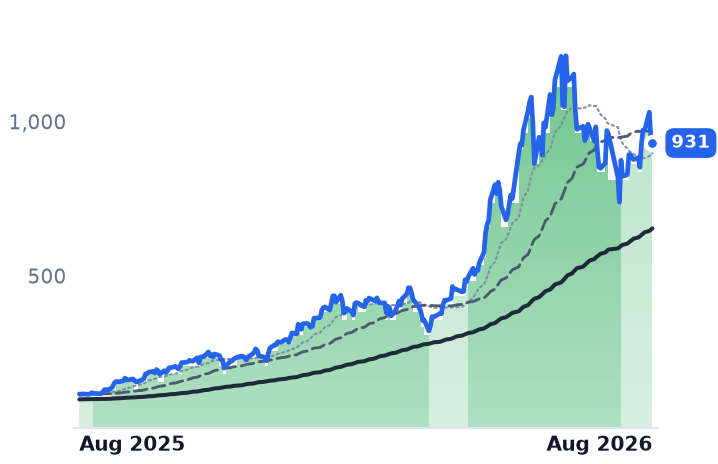
MU | Micron Technology | Memory (DRAM/NAND) | 🟢 Cont. Bull | −3.5% | +700.7% |
SMCI | Super Micro Computer | Server & Infrastructure Systems | 🌱 Emerging Bull | +43.5% | −14.2% |
CLS | Celestica | Electronic Manufacturing Services | 🟢 Cont. Bull | −11.3% | +64.8% |
FLEX | Flex | Electronic Manufacturing Services | 🟢 Cont. Bull | −11.3% | +130.2% |
WDC | Western Digital | Data Storage Devices | 🟢 Cont. Bull | −15.7% | +512.4% |
SNDK | Sandisk | Specialty Manufacturing & Components | 🟢 Cont. Bull | −1.3% | +3433.5% |
HPQ | HP | Consumer & Commercial PCs | 🌱 Emerging Bull | +20.7% | +17.5% |
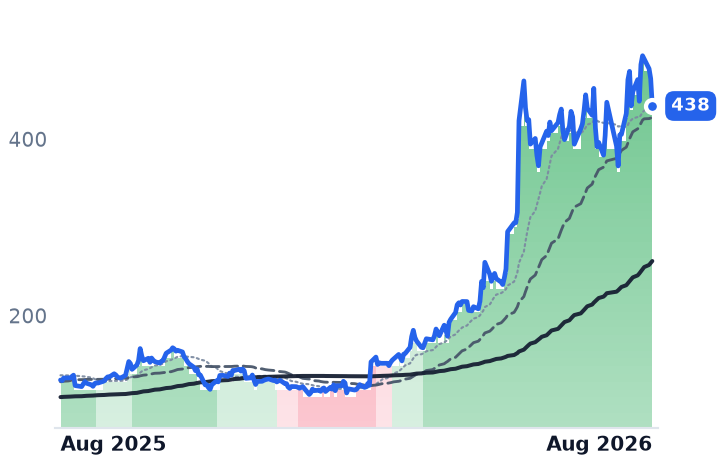
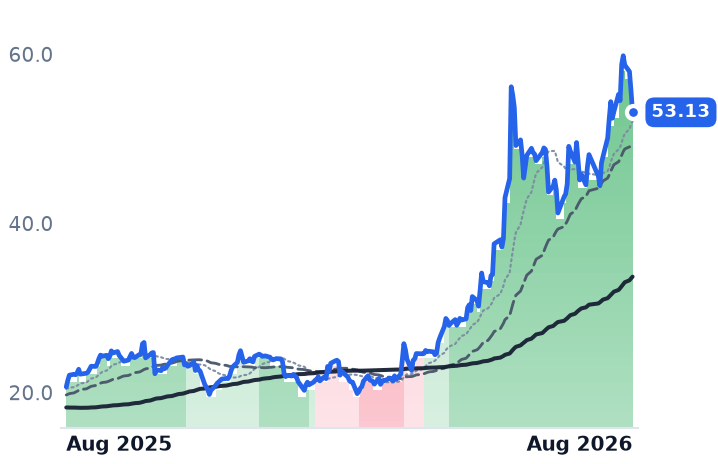
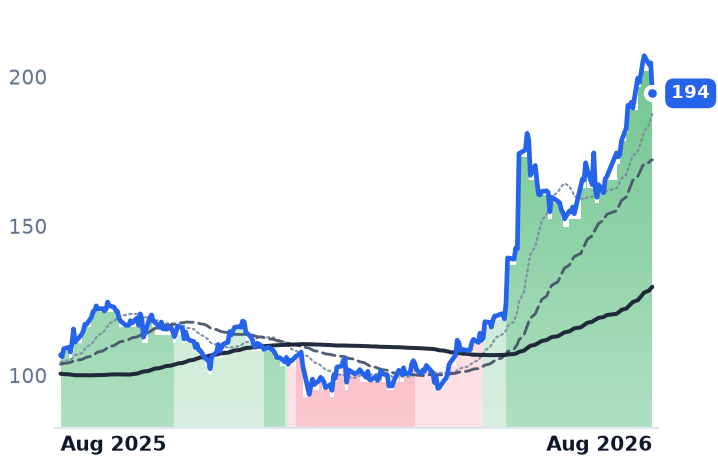
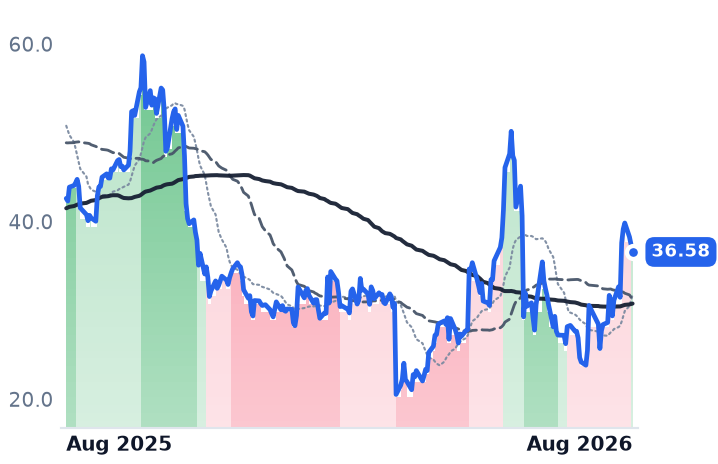
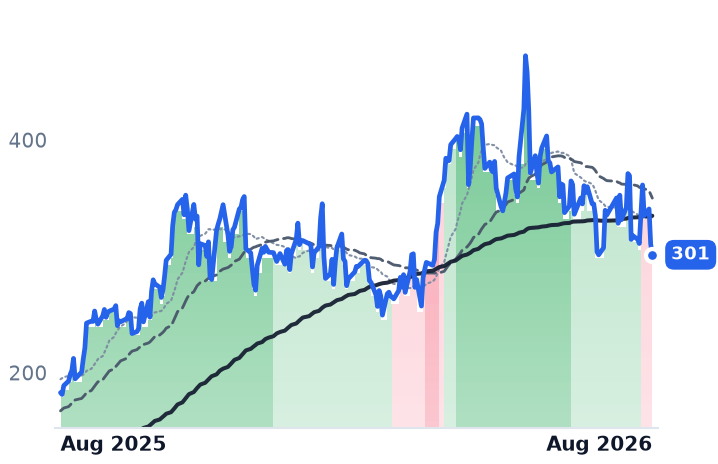
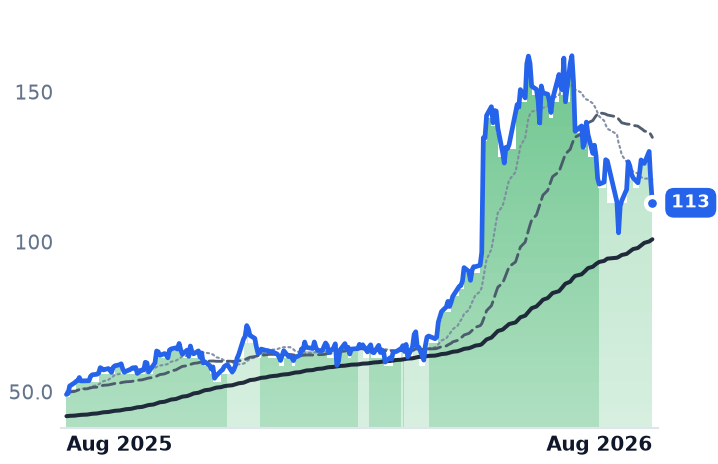
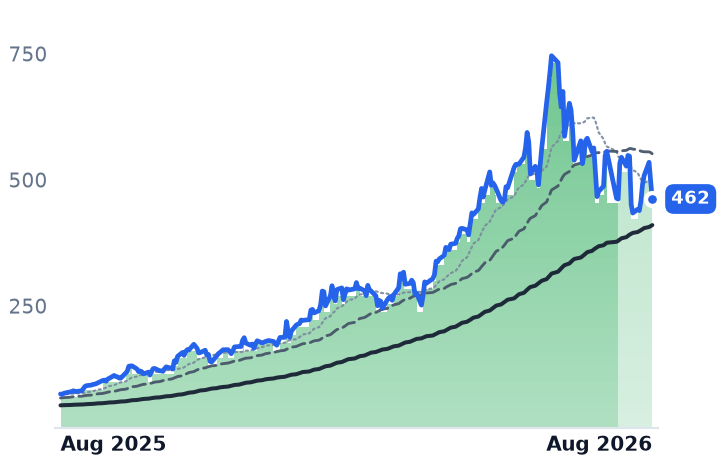
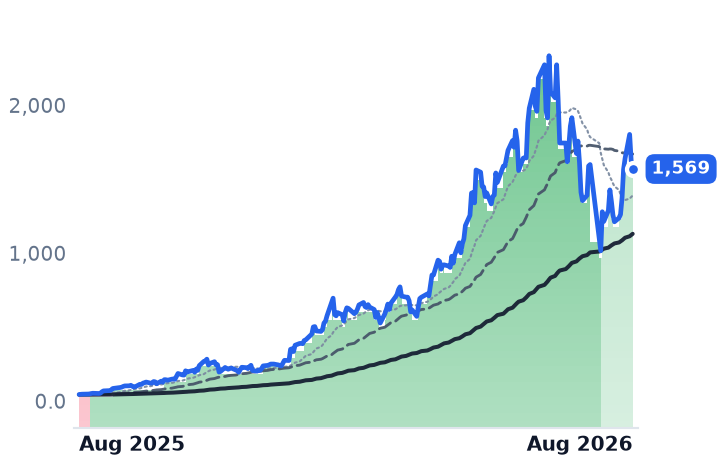
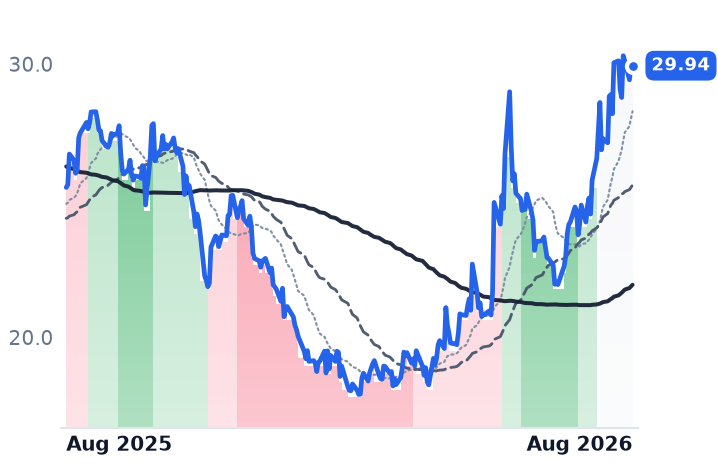
12-month price & trend
| Ticker | Mkt cap | P/E | P/E fwd | P/S | P/S fwd | P/GP | P/GP fwd | EV/EBITDA | FCF yld |
|---|---|---|---|---|---|---|---|---|---|
DELL | $290.6B | 34.2x | 23.3x | 2.2x | 1.7x | 11.4x | 8.8x | 21.0x | 3.2% |
HPE | $70.3B | 48.7x | 15.5x | 1.8x | 1.6x | 5.5x | 4.7x | 21.5x | 5.7% |
NTAP | $38.2B | 30.2x | 21.6x | 5.5x | 5.1x | 7.8x | 7.2x | 19.8x | 4.9% |
| Ticker | Mkt cap | P/E | P/E fwd | P/S | P/S fwd | P/GP | P/GP fwd | EV/EBITDA | FCF yld |
|---|---|---|---|---|---|---|---|---|---|
MU | $1.0T | 19.9x | 12.2x | 11.2x | 7.8x | 15.4x | 10.7x | 14.5x | 2.6% |
SMCI | $25.8B | 10.9x | 12.3x | 0.7x | 0.5x | 6.1x | 4.5x | 8.2x | -27.1% |
CLS | $34.7B | 31.0x | 26.5x | 2.2x | 1.7x | 19.1x | 14.5x | 23.2x | 1.5% |
| Ticker | Mkt cap | P/E | P/E fwd | P/S | P/S fwd | P/GP | P/GP fwd | EV/EBITDA | FCF yld |
|---|---|---|---|---|---|---|---|---|---|
FLEX | $41.8B | 43.6x | 24.1x | 1.4x | 1.2x | 15.0x | 12.7x | 23.6x | 2.6% |
WDC | $166.1B | 25.6x | 48.3x | 14.1x | 12.9x | 31.1x | 28.4x | 31.1x | 1.7% |
SNDK | $208.5B | 46.2x | 21.8x | 15.8x | 10.6x | 28.2x | 19.0x | 37.1x | 2.1% |
| Ticker | Mkt cap | P/E | P/E fwd | P/S | P/S fwd | P/GP | P/GP fwd | EV/EBITDA | FCF yld |
|---|---|---|---|---|---|---|---|---|---|
HPQ | $26.9B | 10.7x | 9.7x | 0.5x | 0.5x | 2.3x | 2.3x | 8.4x | 14.0% |
Consensus projections
| Ticker | FY2026E | FY2027E | FY2028E | |
|---|---|---|---|---|
DELL | Revenue | +16.2% | +54.7% | +15.1% |
| EPS | +27.3% | +88.5% | +22.3% | |
HPE | Revenue | +30.3% | +11.5% | +5.6% |
| EPS | +80.5% | +18.1% | +9.6% | |
NTAP | Revenue | +4.3% | +9.9% | +5.7% |
| EPS | +10.4% | +12.8% | +11.1% | |
MU | Revenue | +248.0% | +92.8% | +11.4% |
| EPS | +804.9% | +111.2% | +7.9% | |
SMCI | Revenue | +77.7% | +34.0% | +19.7% |
| EPS | +33.5% | +15.5% | +13.7% | |
CLS | Revenue | +67.0% | +69.3% | +32.3% |
| EPS | +90.2% | +74.7% | +34.3% | |
FLEX | Revenue | +6.8% | +26.3% | +30.0% |
| EPS | +24.2% | +44.7% | +51.5% | |
WDC | Revenue | +36.9% | +37.2% | +26.5% |
| EPS | +106.2% | +72.8% | +48.0% | |
SNDK | Revenue | +169.2% | +113.5% | +7.0% |
| EPS | +2283.0% | +167.8% | +5.6% | |
HPQ | Revenue | +4.5% | +0.2% | +0.3% |
| EPS | −2.8% | +0.0% | +9.6% |
Forward fiscal years only. Blank means no analyst coverage for that year.
The largest single line item at the companies that assemble and brand enterprise servers and storage arrays is no longer the processor. It is memory. And on 28 May, NetApp — which sells all-flash storage arrays running its ONTAP data-management software, plus first-party storage services inside Azure, Amazon Web Services and Google Cloud — told investors that the cost of that memory would take roughly two points off its gross margin this fiscal year.
That is a guidance cut, delivered in the same breath as record results. NetApp's revenue rose 12.5% to $1.95bn in the January-to-April quarter, a fourth consecutive acceleration from just 1.2% three quarters earlier. All-flash array revenue hit a record $1.2bn, up 18%. Yet reported gross margin has now slipped two quarters running, from 71.96% to 70.58% to 70.07%, and the fiscal 2027 guide of 68.5–69.5% sits below all of them. Management says pricing actions are being taken to protect profitability. The guide says they are not yet enough.
Why the bill exploded
Memory makers have been shifting constrained wafer capacity toward high-bandwidth memory for artificial-intelligence accelerators, starving the conventional server DRAM that ordinary enterprise machines need. Contract prices for that conventional DRAM rose roughly 93–98% quarter on quarter in the first quarter of 2026, according to TrendForce, with NAND flash following. The cost of a memory-heavy 512-gigabyte, dual-socket server build has roughly doubled since January 2025. The rate is now decelerating — TrendForce expects 13–18% for server DRAM in the third quarter — but the level is set.
Dell absorbed it; opex saved the quarter
Dell, the largest of the three and the volume leader in AI servers with roughly a fifth of the market, is the clearest case. Revenue in the quarter to 1 May rose 87.5% to $43.8bn. Gross profit rose only 57.6%. Gross margin fell 337 basis points to 17.75%, meaning the incremental margin on $20.5bn of brand-new revenue was about 13.9 cents on the dollar. Operating margin still expanded, to 8.34% from 5.27% — but only because operating expense grew 11.4% against revenue growth of 87.5%. That is expense leverage, not pass-through.
Dell is trying. It raised PowerEdge server list prices in December and lifted commercial PC and monitor prices 10–30%. Chief operating officer Jeff Clarke told investors the company is "repricing, it feels like, every day", with quotes valid for the shortest period ever. Demand is not the issue: Dell entered the quarter with a $51.3bn AI-server backlog, booked $24.4bn of new orders and lifted full-year revenue guidance to $165–169bn.
HPE is a different story wearing the same clothes
Hewlett Packard Enterprise sells ProLiant servers and, since the Juniper deal, a large switching and routing business. Its gross margin expanded 894 basis points to 36.52% — the opposite of Dell. But that is acquisition mix, not pricing power: Networking revenue rose 148.2% to $2.7bn while the segment's own operating margin fell to 21.6% from 25.0%. Server revenue grew 32.7% to $5.5bn. The genuine progress is financial: net debt to adjusted EBITDA improved to 2.6x from a pro-forma 3.1x, with free-cash-flow guidance raised to at least $2.0bn, per its 10-Q. Barron's midyear panelists judged Dell's hyperscaler servers superior to HPE's on total cost of ownership — HPE is following, not leading, on hardware.
The multiple did the work
Because the three earn 18%, 37% and 70% gross margins, price against gross profit is the only lens that compares them. Dell has gone from 3.69x trailing gross profit in mid-February to 6.88x in May to 11.37x now; its trailing gross-profit dollars grew 19.1% over that span. HPE went 2.87x to 5.50x on 29.7% more gross profit. NetApp went 4.28x to 7.79x on 5.1%. The advance is overwhelmingly re-rating.
Nor was it a quiet grind. Dell has printed 27 sessions of 5% or more since 31 March, including a 32.8% gain the day after results and an 11.3% drop on 28 July. HPE jumped 24.0% on 2 June, NetApp 22.4% on 29 May. All three fell together on 19 August inside a broad selloff in AI hardware and memory names, and all three remain in uptrends, 50-day averages above 200-day.
The setup
Where it stands — Revenue and backlog are validated at all three; the memory cost is landing on gross margin and being offset below it. Would confirm — Dell reporting flat or higher gross margin on sequentially higher AI-server revenue. Would invalidate — NetApp narrowing its fiscal 2027 gross-margin guide back toward 71%, or Dell's incremental gross margin rising above 20%. Watch next — Dell reports 1 September; HPE and NetApp both report after the close on 2 September. Valuation — Dell 11.37x trailing gross profit against 8.81x forward, versus 3.69x in February; HPE 5.50x/4.75x; NetApp 7.79x/7.17x.