

SaaS De-Rating Deepens, But Bifurcation Emerges Beneath the Carnage
Prompt v1.0
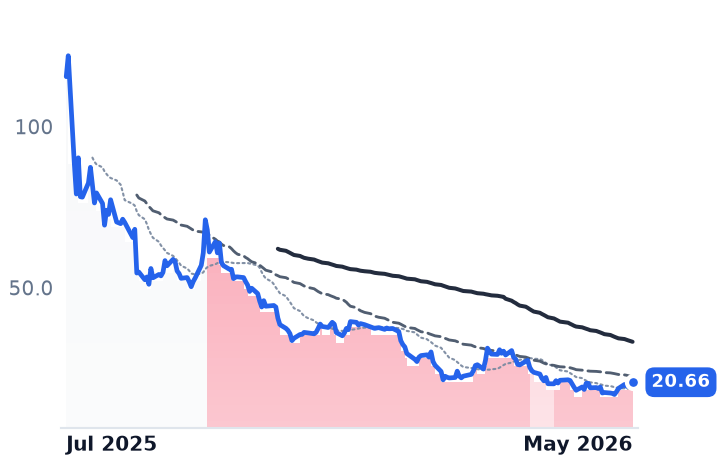
A broad, confirmed bear trend has erased 49–79% of market cap across 10 SaaS names over 6–12 months, with AI-disruption evidence now appearing explicitly in earnings commentary and competitive data. The secular de-rating is real — but the cohort is splitting: structurally impaired names (PD, SPT, DOMO) trade at distressed multiples with deteriorating fundamentals, while higher-quality platforms (ZS, HUBS, MNDY) have already compressed toward or below pre-2021 norms, raising questions about how much incremental downside remains.
| Ticker | Company | Segment | Trend · 13mo | 30D | 1Y |
|---|---|---|---|---|---|
HUBS | HubSpot | Customer Experience & CRM | 🔴 Cont. Bear | −3.8% | −67.3% |
MNDY | monday.com | Other | 🔴 Cont. Bear | +15.5% | −74.1% |
DUOL | Duolingo | Media & Content Platforms | 🔴 Cont. Bear | +19.3% | −78.9% |
ZS | Zscaler | AI & Data Intelligence | ⚠️ Emerging Bear | +24.5% | −34.7% |
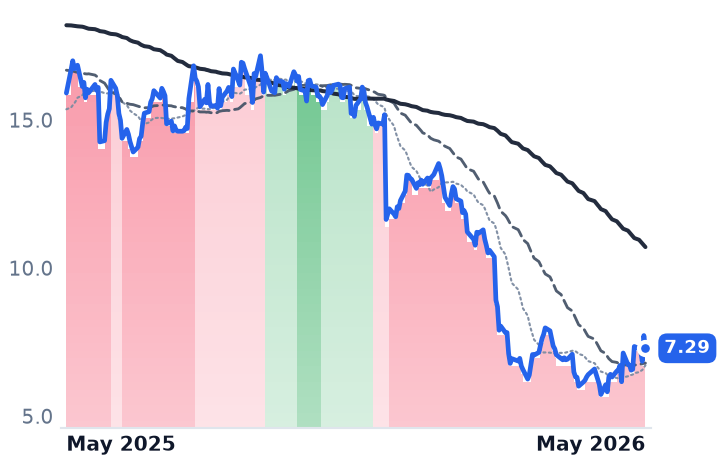
PD | PagerDuty | Developer Tools & DevOps | 🔴 Cont. Bear | +20.1% | −54.2% |
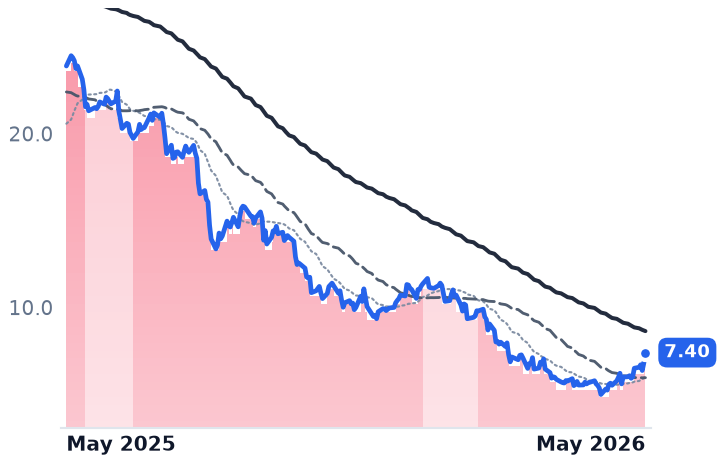
SPT | Sprout Social | Software - Application | 🔴 Cont. Bear | +38.1% | −69.0% |
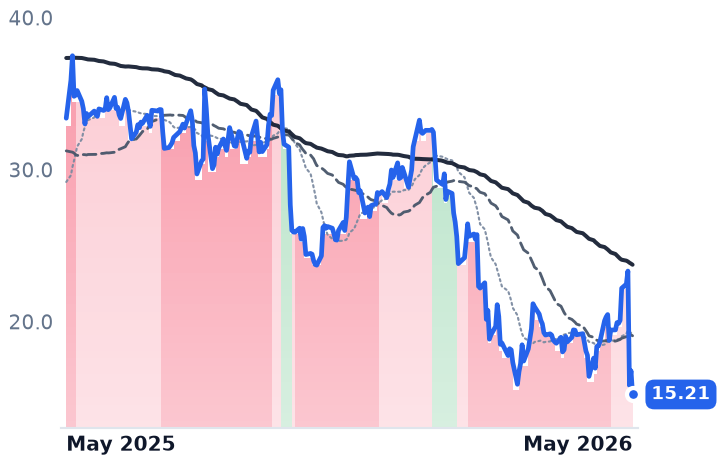
KVYO | Klaviyo | Marketing Automation | 🔴 Cont. Bear | −14.5% | −54.4% |
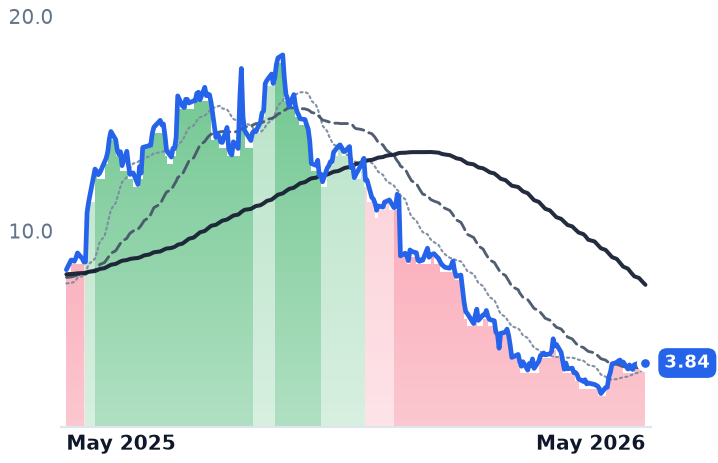
DOMO | Domo | Software - Application | ⚠️ Emerging Bear | +44.9% | −53.1% |
FIG | Figma | Design & Content Creation | 🔴 Cont. Bear | +8.3% | −82.1% |
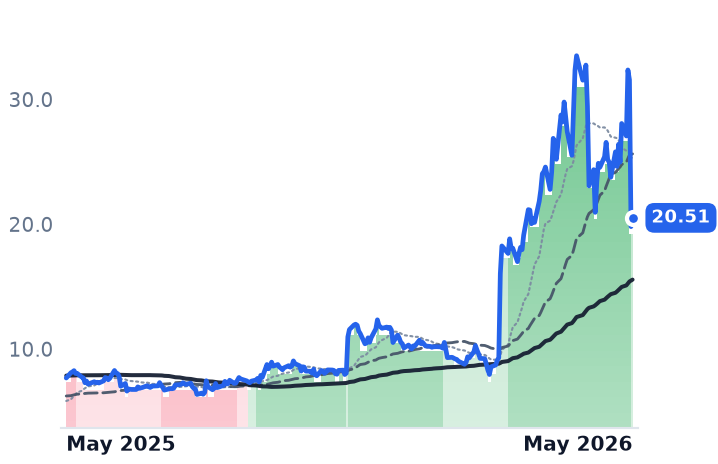
FSLY | Fastly | Cloud Infrastructure & Platform | 🟢 Cont. Bull | −30.4% | +167.1% |
12-month price & trend
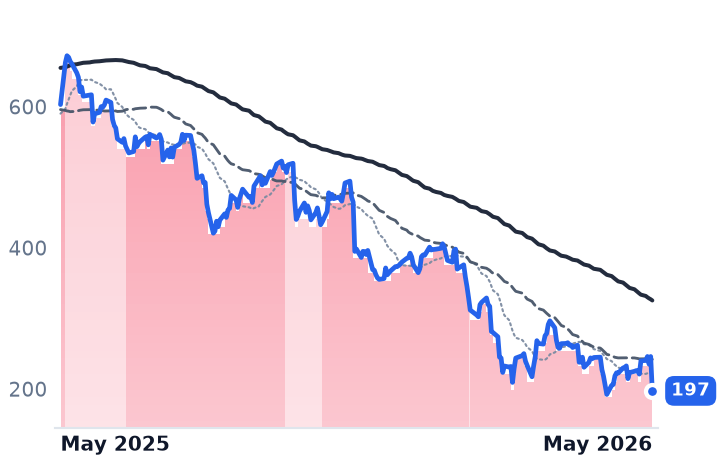
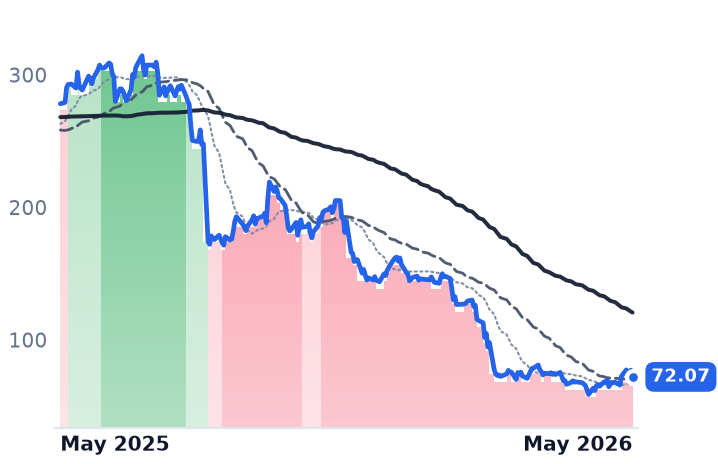
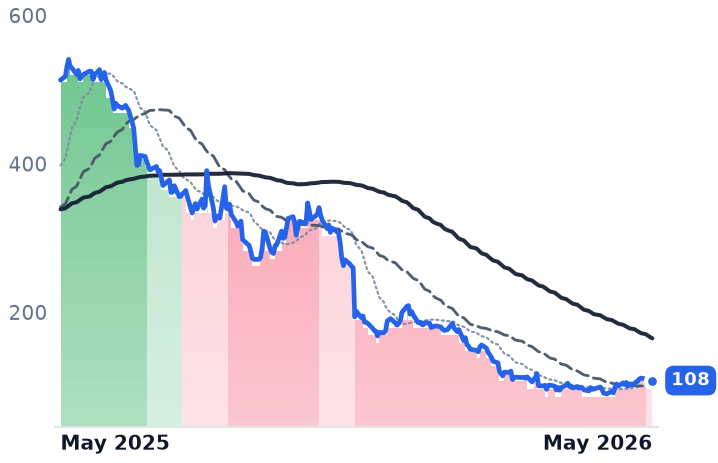
| Ticker | Mkt cap | P/E | P/E fwd | P/S | P/S fwd | P/GP | P/GP fwd | EV/EBITDA | FCF yld |
|---|---|---|---|---|---|---|---|---|---|
HUBS | $11.5B | 79.1x | 17.0x | 3.3x | 3.1x | 4.0x | 3.7x | 37.9x | 6.7% |
MNDY | $4.7B | 39.8x | 20.3x | 3.6x | 3.2x | 4.1x | 3.6x | 51.1x | 6.4% |
DUOL | $6.5B | 15.3x | 49.1x | 6.0x | 5.4x | 8.3x | 7.5x | 25.2x | 6.4% |
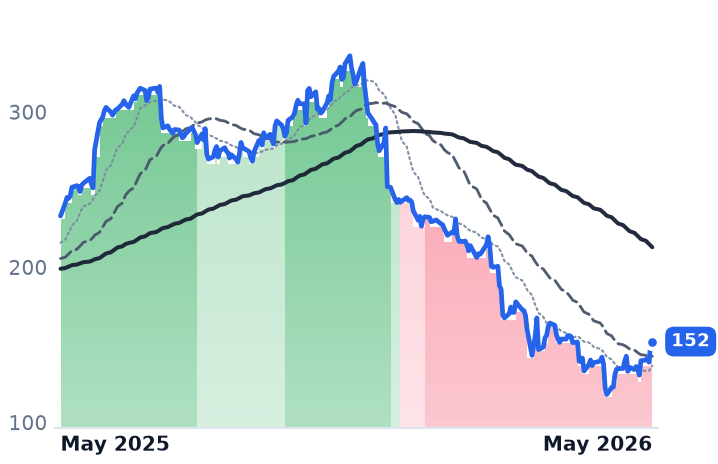
| Ticker | Mkt cap | P/E | P/E fwd | P/S | P/S fwd | P/GP | P/GP fwd | EV/EBITDA | FCF yld |
|---|---|---|---|---|---|---|---|---|---|
ZS | $29.7B | n/m | 40.1x | 9.4x | 7.6x | 12.2x | 9.9x | 251.1x | 3.2% |
PD | $1.1B | 5.7x | 9.0x | 2.2x | 2.2x | 2.6x | 2.6x | 23.0x | 11.5% |
SPT | $360.6M | n/m | 6.4x | 0.8x | 0.7x | 1.0x | 0.9x | n/m | 12.9% |
| Ticker | Mkt cap | P/E | P/E fwd | P/S | P/S fwd | P/GP | P/GP fwd | EV/EBITDA | FCF yld |
|---|---|---|---|---|---|---|---|---|---|
KVYO | $5.7B | n/m | 22.3x | 4.3x | 3.7x | 5.8x | 5.0x | 309.0x | 4.0% |
DOMO | $156.4M | n/m | 71.3x | 0.5x | 0.5x | 0.7x | 0.7x | n/m | 0.2% |
FIG | $12.7B | n/m | 90.8x | 9.9x | 8.6x | 12.5x | 10.9x | n/m | 1.8% |
| Ticker | Mkt cap | P/E | P/E fwd | P/S | P/S fwd | P/GP | P/GP fwd | EV/EBITDA | FCF yld |
|---|---|---|---|---|---|---|---|---|---|
FSLY | $4.7B | n/m | 58.7x | 6.8x | 6.3x | 11.1x | 10.3x | n/m | 0.9% |
Consensus projections
| Ticker | FY2026E | FY2027E | FY2028E | |
|---|---|---|---|---|
HUBS | Revenue | +18.5% | +14.9% | +14.0% |
| EPS | +37.2% | +22.5% | +18.5% | |
MNDY | Revenue | +19.8% | +16.1% | +16.1% |
| EPS | +7.0% | +21.4% | +10.9% | |
DUOL | Revenue | +17.1% | +13.9% | +12.4% |
| EPS | −66.2% | +21.3% | +20.2% | |
ZS | Revenue | +25.2% | +16.9% | +16.7% |
| EPS | +29.0% | +11.2% | +17.6% | |
PD | Revenue | +5.4% | +0.7% | +2.8% |
| EPS | +42.1% | +16.9% | +7.1% | |
SPT | Revenue | +8.5% | +7.3% | +9.8% |
| EPS | +18.7% | +28.8% | +24.7% | |
KVYO | Revenue | +24.8% | +19.5% | +18.4% |
| EPS | +31.2% | +22.3% | +23.0% | |
DOMO | Revenue | +0.5% | −1.2% | +0.8% |
| EPS | −86.9% | −161.9% | +81.1% | |
FIG | Revenue | +40.5% | +23.8% | +24.2% |
| EPS | −24.5% | +26.7% | +34.4% | |
FSLY | Revenue | +20.6% | +11.9% | +10.6% |
| EPS | +870.1% | +11.5% | +13.1% |
Forward fiscal years only. Blank means no analyst coverage for that year.
TL;DR
A broad, confirmed bear trend has erased 49–79% of market cap across 10 SaaS names over 6–12 months, with AI-disruption evidence now appearing explicitly in earnings commentary and competitive data. The secular de-rating is real — but the cohort is splitting: structurally impaired names (PD, SPT, DOMO) trade at distressed multiples with deteriorating fundamentals, while higher-quality platforms (ZS, HUBS, MNDY) have already compressed toward or below pre-2021 norms, raising questions about how much incremental downside remains.
The Selloff Is Cohort-Wide and Confirmed
All 10 names in the tracked universe are in confirmed strongly bearish trend regimes. The price damage is not modest: HUBS −67% from peak (~$603 → ~$197), MNDY −74% (~$273 → ~$72), DUOL −79% (~$490 → ~$108), ZS −54% (~$233 → ~$152), PD −57% (~$15 → ~$7.30), SPT −69% (~$20 → ~$7.40), KVYO −52% (~$31 → ~$15), and DOMO −49% (~$7.50 → ~$3.80). This is not idiosyncratic single-name noise — the breadth alone signals a cohort-level repricing event.
AI Disruption Is Now Showing Up in the Data
The disruption narrative has moved from speculative to documented. Bain & Company research specifically identified MNDY's task-board workflows and HUBS's list-building functions as "spending compression" use cases — areas where third-party AI agents are absorbing value that previously accrued to SaaS seat licenses. On MNDY's own earnings call, management cited persistent no-touch and SMB churn with NDR slipping toward 110%, a meaningful deterioration from prior levels. PD guided FY27 revenue essentially flat at ~$493M vs. ~$492M — a public acknowledgment that growth has stalled. DUOL deliberately guided to 10–12% bookings growth, prioritizing user acquisition over near-term monetization, a posture that reflects competitive pressure on its consumer-facing model.
The Bifurcation: Where Floors May Be Forming vs. Where They Aren't
The thesis that "even survivors have meaningful downside left" requires stress-testing against current multiples. On that dimension, the picture is more complex than a uniform secular bear:
- Distressed tier (floors unclear): PD at ~1.1x Price/Sales and SPT at ~0.8x P/S are already trading at deep-value multiples with no visible growth re-acceleration. DOMO similarly. These names look structurally impaired.
- Quality tier (compression may be largely done): HUBS at ~3.7x P/S grew revenue 20% with NRR improving to 105% and announced a $1B buyback. MNDY at ~2.8x P/S is projecting 27% 2025 revenue growth with 14% operating margins. ZS is growing ARR ~25% YoY with AI Security ARR exceeding $400M ahead of internal targets. DUOL is profitable, guiding $350M+ FCF. These multiples are at or below the 4–6x EV/Sales pre-2021 SaaS baseline the hypothesis uses as a floor reference — meaning the de-rating has, at minimum, already normalized valuations for the stronger names.
What This Means for the Secular Narrative
The AI-disruption repricing of application-layer SaaS is real and ongoing — the Bain workflow analysis and MNDY's NDR trajectory confirm that seat-based revenue models face genuine structural headwinds. However, "secular regime change" as a uniform thesis overstates the case for platforms with durable competitive moats, accelerating ARR, and multiples now trading below historical SaaS norms. The more precise observation is a widening intra-cohort spread: AI tailwinds are accruing to security/infrastructure SaaS (ZS) and consumer-habit platforms (DUOL's language-learning loop), while horizontal workflow and CRM tools face the most direct agent-substitution risk. The weakest names — flat-growth, no AI narrative, sub-1x P/S — may be closer to distressed credit situations than traditional SaaS valuation discussions.