

Behind-the-meter power: BE and AGX are the last out, not the leading edge
Prompt v1.0
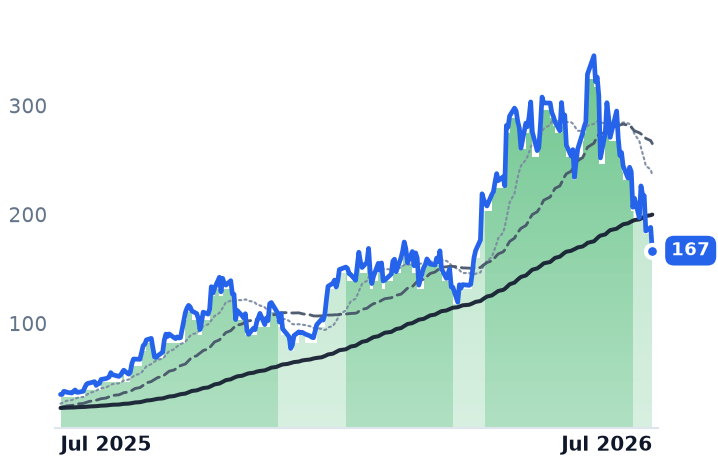
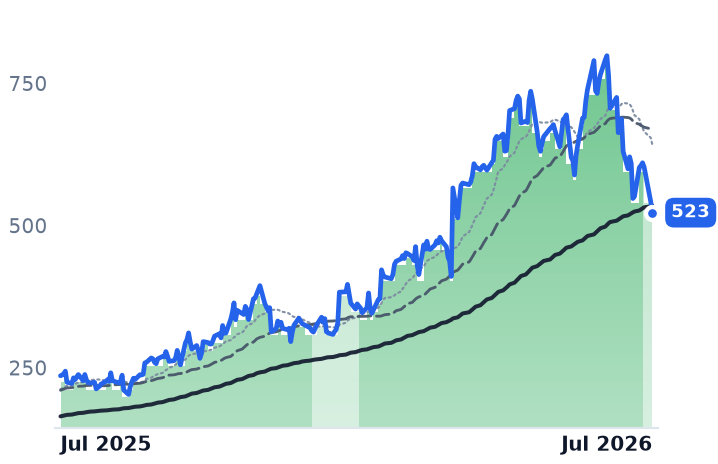
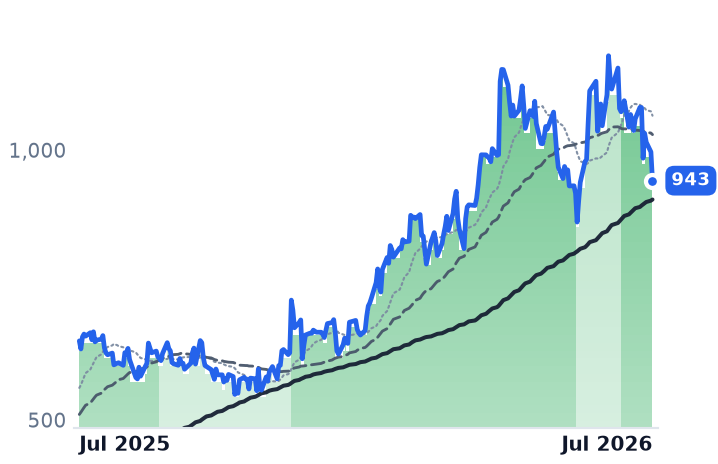
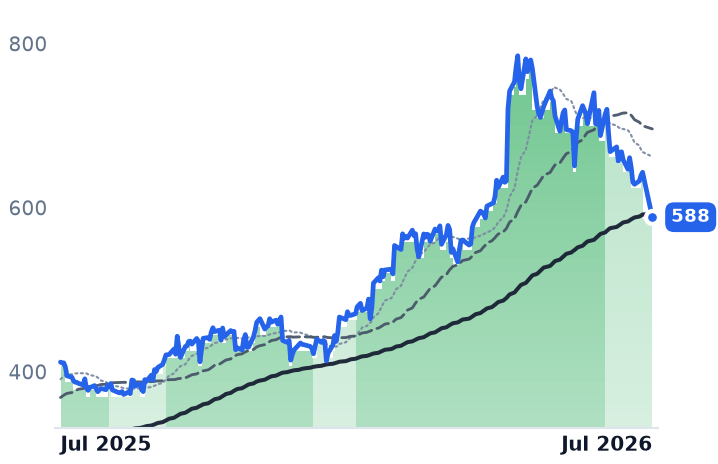
The nine-name on-site power cohort is not rolling over as one trade. Trend bands date BE (7/16) and AGX (7/22) as the last equipment names to leave strongly bullish after GEV, VRT, PWR and POWL, while the merchant/IPP leg broke a quarter earlier and is now recovering — and every macro leg of the downtrend thesis (hyperscaler capex, 48E, FERC/ERCOT co-location rules) points the other way.
| Ticker | Company | Segment | Trend · 13mo | 30D | 1Y |
|---|---|---|---|---|---|
BE | Bloom Energy | Fuel Cell & Hydrogen | 🟢 Cont. Bull | −39.3% | +379.7% |
AGX | Argan | Energy & Power Project Solutions | 🟢 Cont. Bull | −34.0% | +121.5% |
GEV | GE Vernova | GE Vernova Integrated | 🟢 Cont. Bull | −14.4% | +45.9% |
PWR | Quanta Services | Electrical & Power Infrastructure | 🟢 Cont. Bull | −17.6% | +42.9% |
POWL | Powell Industries | Electrical Distribution & Switchgear | 🟢 Cont. Bull | −28.5% | +149.3% |
TLN | Talen Energy | Wholesale Power Producers | 🟢 Cont. Bull | −18.4% | −9.1% |
CEG | Constellation Energy | Diversified Renewable Generators | ⚠️ Emerging Bear | +0.2% | −20.7% |
NRG | NRG Energy | Integrated Retail & Generation | ⚠️ Emerging Bear | −14.5% | −18.9% |
VRT | Vertiv | Data Center Power & Thermal | 🟢 Cont. Bull | −12.2% | +89.3% |
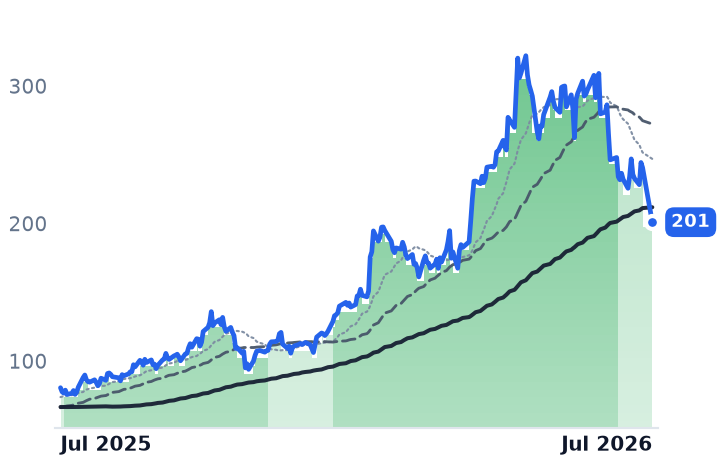
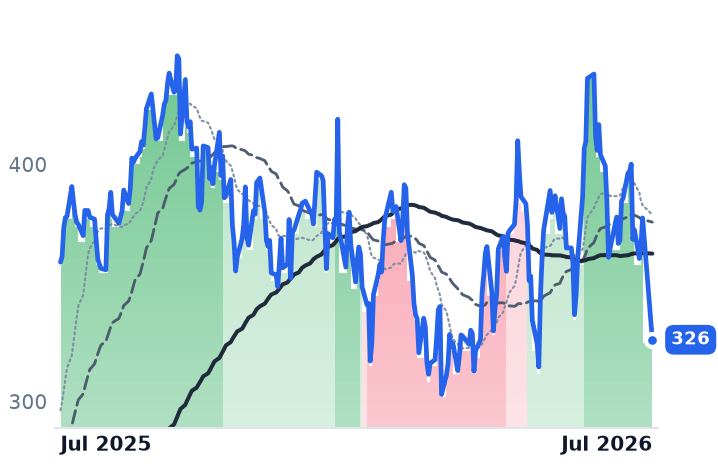
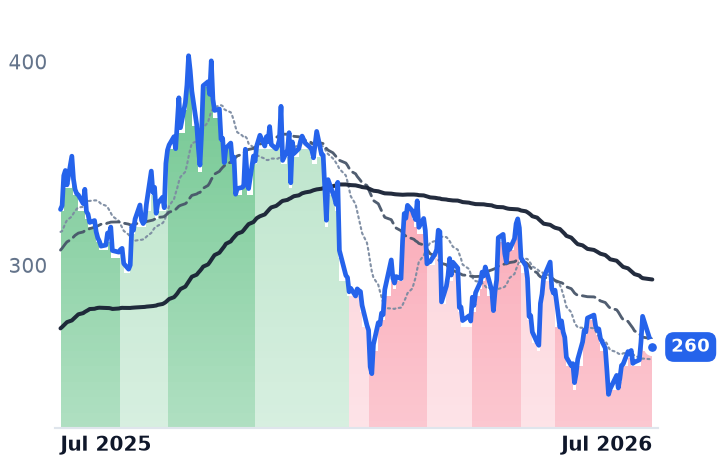
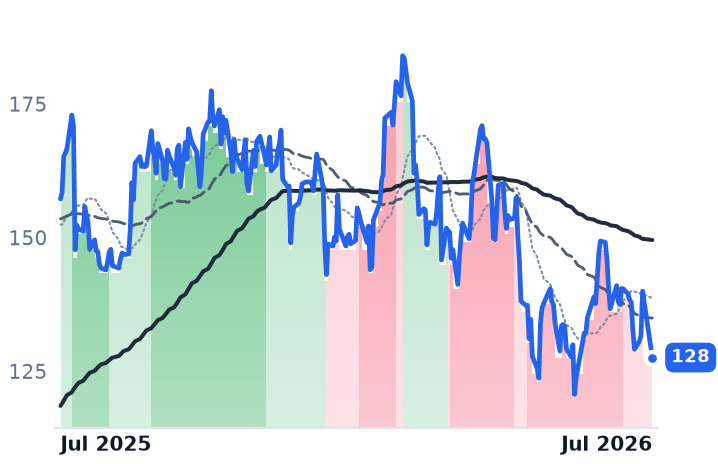
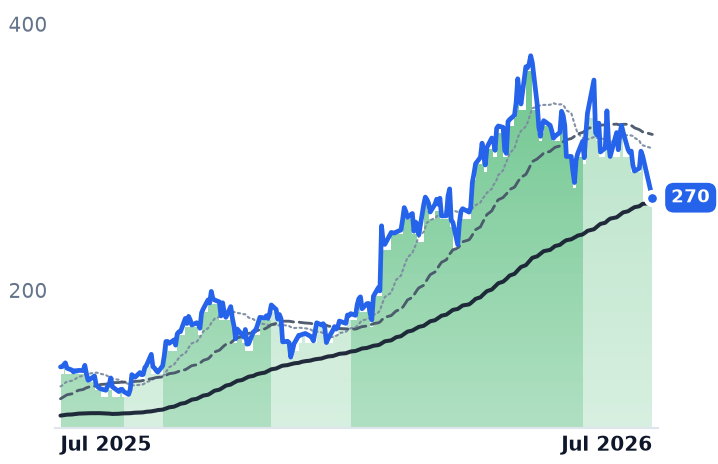
12-month price & trend
| Ticker | Mkt cap | P/E | P/E fwd | P/S | P/S fwd | P/GP | P/GP fwd | EV/EBITDA | FCF yld |
|---|---|---|---|---|---|---|---|---|---|
BE | $67.7B | 275.0x | 87.8x | 21.7x | 16.7x | 69.6x | 53.5x | 194.0x | 0.9% |
AGX | $8.0B | 49.0x | 47.2x | 7.7x | 6.2x | 36.7x | 29.8x | 40.7x | 6.1% |
GEV | $268.1B | 28.6x | 32.8x | 6.5x | 5.8x | 32.1x | 28.8x | 29.9x | 4.6% |
| Ticker | Mkt cap | P/E | P/E fwd | P/S | P/S fwd | P/GP | P/GP fwd | EV/EBITDA | FCF yld |
|---|---|---|---|---|---|---|---|---|---|
PWR | $100.3B | 75.5x | 42.9x | 3.1x | 2.7x | 21.2x | 18.5x | 35.1x | 2.4% |
POWL | $7.6B | 39.7x | 38.6x | 6.6x | 6.4x | 21.8x | 21.2x | 28.0x | 3.2% |
TLN | $16.2B | n/m | 16.9x | 4.6x | 3.6x | 10.3x | 8.1x | 32.2x | 3.1% |
| Ticker | Mkt cap | P/E | P/E fwd | P/S | P/S fwd | P/GP | P/GP fwd | EV/EBITDA | FCF yld |
|---|---|---|---|---|---|---|---|---|---|
CEG | $101.4B | 27.5x | 24.1x | 3.2x | 3.1x | 3.4x | 3.2x | 14.7x | 0.3% |
NRG | $25.4B | 31.5x | 13.5x | 0.7x | 0.7x | 4.2x | 4.4x | 11.5x | 1.4% |
VRT | $142.5B | 91.1x | 57.7x | 13.1x | 10.3x | 36.3x | 28.5x | 61.1x | 1.6% |
Consensus projections
| Ticker | FY2026E | FY2027E | FY2028E | |
|---|---|---|---|---|
BE | Revenue | +112.4% | +65.1% | +46.0% |
| EPS | +374.5% | +83.5% | +60.7% | |
AGX | Revenue | +12.1% | +36.2% | +25.4% |
| EPS | +65.8% | +44.2% | +29.3% | |
GEV | Revenue | +23.4% | +14.6% | +15.3% |
| EPS | +322.4% | −19.0% | +40.3% | |
PWR | Revenue | +34.0% | +15.2% | +13.1% |
| EPS | +46.4% | +16.9% | +17.3% | |
POWL | Revenue | +8.7% | +22.0% | +13.1% |
| EPS | +12.4% | +21.8% | +31.6% | |
TLN | Revenue | +85.4% | +16.2% | +4.4% |
| EPS | +258.6% | +48.7% | +19.6% | |
CEG | Revenue | +35.3% | +4.1% | +5.2% |
| EPS | +25.2% | +13.1% | +28.6% | |
NRG | Revenue | +17.9% | +3.2% | +4.4% |
| EPS | +13.9% | +23.1% | +17.7% | |
VRT | Revenue | +35.2% | +25.8% | +19.4% |
| EPS | +55.6% | +33.8% | +25.8% |
Forward fiscal years only. Blank means no analyst coverage for that year.
The sequence runs backwards
Band history dates a six-week stagger, not a synchronized break: GEV left strongly bullish on 6/9, VRT 6/15, PWR 6/29, POWL 7/7, BE 7/16 and AGX 7/22. GEV then re-entered strongly bullish on 7/8 and was still there at its last session on 7/27. All six names sit below their 50-day but above their 200-day averages — BE at $188.18 against a $176.98 200-day, AGX $542.52 vs $480.55, GEV $996.57 vs $830.15, PWR $643.14 vs $554.45, POWL $240.68 vs $186.72, VRT $301.16 vs $242.92. BE and AGX are the laggards of the move, not its leading edge.
The IPP leg went the other way
CEG has been in strongly bearish since 5/29 yet rose 11.8% between 7/6 and 7/22 — the same window in which BE fell 36% and AGX 25%. NRG improved from strongly bearish to mildly bearish on 7/10; TLN has held strongly bullish since 6/16. CEG's strength traces to dated sector catalysts including a Walmart nuclear PPA and the closed $27bn Calpine deal. The regulatory backdrop is constructive too: FERC's December 2025 order directed PJM to write co-location and behind-the-meter rules — the product of Constellation's 2024 complaint that followed FERC's Susquehanna rejection — while Texas SB6 gives large loads with on-site generation preferential batch-study treatment.
Every macro leg fails on the dates
Hyperscaler spend was raised, not digested: the big four are tracking roughly $725bn of 2026 capex, up 77%, with Microsoft near $190bn and Amazon ~$200bn, and 2027 consensus above $1tn. What did change was sentiment — Amazon, Meta and Microsoft sold off into their prints after Alphabet's report was panned. The OBBBA made fuel cells 48E-eligible at a flat 30% with no emissions threshold. Quanta printed record $48.5bn backlog. Bloom's 7/28 print beat on revenue (~$1.065bn vs ~$828m) and EPS and raised full-year guidance, with shares up ~11% after hours; the pre-print pressure was a dispute over ~$20bn cited backlog vs ~$492m of audited performance obligations, and Argan's slide tracks ~$119.4m of insider selling plus a small sequential backlog dip.
Two data caveats
Six of the nine symbols' prices stop on 7/22 while BE, AGX and GEV run to 7/27, so the "two worst on the watchlist" ranking is partly a window artifact. And the slide was not gap-free: BE opened 7/24 at its session high of $214.19 and closed $184.89 (-14.9% on 16m shares), while AGX has no 7/24 bar and gapped down 5.6% on 7/27. The residual bear case in the desk's notes is fuel supply — Chronometer Partners' argument that Bloom cannot source ~150 MMcf/d per GW for 24/7 baseload — not order books.