

Dell Sells AI Servers at Shrinking Margins; Celestica Gets Paid a Fee Either Way
Hypothesis Opus 5 · Research Opus 5 · Writing Opus 5 · Prompt v1.5
Dell's artificial-intelligence server business is growing faster than anything else in computer hardware, and it is arriving at a lower gross margin than the business it is replacing. Revenue in the quarter to 1 May rose 87.5% to $43.8bn; gross profit rose only 57.6%, and gross margin fell to 17.75% from 21.12% a year earlier. Memory is the reason, and it is not a one-quarter event: server DRAM contract prices are set to rise again this quarter and the shortage is expected to run through 2027.
NetApp has now guided to the same squeeze, putting fiscal 2027 gross margin at 68.5-69.5% against 70.74% delivered. Celestica, which is paid a conversion fee rather than a product price, expanded operating margin as revenue grew 62% — and is the only one of the three whose shares have de-rated, after a $3bn equity sale priced 14.5% below market.
| Ticker | Company | Segment | Trend · 13mo | 30D | 1Y |
|---|---|---|---|---|---|
| The subject · what this brief is about | |||||
DELL | Dell Technologies | Enterprise Storage & Software | 🟢 Cont. Bull | +13.3% | +223.5% |
NTAP | NetApp | Enterprise Storage & Software | 🟢 Cont. Bull | +21.8% | +82.4% |
CLS | Celestica | Electronic Manufacturing Services | 🟢 Cont. Bull | −1.8% | +63.5% |
| Compared against · context, not the story | |||||
HPE | Hewlett Packard Enterprise | Enterprise Storage & Software | 🟢 Cont. Bull | +18.8% | +152.5% |
MU | Micron Technology | Memory (DRAM/NAND) | 🟢 Cont. Bull | +7.5% | +663.5% |
WDC | Western Digital | Data Storage Devices | 🟢 Cont. Bull | −5.3% | +510.3% |
STX | Seagate Technology | Data Storage Devices | 🟢 Cont. Bull | +3.8% | +431.6% |
JBL | Jabil | Electronic Manufacturing Services | 🟢 Cont. Bull | +5.5% | +56.7% |
SMCI | Super Micro Computer | Server & Infrastructure Systems | 🌱 Emerging Bull | +57.0% | −13.5% |
GLW | Corning | Display & Optical Materials | 🟢 Cont. Bull | +4.4% | +150.2% |
12-month price & trend
| Ticker | Mkt cap | P/E | P/E fwd | P/S | P/S fwd | P/GP | P/GP fwd | EV/EBITDA | FCF yld |
|---|---|---|---|---|---|---|---|---|---|
DELL | $287.3B | 33.8x | 23.4x | 2.1x | 1.7x | 11.2x | 8.8x | 20.8x | 3.3% |
NTAP | $38.5B | 30.5x | 22.0x | 5.6x | 5.1x | 7.9x | 7.3x | 20.0x | 4.9% |
CLS | $34.7B | 31.1x | 26.6x | 2.2x | 1.7x | 19.2x | 14.6x | 23.2x | 1.5% |
| Ticker | Mkt cap | P/E | P/E fwd | P/S | P/S fwd | P/GP | P/GP fwd | EV/EBITDA | FCF yld |
|---|---|---|---|---|---|---|---|---|---|
HPE | $79.2B | 54.9x | 17.5x | 2.0x | 1.8x | 6.2x | 5.4x | 23.7x | 5.0% |
MU | $1.0T | 19.9x | 12.2x | 11.2x | 7.8x | 15.4x | 10.7x | 14.5x | 2.6% |
WDC | $166.1B | 25.6x | 48.3x | 14.1x | 12.9x | 31.1x | 28.4x | 31.1x | 1.7% |
| Ticker | Mkt cap | P/E | P/E fwd | P/S | P/S fwd | P/GP | P/GP fwd | EV/EBITDA | FCF yld |
|---|---|---|---|---|---|---|---|---|---|
STX | $178.4B | 73.9x | 53.5x | 16.2x | 14.8x | 39.0x | 35.7x | 53.6x | 1.5% |
JBL | $38.8B | 45.7x | 29.0x | 1.2x | 1.1x | 12.5x | 12.0x | 19.4x | 3.9% |
SMCI | $25.8B | 10.9x | 12.3x | 0.7x | 0.5x | 6.1x | 4.5x | 8.2x | -27.1% |
| Ticker | Mkt cap | P/E | P/E fwd | P/S | P/S fwd | P/GP | P/GP fwd | EV/EBITDA | FCF yld |
|---|---|---|---|---|---|---|---|---|---|
GLW | $131.7B | 69.2x | 46.8x | 7.8x | 6.9x | 21.4x | 18.9x | 35.6x | 1.8% |
Consensus projections
| Ticker | FY2026E | FY2027E | FY2028E | |
|---|---|---|---|---|
DELL | Revenue | +16.2% | +53.6% | +14.2% |
| EPS | +27.3% | +85.4% | +21.0% | |
NTAP | Revenue | +4.3% | +9.2% | +5.5% |
| EPS | +10.4% | +11.6% | +10.5% | |
CLS | Revenue | +67.0% | +69.3% | +32.3% |
| EPS | +90.2% | +74.7% | +34.3% | |
HPE | Revenue | +30.3% | +11.2% | +5.7% |
| EPS | +80.1% | +17.6% | +9.6% | |
MU | Revenue | +248.0% | +92.8% | +11.4% |
| EPS | +804.9% | +111.2% | +7.9% | |
WDC | Revenue | +36.9% | +37.2% | +26.5% |
| EPS | +106.2% | +72.8% | +48.0% | |
STX | Revenue | +32.7% | +35.9% | +24.9% |
| EPS | +86.9% | +77.9% | +48.0% | |
JBL | Revenue | +20.2% | +21.2% | +12.1% |
| EPS | +35.9% | +31.0% | +20.3% | |
SMCI | Revenue | +77.7% | +34.0% | +19.7% |
| EPS | +33.5% | +15.5% | +13.7% | |
GLW | Revenue | +17.5% | +18.7% | +21.0% |
| EPS | +29.6% | +31.7% | +36.5% |
Forward fiscal years only. Blank means no analyst coverage for that year.
Dell Technologies recognized $16.1bn of artificial-intelligence server revenue in the quarter to 1 May, and the more of those machines it shipped, the less of each dollar it kept. Revenue for the quarter rose 87.5% to $43.8bn. Gross profit rose 57.6%. The gap is the whole story: gross margin fell to 17.75% from 21.12% a year earlier, a compression of 337 basis points, and it has now declined in every fiscal year of the AI build — 23.83%, then 22.24%, then 20.00%.
Dell sells servers, storage and networking through its Infrastructure Solutions Group and PCs through its Client Solutions Group. It is the largest branded seller of AI servers by volume, and in a box built around someone else's accelerator, memory is the single biggest input Dell buys itself.
Who pays for the memory
Contract prices for server DRAM (dynamic random-access memory) are expected to rise 13-18% quarter on quarter in the third quarter of 2026, with the market undersupplied. TrendForce expects the shortage to persist through 2027, RDIMM bit supply growing only 15-20% against faster server CPU shipments. Crucially, several large US cloud providers have locked multi-year agreements capping their increases — so the rises land on buyers without such contracts and on incremental volume outside them. Dell told investors in May that demand exceeds supply and named memory, CPUs and hard drives as the constraints, warning of shortages in the second half of its fiscal year. Amazon has attributed a $20bn rise in capital spending to higher memory prices rather than added capacity.
NetApp, which sells all-flash enterprise storage arrays and the ONTAP data-management software that runs them, has guided the same mechanism explicitly: fiscal 2027 gross margin of 68.5-69.5% against 70.74% delivered in fiscal 2026, citing higher memory and NAND flash costs. That comes with the best revenue growth in three years — up 12.5% in the April quarter — and record all-flash array revenue of $1.2bn.
Celestica, the Toronto contract manufacturer that builds switches, interconnect and full server racks for hyperscalers, sits on the other side of the trade. Its gross margin is 12.29%, roughly one-sixth of NetApp's, because it is paid to convert components into finished racks rather than to sell a product at a price. June-quarter revenue rose 62.4% to $4.70bn and operating margin expanded, to 9.75% from 9.42%. Management guided gross margin to stay in the mid-11% range through 2026 and said material availability, not factory floor space, is the bottleneck, with customers placing non-cancellable orders for long-lead silicon — a structure that hands component risk back to the buyer.
What the prices already assume
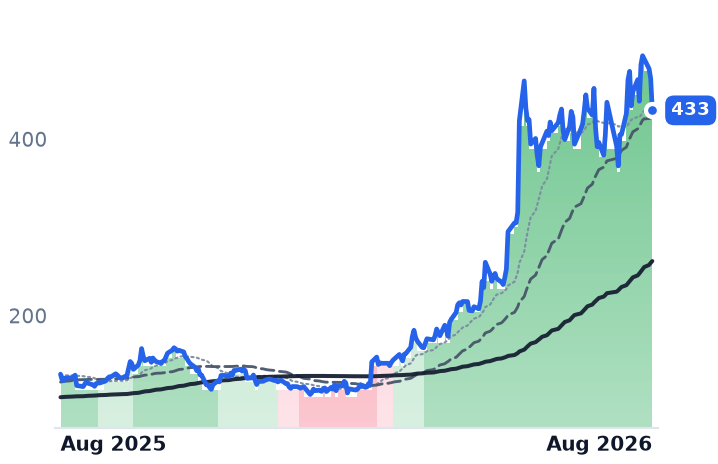
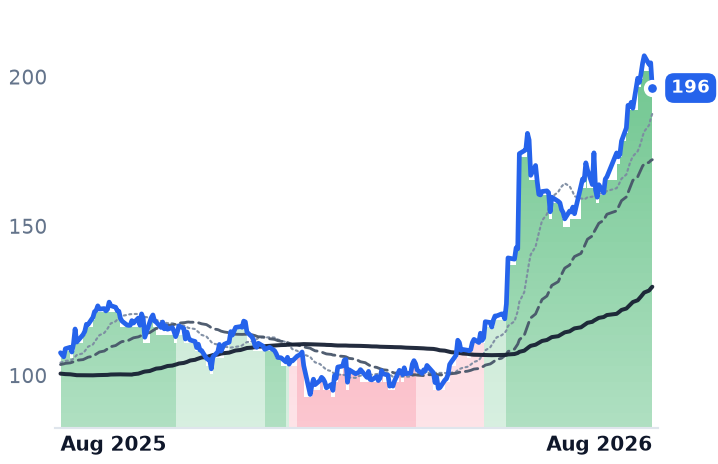
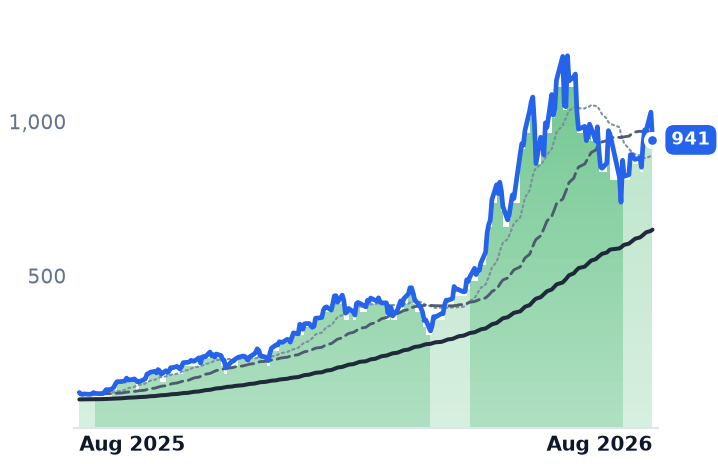
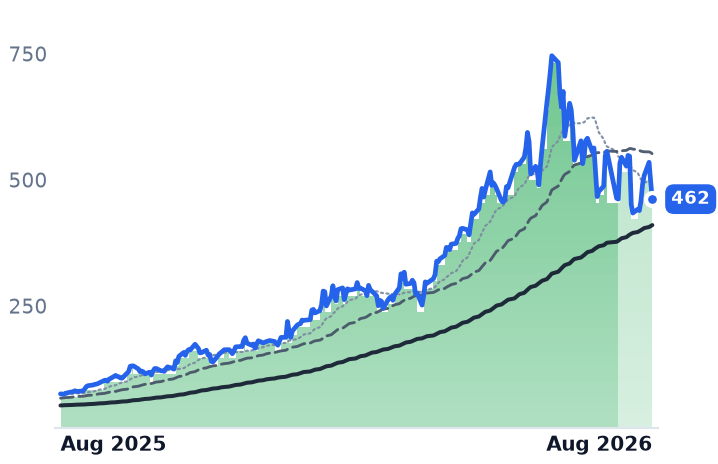
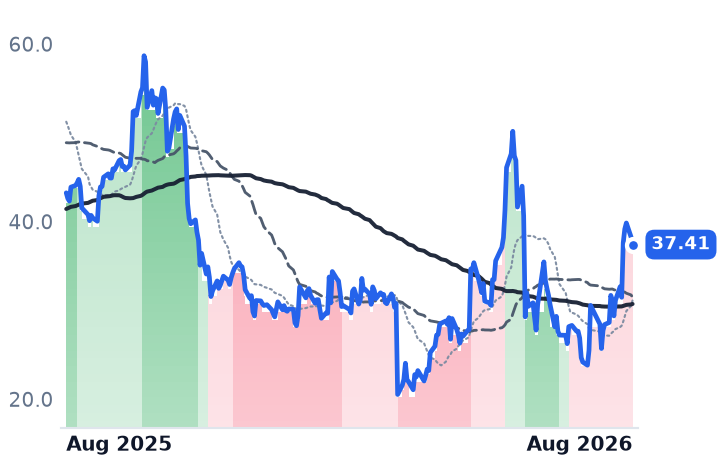
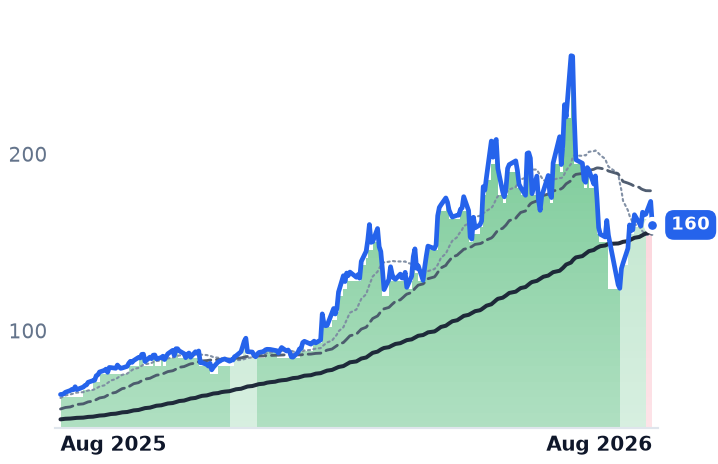
Dell's shares have risen 220% in twelve months. Its trailing twelve-month gross profit rose 20.7% over the same period, to $25.55bn. Price-to-gross-profit — the only comparable lens when margins in one group range from 12% to 70% — stands at 11.25x, against 6.99x in mid-May and roughly 4.5x a year ago. NetApp shows the same shape in miniature: gross profit up 6.2%, shares up 80%, the multiple moving from about 4.8x to 7.86x.
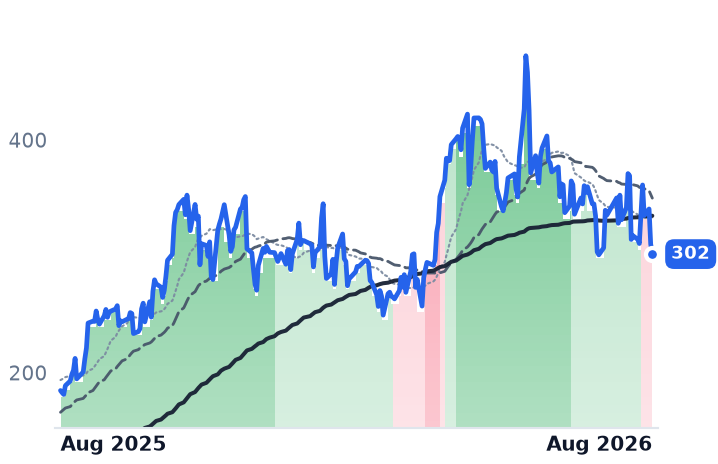
Celestica is the exception, and it is the surprising one. Its trailing gross profit grew 52% year on year, yet its price-to-gross-profit fell from 26.26x in mid-May to 19.19x. The break traces to a single dated event rather than to demand: on 5 August it priced 9.68m shares at $310.00 for $3bn of gross proceeds, a 14.5% discount to the prior close, to fund capacity. The stock fell about 15% the next session and now trades below the offer price — this after the company raised full-year guidance to $20.5bn of revenue and disclosed custom-rack programs with OpenAI and AMD.
One caution on Dell's advance: it is concentrated, not gradual. The 13.3% gain over the past 30 sessions becomes a 5.4% loss if the two best days are removed, and four sessions in that window fell 5% or more.
The setup
Where it stands — AI revenue is arriving at Dell and NetApp with lower gross margins, while Celestica's fee-based model passes the cost through.
Would confirm — Dell's fiscal Q2 gross margin printing below the 17.75% of the prior quarter as AI mix rises again.
Would invalidate — Dell holding gross margin near 20% while AI server revenue grows, showing memory costs are contracted forward.
Watch next — Dell reports fiscal Q2 on 1 September; NetApp reports fiscal Q1 after the close on 2 September.
Valuation — Dell at 33.8x trailing and 23.4x forward earnings; 11.25x trailing gross profit against 6.99x in mid-May.