

The Trade Desk Kept a Bigger Cut of Each Ad Dollar and Still Guided Revenue Down 12%
Hypothesis Opus 5 · Research Opus 5 · Writing Opus 5 · Prompt v1.6
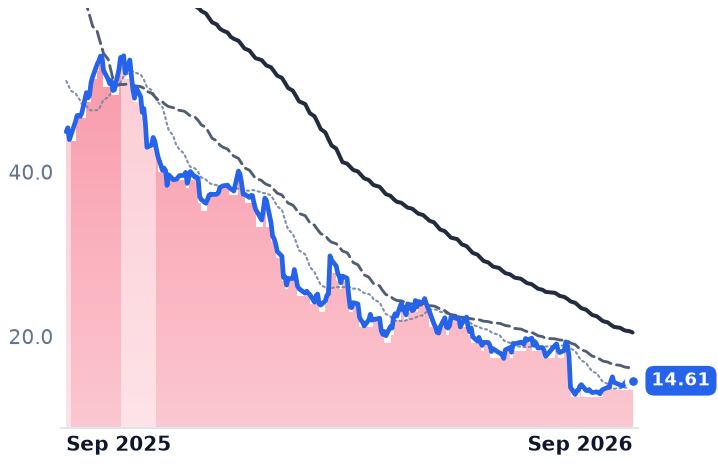
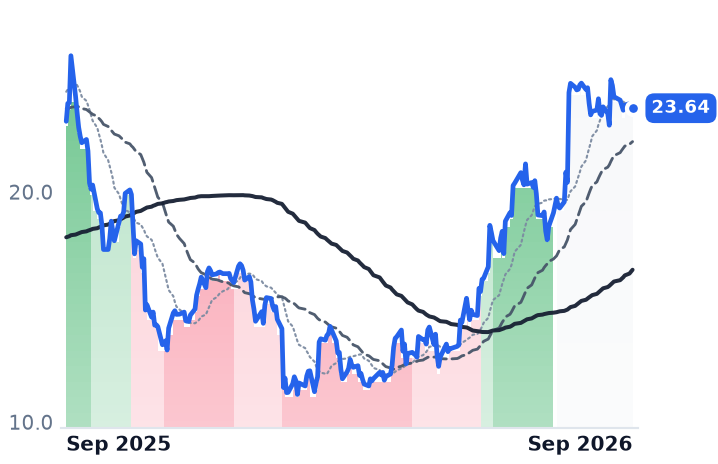
A twelve-month decline that reads like a sector selling off is really one company. The Trade Desk, the largest independent platform for buying digital advertising, lost about two-thirds of its value in a year; Magnite, the sell-side platform sitting on the other end of many of the same streaming impressions, finished the year roughly where it began.
The fee is not what broke. In 2025 $13.4bn of client spend crossed The Trade Desk's platform against $2.896bn of revenue — 21.6 cents on the dollar, up from 20.3 cents the year before. What slowed was the spend routed to it: revenue growth decayed from 17.7% to 3.0% over four quarters, and the September quarter is guided down about 12%. Magnite, paid per impression it monetizes for publishers, grew its streaming line 36% in the June quarter and raised full-year guidance.
The de-rating is earned. What it does not explain is the cash still coming out of the business.
| Ticker | Company | Segment | Trend · 13mo | 30D | 1Y |
|---|---|---|---|---|---|
| The subject · what this brief is about | |||||
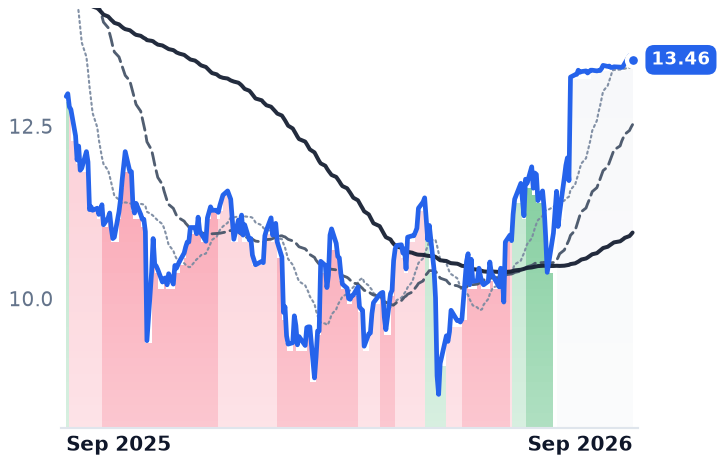
TTD | The Trade Desk | Programmatic Ad Platforms | 🔴 Cont. Bear | +8.7% | −67.4% |
MGNI | Magnite | Programmatic Ad Platforms | 🌱 Emerging Bull | −3.3% | +2.5% |
| Compared against · context, not the story | |||||
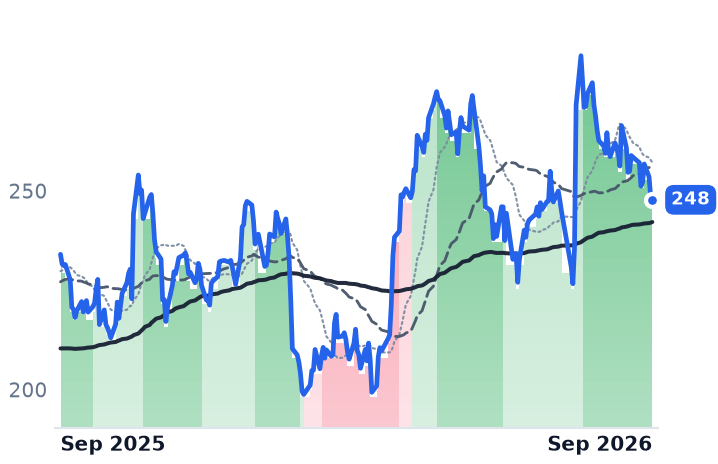
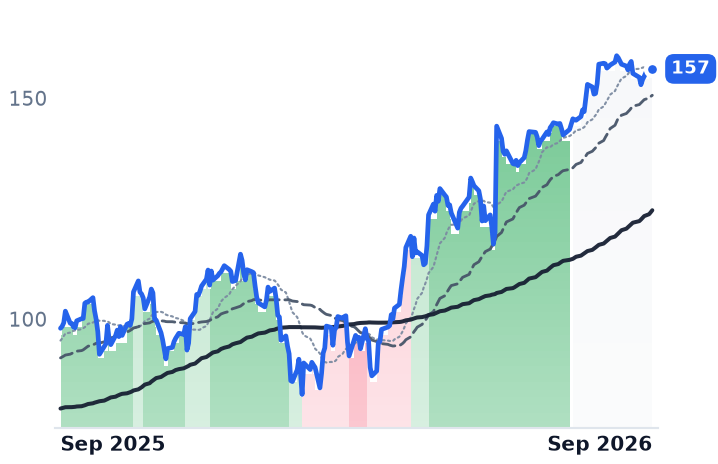
AMZN | Amazon.com | Online Marketplaces | 🟢 Cont. Bull | −5.2% | +5.9% |
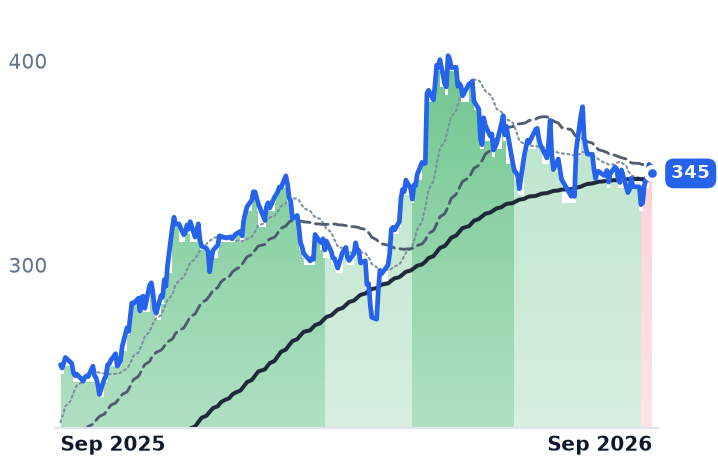
GOOGL | Alphabet | Search & Advertising | 🟢 Cont. Bull | +0.3% | +37.3% |
DV | DoubleVerify | Marketing & Advertising Technology | 🌱 Emerging Bull | +1.2% | +4.1% |
ROKU | Roku | Streaming Video Platforms | 🟢 Cont. Bull | −0.8% | +60.0% |
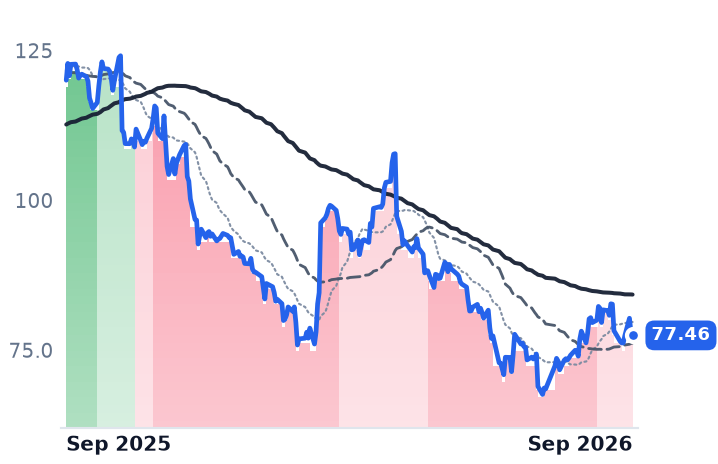
NFLX | Netflix | Streaming Video Platforms | 🔴 Cont. Bear | +1.6% | −35.5% |
12-month price & trend
| Ticker | Mkt cap | P/E | P/E fwd | P/S | P/S fwd | P/GP | P/GP fwd | EV/EBITDA | FCF yld |
|---|---|---|---|---|---|---|---|---|---|
TTD | $6.8B | 17.2x | 36.9x | 2.3x | 2.5x | 2.7x | 3.0x | 7.7x | 12.6% |
MGNI | $3.4B | 20.3x | 21.0x | 4.6x | 4.5x | 7.1x | 6.9x | 22.4x | 6.2% |
AMZN | $2.9T | 21.2x | 21.1x | 3.7x | 3.5x | 7.3x | 6.8x | 11.9x | -0.4% |
| Ticker | Mkt cap | P/E | P/E fwd | P/S | P/S fwd | P/GP | P/GP fwd | EV/EBITDA | FCF yld |
|---|---|---|---|---|---|---|---|---|---|
GOOGL | $4.2T | 17.3x | 17.0x | 9.5x | 8.5x | 15.6x | 13.9x | 13.1x | 1.3% |
DV | $2.1B | 36.2x | 30.7x | 2.7x | 2.5x | 3.3x | 3.2x | 12.4x | 7.5% |
ROKU | $18.3B | 90.8x | 50.9x | 3.7x | 3.3x | 8.3x | 7.5x | 47.9x | 3.6% |
| Ticker | Mkt cap | P/E | P/E fwd | P/S | P/S fwd | P/GP | P/GP fwd | EV/EBITDA | FCF yld |
|---|---|---|---|---|---|---|---|---|---|
NFLX | $366.4B | 27.5x | 24.4x | 7.8x | 7.1x | 15.9x | 14.5x | 10.9x | 3.2% |
Consensus projections
| Ticker | FY2026E | FY2027E | FY2028E | |
|---|---|---|---|---|
TTD | Revenue | −4.9% | −4.5% | +9.1% |
| EPS | −54.1% | −38.4% | +83.4% | |
MGNI | Revenue | +13.7% | +10.7% | +13.9% |
| EPS | +29.5% | +18.5% | +12.0% | |
AMZN | Revenue | +15.9% | +14.6% | +16.0% |
| EPS | +76.8% | −16.1% | +30.8% | |
GOOGL | Revenue | +24.3% | +22.9% | +19.1% |
| EPS | +93.4% | −26.6% | +18.2% | |
DV | Revenue | +7.4% | +8.6% | +6.1% |
| EPS | +50.1% | +30.5% | +6.0% | |
ROKU | Revenue | +18.1% | +11.9% | +13.0% |
| EPS | +626.0% | +46.2% | +48.7% | |
NFLX | Revenue | +14.0% | +11.6% | +10.0% |
| EPS | +39.2% | +7.5% | +19.5% |
Forward fiscal years only. Blank means no analyst coverage for that year.
The Trade Desk is paid a percentage of the advertising money that passes through its buying platform. In 2025 that percentage went up. The money passing through went up more slowly — and that, not fee compression, is what the last year of trading has been about.
The distinction matters because the company reports only its own take, never the gross. It discloses client spend on its platform once a year, in the annual report, defined as spend on inventory, data and services plus its own fee — $13.4bn for 2025 against $2.896bn of revenue, or 21.6 cents on the dollar, versus $12bn and $2.445bn in 2024, or 20.3 cents. Revenue grew 18.5% that year while the spend behind it grew about 12%. Chief executive Jeff Green has said the take rate has been flat for a decade, through Kokai, identity products and new artificial-intelligence tools. Either way, the meter that decelerated first was volume routed through the seat.
The routing, quarter by quarter
What followed is visible without any modeling. Year-on-year revenue growth went 17.7%, 14.3%, 11.8%, then 3.0% in the June 2026 quarter, to $715.1m. Operating margin fell to 14.2% from 16.8%, with operating income down 13% on revenue up 3%. Guidance for the September quarter is at least $650m — about a 12% decline — and roughly $160m of adjusted earnings before interest, taxes, depreciation and amortization. "We underperformed our own expectations for two main reasons: macro conditions have made it more difficult for some of the world's largest brands to grow, and we didn't execute as well as we could have," Green told investors on the August 6 call. Consumer packaged goods and automotive, about a quarter of platform spend, were the stated drag: "Autos and CPG have both been set back by tariffs and oil prices."
The competitive half is dated and specific. Amazon charges roughly a 1% fee on open-web publisher ads and nothing for guaranteed deals on its own media, against a take reported at around 20% for The Trade Desk; its demand-side platform went from under 10% to just under 20% of programmatic share in about fifteen months. Digiday's survey work found the share of brands and agencies saying they had used The Trade Desk in the prior year fell from 55% to 39% between early 2024 and late 2025 — a routing datapoint that preceded the revenue break. Omnicom and Publicis have both audited its fee structures. On 4 September, 575 jobs — 15% of staff — ended, at a severance cost of $39m to $51m.
The same impressions, a different meter
Magnite runs the independent sell-side platform publishers use to monetize inventory, and it is paid per impression it clears rather than as a share of the buyer's budget. In the June quarter its contribution after traffic-acquisition costs — the revenue it keeps — rose 17% to $189.6m, with the connected-television line up 36% to $97.1m and the open-internet display line up 2%. It raised full-year guidance to 13-14% growth on 5 August, the same fortnight The Trade Desk guided down. "CTV represented 51% of total Contribution ex-TAC in the quarter," chief executive Michael Barrett said on the call, attributing the growth to same-store gains at Netflix, Roku and Warner Bros. Discovery rather than a single renewal. Jounce Media's supply-path work puts Magnite's coverage of US streaming supply at 99% on a dollar-weighted basis.
That is the mechanism in one line: streaming supply is expanding faster than streaming budgets, so the price per thousand impressions is falling — Netflix's average fell from about $42 to roughly $31 after Amazon's ad tier launched. More impressions at less money each is neutral-to-good for a per-impression fee and corrosive to a percentage-of-spend fee. Programmatic demand is not shrinking; the dollars are being counted differently on each side of it.
What the prices now say
The Trade Desk's shares have traded with the 50-day average below the 200-day without a break since mid-November 2025; Magnite crossed back the other way in June and has roughly doubled off its March low. At 2.3x trailing sales against roughly 7.6x a year ago, The Trade Desk looks cheap against its own history — but forward earnings multiples sit above trailing ones, near 37x, because consensus has 2026 revenue falling about 5% and earnings per share at $0.39 against $0.91. The cheapness is the denominator moving, not the price. Magnite, at about 21x forward earnings, now commands a higher price against gross profit than The Trade Desk does, an inversion of how these two have traded for most of their listed lives.
The verdict the evidence supports is narrow and uncomfortable: the de-rating is earned by the business, but it is earned by lost routing volume, and the fix — winning spend back from a competitor charging a twentieth of the fee — is not something a cost cut delivers. Against that sits the one fact the bear case does not absorb: about $1.5bn of cash, a trailing free-cash-flow yield near 13%, and $78m of stock repurchased in the June quarter against a market value under $7bn.
On Monday, The Trade Desk leaves the S&P 500 and drops into the small-cap index, a little over a year after joining at $80.21. The November print will show the take. The number that would actually settle the argument — how many dollars still route through the platform — is disclosed once a year, and not until the annual report.