

Salesforce Borrowed $25bn to Shrink Its Share Count 10%. The Stock Rose and Got Cheaper.
Hypothesis Opus 5 · Research Opus 5 · Writing Opus 5 · Prompt v1.5
Enterprise software spent a year priced as agentic artificial intelligence's first casualty. In a month it took that back — and the two biggest names got there by opposite routes, only one of which the numbers support.
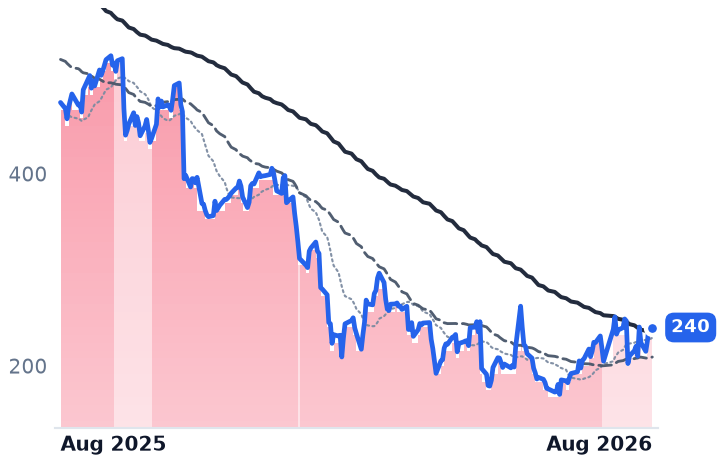
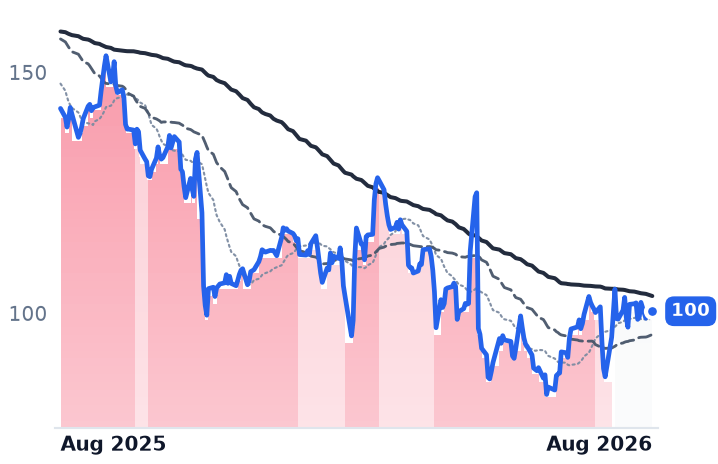
Salesforce, the per-seat customer-relationship suite, raised $25bn of debt in March and spent it retiring stock. Diluted shares fell to 871m from 970m, earnings per share jumped 52%, and revenue growth accelerated for a third straight quarter to 13.3%. The shares climbed and still got cheaper: about 5.15x trailing gross profit, against roughly 7.9x a year ago. The bill is a halved free-cash-flow growth guide.
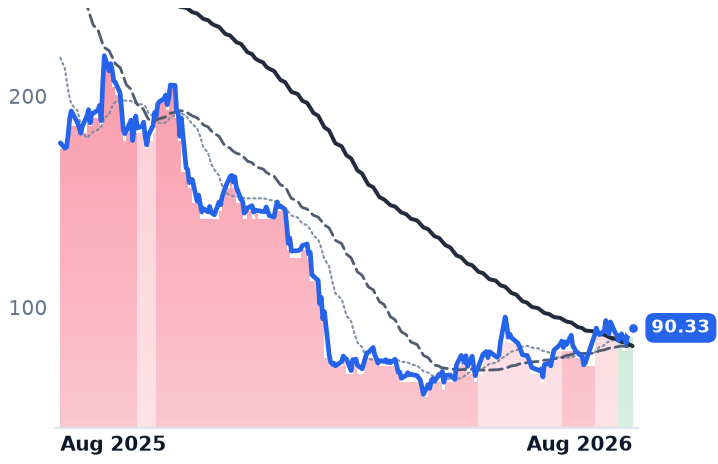
ServiceNow's workflow platform is winning the demand argument — annual contract value from AI crossed $1bn, renewals run at 98% — while handing back 680 basis points of gross margin. Its multiple expanded 25% since February on 13% gross-profit growth.
| Ticker | Company | Segment | Trend · 13mo | 30D | 1Y |
|---|---|---|---|---|---|
| The subject · what this brief is about | |||||
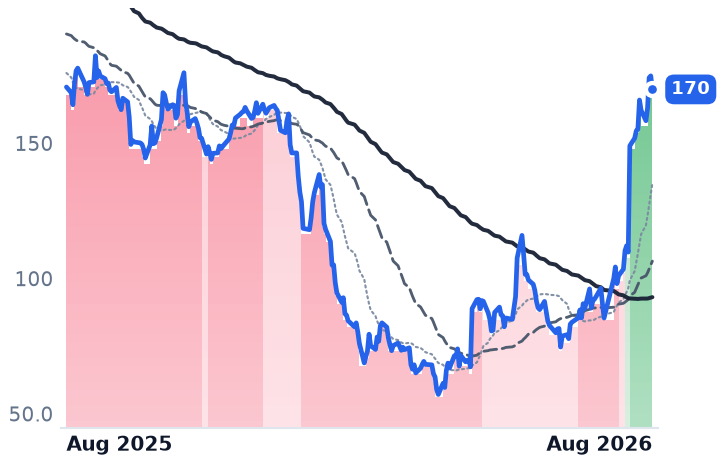
CRM | Salesforce | Customer Experience & CRM | 🔴 Cont. Bear | +15.2% | −15.3% |
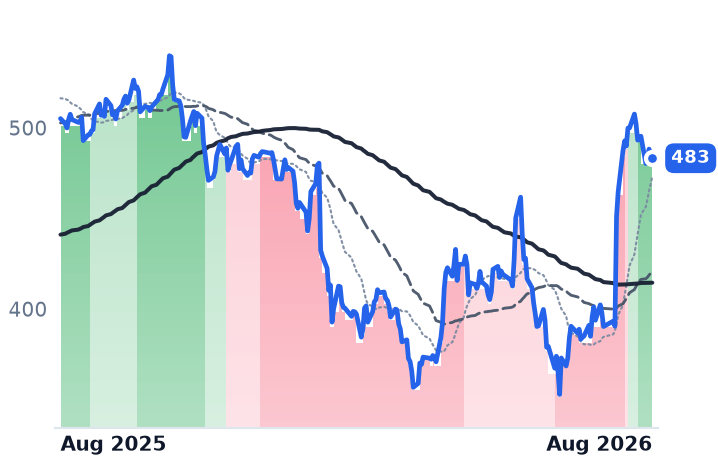
NOW | ServiceNow | Specialized Enterprise Solutions | 🔴 Cont. Bear | +16.1% | −27.6% |
| Compared against · context, not the story | |||||
ADBE | Adobe | Design & Content Creation | 🔴 Cont. Bear | +10.5% | −24.0% |
WDAY | Workday | Enterprise Resource Planning | 🌱 Emerging Bull | +25.2% | −9.6% |
HUBS | HubSpot | Customer Experience & CRM | 🔴 Cont. Bear | +0.8% | −49.4% |
MNDY | monday.com | Other | 🔴 Cont. Bear | +3.7% | −49.2% |
ORCL | Oracle | Cloud Infrastructure & Platforms | 🔴 Cont. Bear | +21.2% | −38.0% |
SAP | SAP | Enterprise Resource Planning | 🔴 Cont. Bear | +22.1% | −17.9% |
TEAM | Atlassian | Developer Tools & DevOps | 🔴 Cont. Bear | +69.9% | −0.5% |
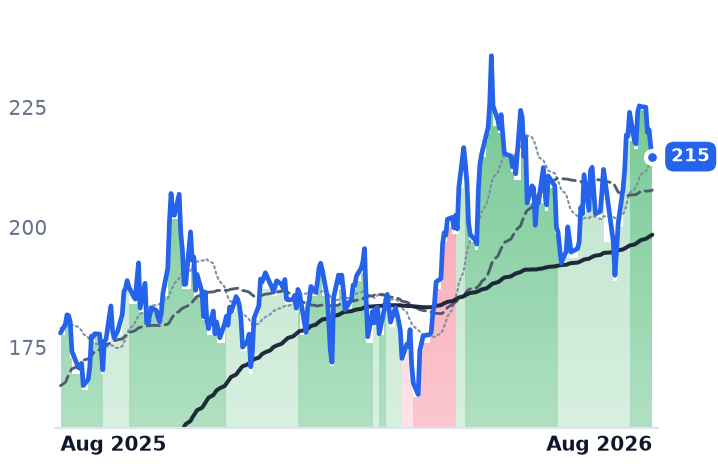
MSFT | Microsoft | Cloud Infrastructure & Platforms | 🔴 Cont. Bear | +22.9% | −4.3% |
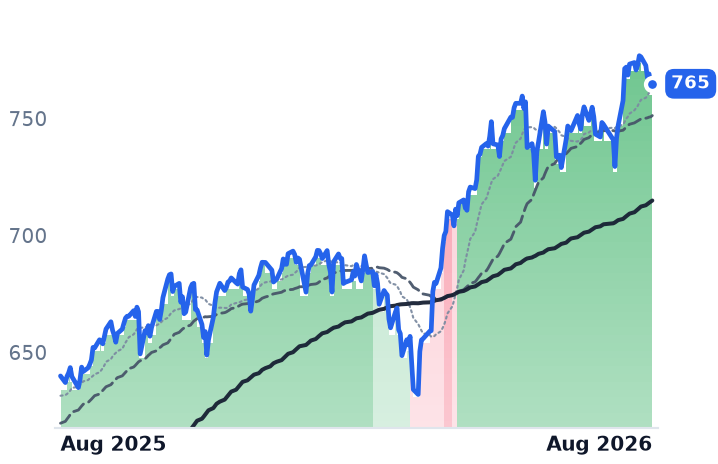
SPY | State Street SPDR S&P 500 ETF Trust | Asset Management | 🟢 Cont. Bull | +3.2% | +19.5% |
NVDA | NVIDIA | AI & Data Center GPUs | 🟢 Cont. Bull | +9.0% | +20.6% |
AMD | Advanced Micro Devices | AI & Data Center GPUs | 🟢 Cont. Bull | +4.1% | +182.1% |
AVGO | Broadcom | Semiconductor Subsystems | 🟢 Cont. Bull | −3.3% | +26.0% |
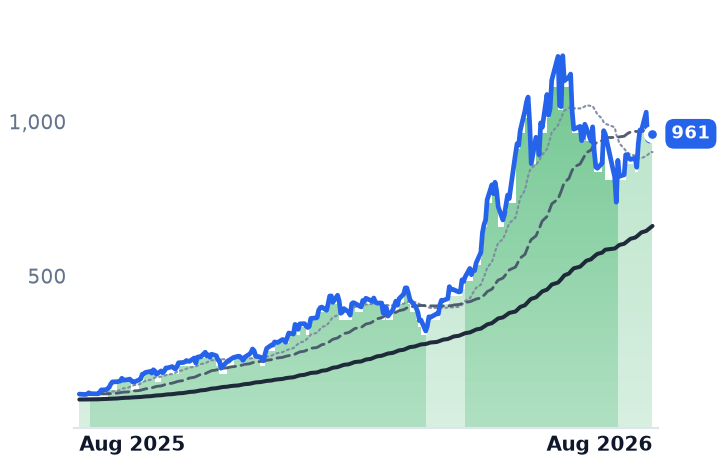
MU | Micron Technology | Memory (DRAM/NAND) | 🟢 Cont. Bull | +17.1% | +717.5% |
BRZE | Braze | Customer Experience & CRM | 🌱 Emerging Bull | +23.7% | +15.5% |
NICE | NICE | Customer Experience & CRM | 🔴 Cont. Bear | +15.7% | −29.5% |
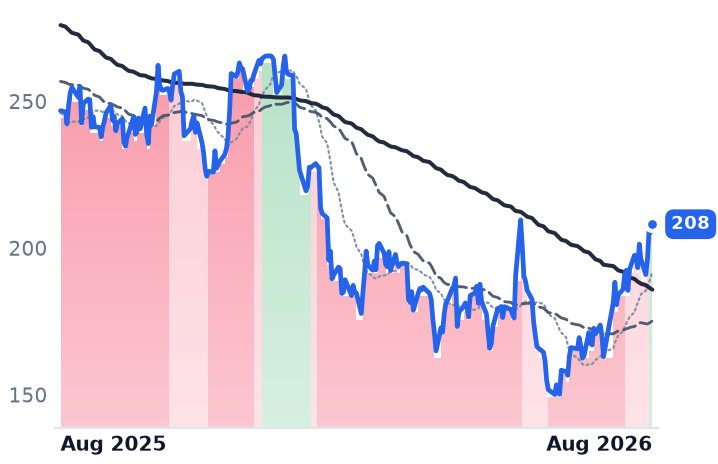
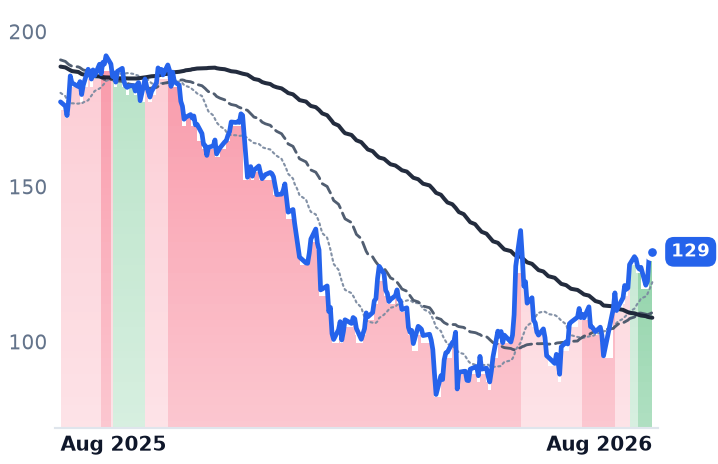
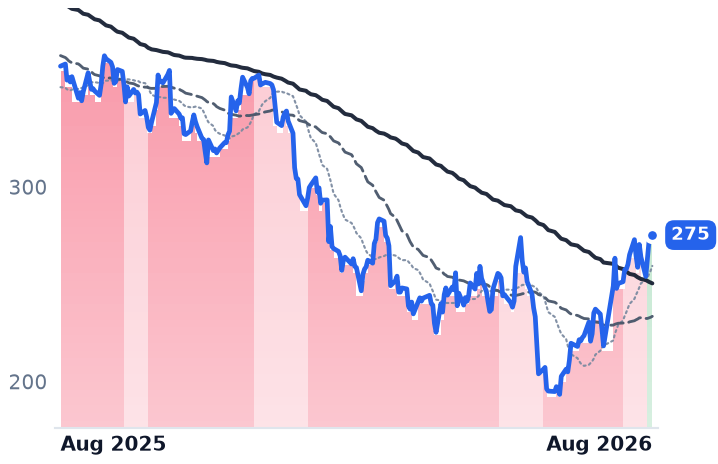
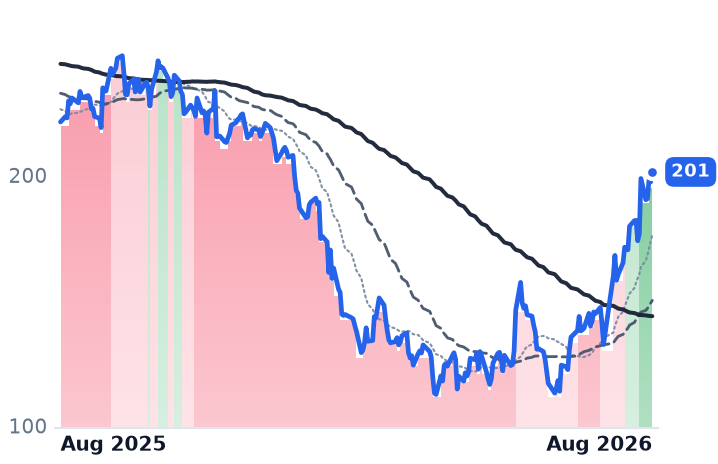
12-month price & trend
| Ticker | Mkt cap | P/E | P/E fwd | P/S | P/S fwd | P/GP | P/GP fwd | EV/EBITDA | FCF yld |
|---|---|---|---|---|---|---|---|---|---|
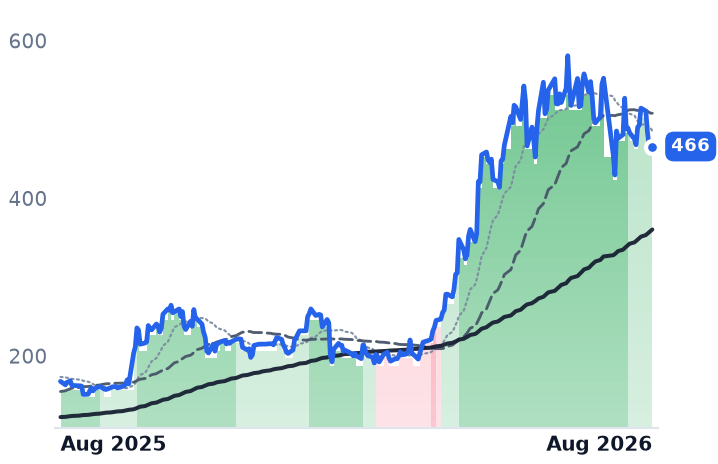
CRM | $171.3B | 24.1x | 14.8x | 4.0x | 3.7x | 5.2x | 4.8x | 14.6x | 8.6% |
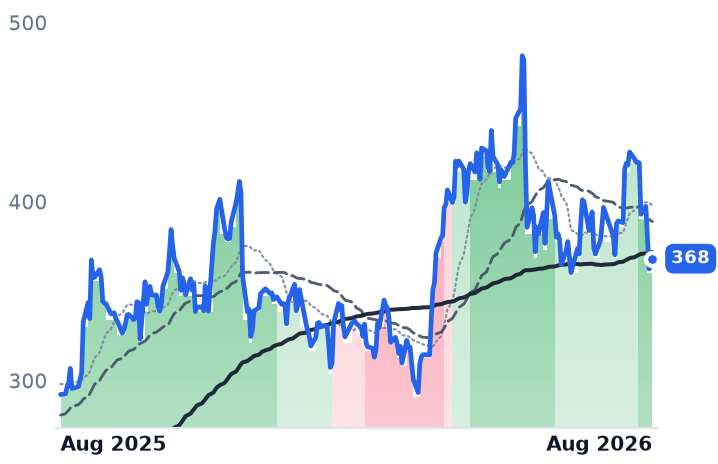
NOW | $132.8B | 79.8x | 31.6x | 9.0x | 8.2x | 12.1x | 11.0x | 39.8x | 3.4% |
ADBE | $109.4B | 15.7x | 11.3x | 4.3x | 4.1x | 4.9x | 4.6x | 11.2x | 9.7% |
| Ticker | Mkt cap | P/E | P/E fwd | P/S | P/S fwd | P/GP | P/GP fwd | EV/EBITDA | FCF yld |
|---|---|---|---|---|---|---|---|---|---|
WDAY | $52.4B | 62.1x | 18.6x | 5.3x | 4.9x | 7.0x | 6.5x | 33.2x | 5.7% |
HUBS | $12.3B | 84.8x | 18.1x | 3.6x | 3.3x | 4.3x | 4.0x | 40.8x | 6.2% |
MNDY | $3.8B | 38.0x | 16.6x | 2.8x | 2.6x | 3.2x | 2.9x | 34.1x | 7.8% |
| Ticker | Mkt cap | P/E | P/E fwd | P/S | P/S fwd | P/GP | P/GP fwd | EV/EBITDA | FCF yld |
|---|---|---|---|---|---|---|---|---|---|
ORCL | $433.0B | 25.3x | 18.7x | 6.4x | 4.8x | 9.8x | 7.3x | 17.4x | -5.5% |
SAP | $254.8B | 27.5x | 30.9x | 5.7x | 6.4x | 7.8x | 8.7x | 14.8x | 4.0% |
TEAM | $45.1B | n/m | 31.3x | 6.9x | 6.0x | 8.1x | 7.1x | 298.8x | 2.9% |
| Ticker | Mkt cap | P/E | P/E fwd | P/S | P/S fwd | P/GP | P/GP fwd | EV/EBITDA | FCF yld |
|---|---|---|---|---|---|---|---|---|---|
MSFT | $3.7T | 27.5x | 25.2x | 11.1x | 9.4x | 16.3x | 13.9x | 18.2x | 1.8% |
SPY | $773.0B | — | — | — | — | — | — | — | — |
NVDA | $5.5T | 34.3x | 25.0x | 21.5x | 13.9x | 29.0x | 18.7x | 28.3x | 2.2% |
| Ticker | Mkt cap | P/E | P/E fwd | P/S | P/S fwd | P/GP | P/GP fwd | EV/EBITDA | FCF yld |
|---|---|---|---|---|---|---|---|---|---|
AMD | $771.7B | 120.1x | 61.9x | 18.7x | 15.1x | 35.1x | 28.4x | 71.9x | 1.1% |
AVGO | $1.8T | 59.5x | 31.8x | 23.2x | 16.6x | 34.7x | 24.8x | 42.8x | 1.9% |
MU | $1.0T | 19.9x | 12.2x | 11.2x | 7.8x | 15.4x | 10.7x | 14.5x | 2.6% |
| Ticker | Mkt cap | P/E | P/E fwd | P/S | P/S fwd | P/GP | P/GP fwd | EV/EBITDA | FCF yld |
|---|---|---|---|---|---|---|---|---|---|
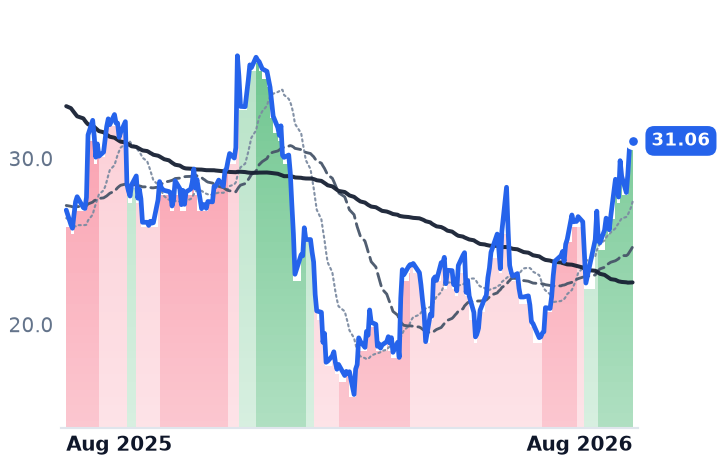
BRZE | $3.5B | n/m | 49.3x | 4.5x | 3.9x | 6.7x | 5.9x | n/m | 1.9% |
NICE | $5.9B | 14.2x | 9.0x | 1.9x | 1.9x | 2.9x | 2.9x | 6.8x | 10.8% |
Consensus projections
| Ticker | FY2026E | FY2027E | FY2028E | |
|---|---|---|---|---|
CRM | Revenue | +9.3% | +11.1% | +9.4% |
| EPS | +17.4% | +20.2% | +10.4% | |
NOW | Revenue | +22.4% | +18.7% | +18.6% |
| EPS | +17.1% | +23.2% | +21.4% | |
ADBE | Revenue | +12.0% | +9.1% | +8.8% |
| EPS | +17.2% | +12.7% | +14.2% | |
WDAY | Revenue | +13.4% | +11.8% | +11.0% |
| EPS | +26.5% | +18.6% | +17.3% | |
HUBS | Revenue | +18.2% | +14.2% | +14.0% |
| EPS | +38.2% | +25.7% | +18.6% | |
MNDY | Revenue | +19.8% | +15.2% | +14.9% |
| EPS | +27.8% | +22.3% | +19.1% | |
ORCL | Revenue | +17.8% | +33.2% | +45.5% |
| EPS | +25.3% | +7.6% | +35.6% | |
SAP | Revenue | +9.0% | +11.7% | +12.1% |
| EPS | +17.5% | +16.7% | +16.6% | |
TEAM | Revenue | +24.7% | +15.4% | +14.7% |
| EPS | +55.5% | −0.1% | +21.6% | |
MSFT | Revenue | +18.0% | +18.2% | +19.6% |
| EPS | +26.7% | +15.4% | +18.5% | |
NVDA | Revenue | +65.1% | +84.2% | +43.2% |
| EPS | +59.0% | +91.7% | +42.0% | |
AMD | Revenue | +49.6% | +73.6% | +36.8% |
| EPS | +92.9% | +105.5% | +42.5% | |
AVGO | Revenue | +66.8% | +66.1% | +34.5% |
| EPS | +71.8% | +68.7% | +34.8% | |
MU | Revenue | +248.0% | +92.8% | +11.4% |
| EPS | +804.9% | +111.2% | +7.9% | |
BRZE | Revenue | +24.3% | +22.8% | +16.6% |
| EPS | +281.2% | +50.3% | +52.1% | |
NICE | Revenue | +8.2% | +9.1% | +11.8% |
| EPS | −8.9% | +13.7% | +22.2% |
Forward fiscal years only. Blank means no analyst coverage for that year.
Salesforce, which sells the Customer 360 suite of sales, service and marketing software billed largely per licensed user, raised $25bn of debt in March and handed it to an accelerated share repurchase, half of a $50bn authorization approved in February. The arithmetic arrived quickly. Diluted shares fell to 871m in the April quarter from 970m a year earlier. Diluted earnings per share reached $2.42 against $1.59.
It was not free. In late May the company cut its fiscal 2027 operating and free-cash-flow growth guidance to 4-5% from 9-10%, specifically to carry the interest.
The business underneath is accelerating
Strip the financial engineering and Salesforce is still growing faster each quarter: revenue up 8.6% year over year in October, 12.1% in January, then 13.3% in April to $11.13bn. Gross margin held at 76.92%, against 76.96% a year earlier — notable in a year when smaller application vendors handed margin back to the cost of running inference. Operating margin widened to 21.8% from 19.8%.
The AI disclosure is more mixed than the headline suggests. Agentforce and Data 360 annual recurring revenue reached nearly $3.4bn at the May print, with Agentforce alone at $1.2bn, up 205%. But $1.1bn of that pool is Informatica Cloud, bought rather than built, and consensus has group revenue decelerating to about 11% next year as the acquisition anniversaries.
The skeptical case has not gone away. Salesforce is a system of engagement with dominant share and no infrastructure underneath it; Klarna publicly left it for an AI-assembled stack, and rival platforms are now indexing Salesforce and Slack records into their own context graphs, which moves the coordination value to whoever holds the graph rather than the seat.
Against that, the price. Salesforce trades near 5.15x trailing gross profit, down from roughly 7.9x a year ago and about 5.5x in February — the shares rose and the multiple did not, because gross-profit dollars grew 11% while the share count shrank 10%. Forward earnings are 14.8x against 24.1x trailing.
ServiceNow won the demand argument and paid for it in margin
ServiceNow sells the Now Platform, workflow automation for IT service management, security and human resources, anchored on a configuration database that most of the Fortune 500 runs its operations through — which is why rip-and-replace is rare and renewals sit at 98%. Its June-quarter results were the strongest demand evidence the sector produced: revenue up 24% to $3.99bn, current remaining performance obligation of $13.2bn, and annual contract value from AI products past $1bn for the first time, up more than 40% sequentially. Management counted 123 deals above $1m of net-new contract value and said half of new business is no longer seat-based, with AI editions carrying a 30% price uplift.
The profit line contradicts it. Reported gross margin fell to 70.68% from 77.48%, so gross profit grew 13.1% while revenue grew 24%. Operating income fell 55% to $162m. Hyperscaler hosting for AI features and three consolidated acquisitions sit in cost of revenue, and the company guides subscription gross margin to 81% for the year on an adjusted basis, expecting scale to relieve the pressure.
ServiceNow also cut about 1,000 roles, near 3% of staff, targeting flat headcount for 2026 — a vendor whose customers buy seats removing its own. Its CRM line now carries more than $2bn of contract value, but that is 1-2% of a market where Salesforce holds over 19%: an attack from a small base, not displacement.
ServiceNow's multiple went the other way from Salesforce's. It sits near 12.06x trailing gross profit against roughly 10.5x in February — a 25% expansion bought with 13% gross-profit growth — though still far below the 19x it carried a year ago and the 40x-plus forward earnings of its history. Forward earnings are 31.6x.
The money came out of chips, not out of the Fed
The re-rating was not gradual and it was not about rate cuts. On 27 July Nvidia's Jensen Huang told Bloomberg the chip industry must grow roughly tenfold to serve "100 billion agents and billions of robots", extending an argument he had made earlier that markets "got it wrong" on AI's threat to software. Salesforce gained 11.3% and ServiceNow 15.9% across the following week while the broad market fell. On 19 August the pair added 5.1% and 6.5% as the Philadelphia semiconductor index fell 2.2%. Over the month Advanced Micro Devices fell 14% and Broadcom 7%. Meanwhile the 10-year Treasury yield sat at 4.67% and Goldman Sachs was arguing a September rate hike had become unlikely — the debate was tightening, not easing.
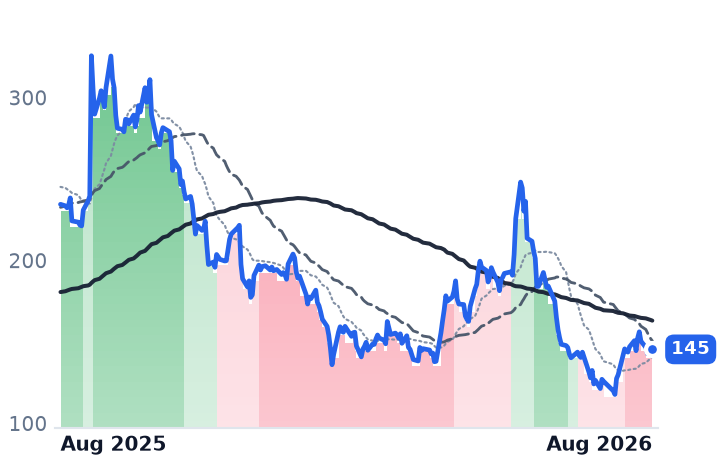
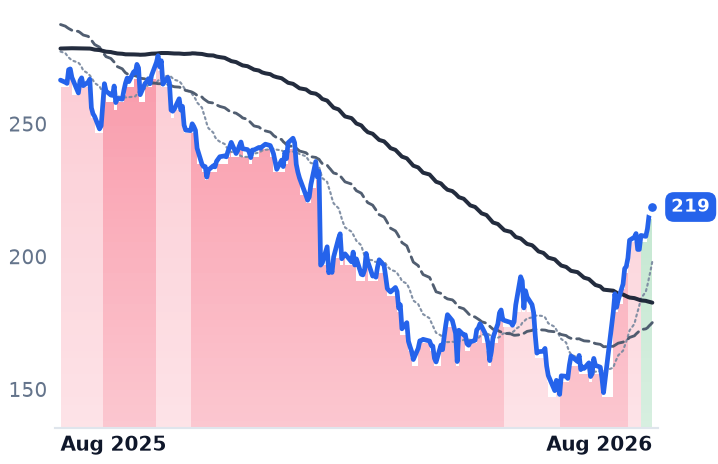
Both names were followers, not leaders. Atlassian roughly doubled over the month, Workday rose on a reported $51bn Silver Lake take-private approach, and SAP and Adobe both outran the pair. Salesforce only crossed into an uptrend on 19 August, its 50-day average rising above its 200-day; ServiceNow did so on 7 August. Both remain below where they traded a year ago — Salesforce by 15%, ServiceNow by 27%.
The cleaner read: at Salesforce the business is doing the work and the multiple has not been paid up; at ServiceNow the contract value is real and the multiple has already moved ahead of the gross profit.
The setup
Where it stands — Both have re-rated on a rotation out of semiconductors, with Salesforce's advance earned in gross-profit dollars and ServiceNow's in multiple. Would confirm — Salesforce revenue growth holding at or above 13% with gross margin near 77% in the July quarter. Would invalidate — ServiceNow's reported gross margin falling further below 70.7% while current remaining performance obligation growth slips under 20%. Watch next — Salesforce reports second-quarter fiscal 2027 results on 26 August 2026, after the close. Valuation — Salesforce 5.15x trailing gross profit against roughly 7.9x a year ago; ServiceNow 12.06x against 10.5x in February.