

Descartes Charges Per Customs Filing, and Its Margin Widened 6 Points as Trade Slowed
Hypothesis Opus 5 · Research Opus 5 · Writing Opus 5 · Prompt v1.5
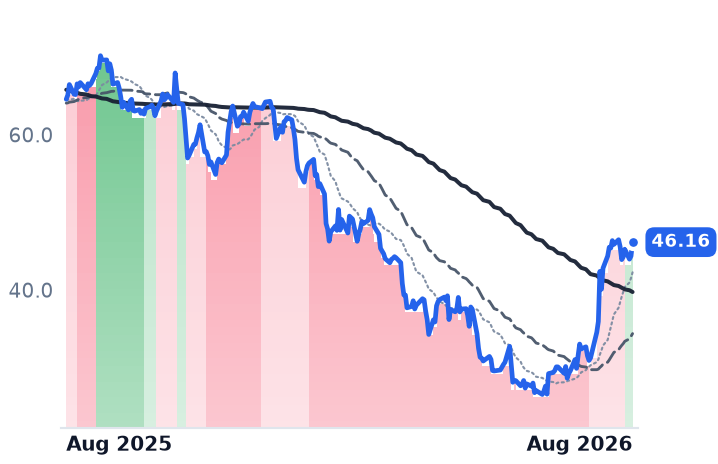
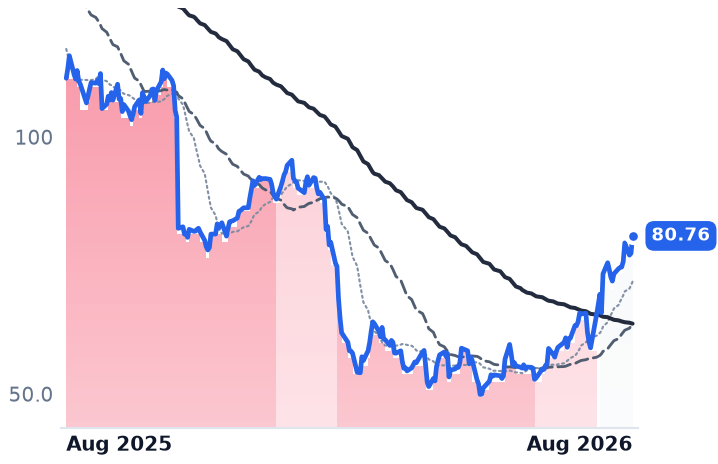
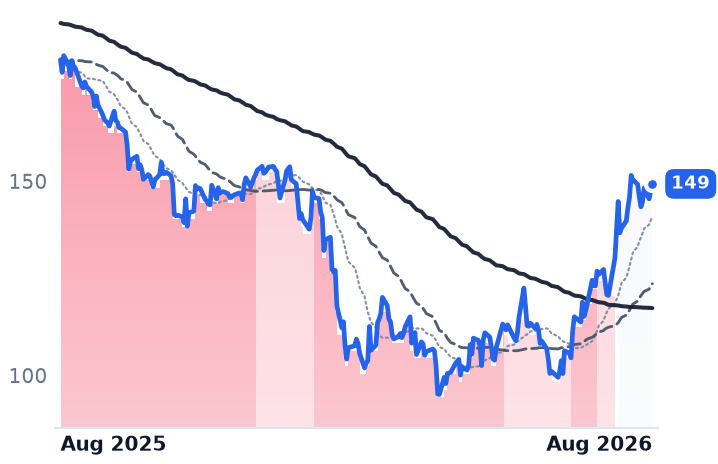
Vertical software stocks jumped in late July when Nvidia's Jensen Huang told investors AI agents would rent software rather than replace it. Descartes Systems Group, which bills per customs declaration and per carrier connection rather than per user, barely moved — up 5.3% over the month against a peer average near 22%, and still down about a fifth over twelve months.
Underneath, the business went the other way. Revenue growth has accelerated four straight quarters, to 15.7%, and operating margin widened to 33.3% from 27.4% a year earlier, with adjusted earnings before interest, taxes, depreciation and amortization at 46% of revenue. The shares now trade at 11.4 times forward gross profit against roughly 14.5 times a year ago.
The counterweight is consensus, which models 9.7% revenue growth this fiscal year — and two tuck-in acquisitions whose contribution the company does not break out.
| Ticker | Company | Segment | Trend · 13mo | 30D | 1Y |
|---|---|---|---|---|---|
| The subject · what this brief is about | |||||
DSGX | The Descartes Systems | Specialized Enterprise Solutions | 🔴 Cont. Bear | +9.3% | −20.9% |
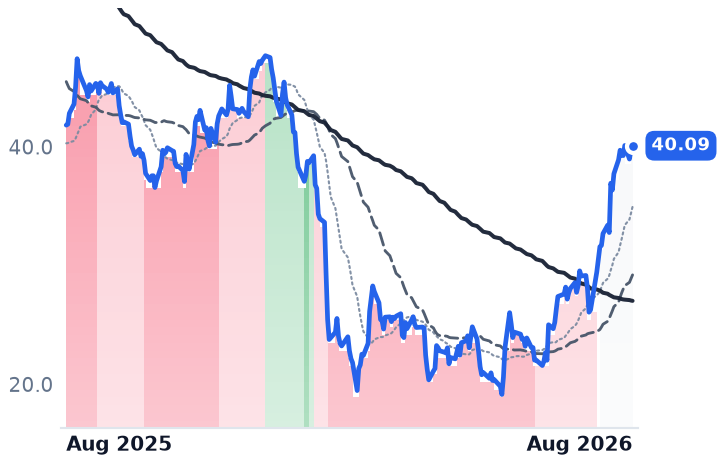
MANH | Manhattan Associates | Specialized Enterprise Solutions | 🔴 Cont. Bear | +29.5% | −2.8% |
BSY | Bentley Systems, Incorporated | Specialized Enterprise Solutions | 🔴 Cont. Bear | +14.9% | −32.7% |
| Compared against · context, not the story | |||||
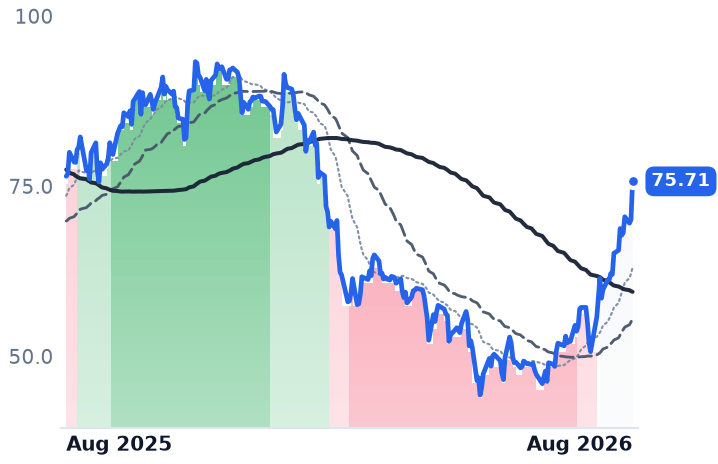
PAYC | Paycom Software | HR & Workforce Management | 🌱 Emerging Bull | +54.0% | −1.5% |
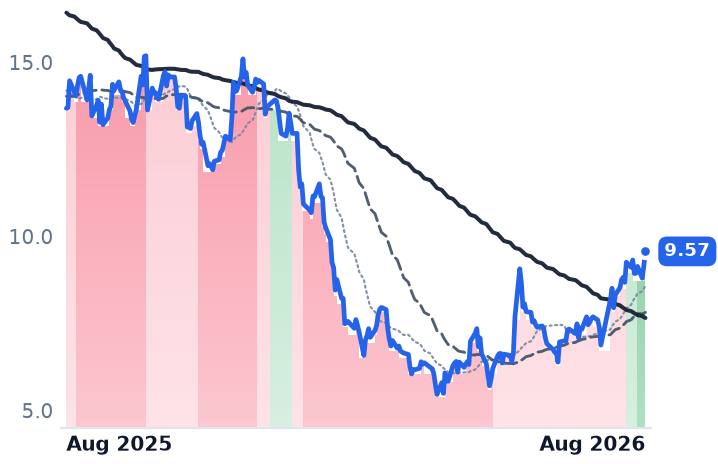
BLKB | Blackbaud | Specialized Enterprise Solutions | 🔴 Cont. Bear | +46.4% | −28.5% |
INTA | Intapp | Specialized Enterprise Solutions | 🔴 Cont. Bear | +42.7% | −4.1% |
WK | Workiva | Security & Compliance | ⚠️ Emerging Bear | +37.8% | −1.0% |
ASAN | Asana | Other | 🌱 Emerging Bull | +29.5% | −30.0% |
SPSC | SPS Commerce | Business Software & Automation | 🔴 Cont. Bear | +30.2% | −27.5% |
NOW | ServiceNow | Specialized Enterprise Solutions | 🔴 Cont. Bear | +24.6% | −28.6% |
APPF | AppFolio | Specialized Enterprise Solutions | 🔴 Cont. Bear | +27.3% | −20.1% |
DOCU | DocuSign | Specialized Enterprise Solutions | 🌱 Emerging Bull | +22.4% | −12.6% |
PCTY | Paylocity | HR & Workforce Management | 🔴 Cont. Bear | +20.5% | −17.6% |
AGYS | Agilysys | Specialized Enterprise Solutions | 🟢 Cont. Bull | +16.0% | +9.6% |
TYL | Tyler Technologies | Financial Services Software | 🔴 Cont. Bear | +15.7% | −38.9% |
BL | BlackLine | Financial Services Software | 🔴 Cont. Bear | +7.1% | −39.8% |
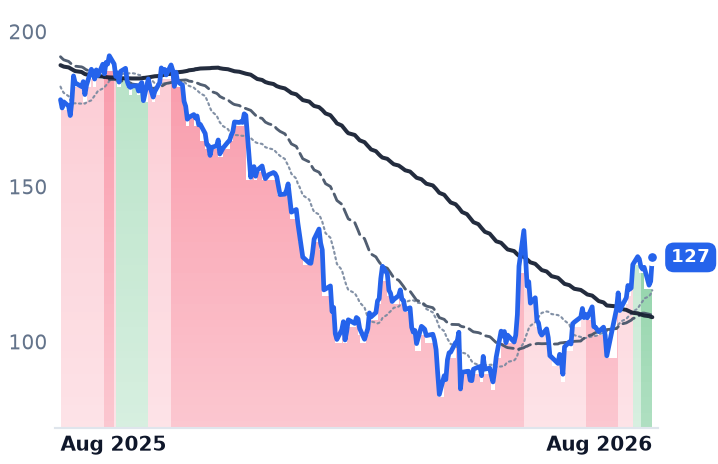
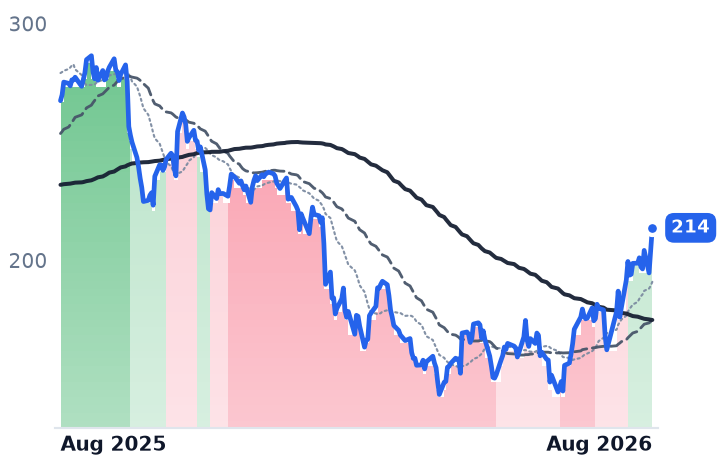
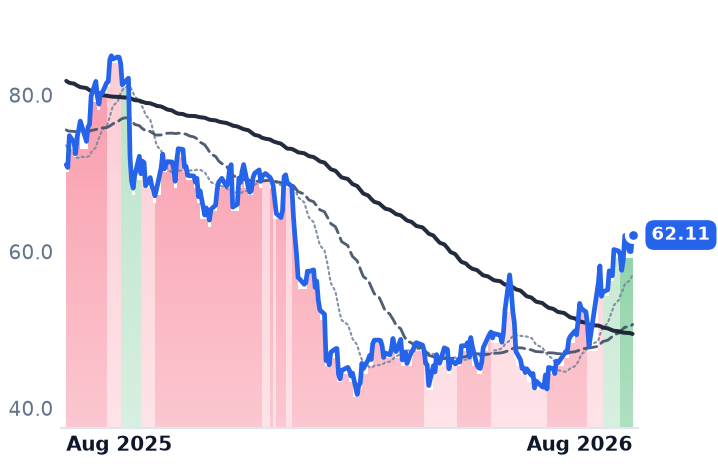
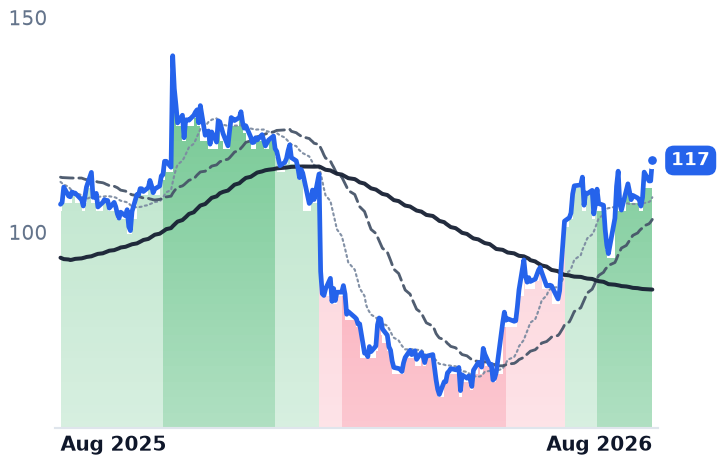
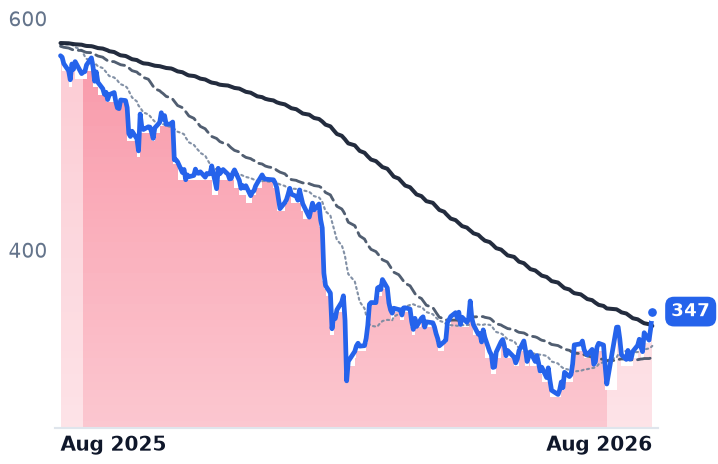
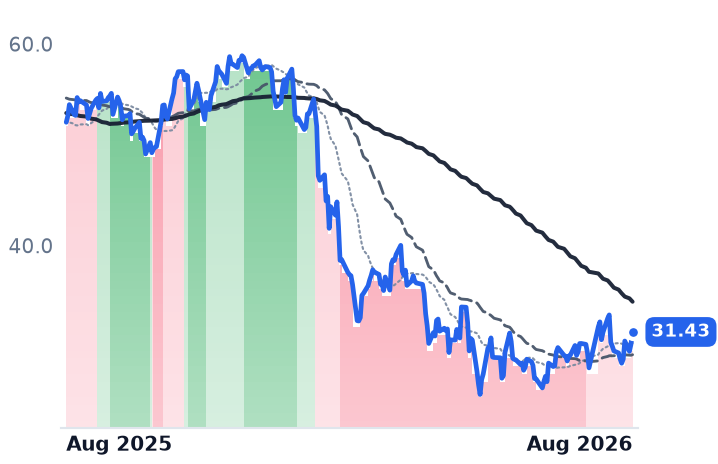
12-month price & trend
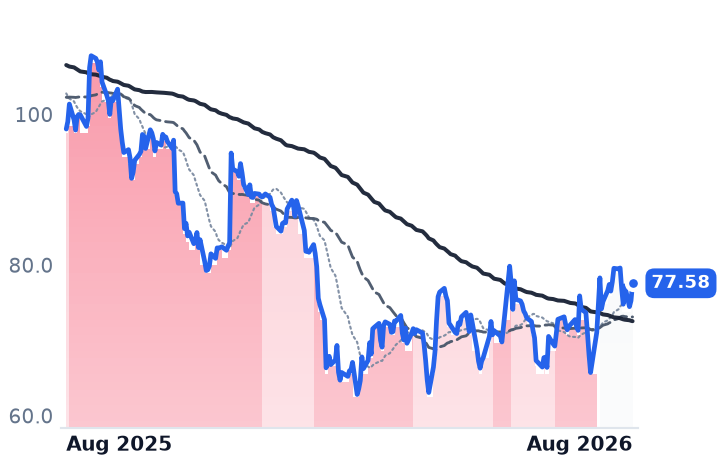
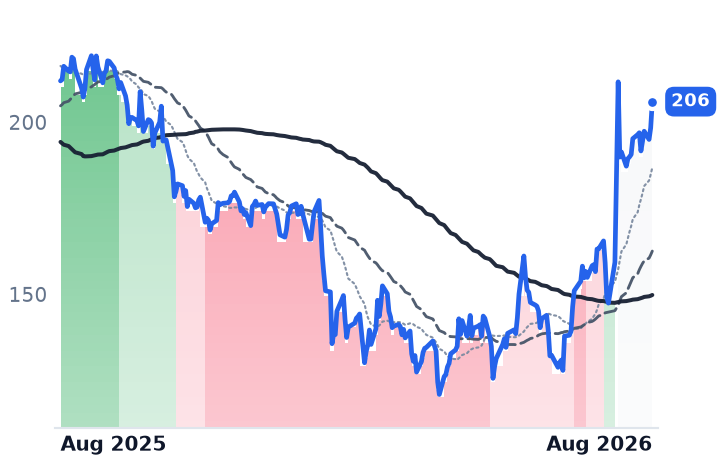
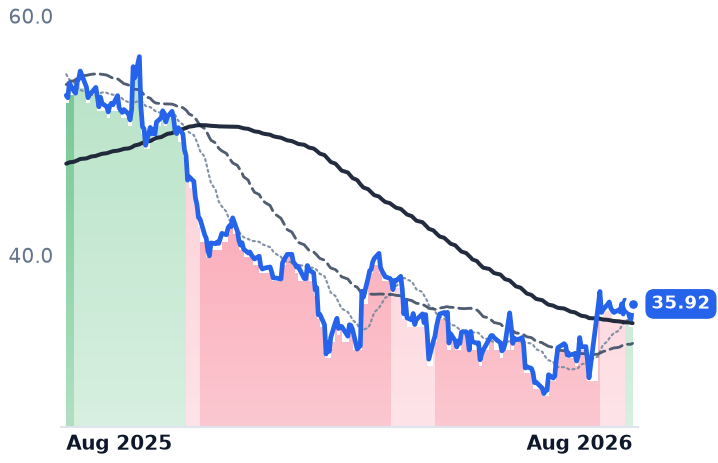
| Ticker | Mkt cap | P/E | P/E fwd | P/S | P/S fwd | P/GP | P/GP fwd | EV/EBITDA | FCF yld |
|---|---|---|---|---|---|---|---|---|---|
DSGX | $6.6B | 37.8x | 33.7x | 8.8x | 8.2x | 12.2x | 11.4x | 19.6x | 4.2% |
MANH | $12.0B | 58.5x | 37.5x | 10.7x | 10.3x | 19.5x | 18.9x | 41.0x | 3.3% |
BSY | $10.5B | 39.0x | 26.1x | 6.6x | 6.2x | 8.0x | 7.5x | 23.1x | 4.7% |
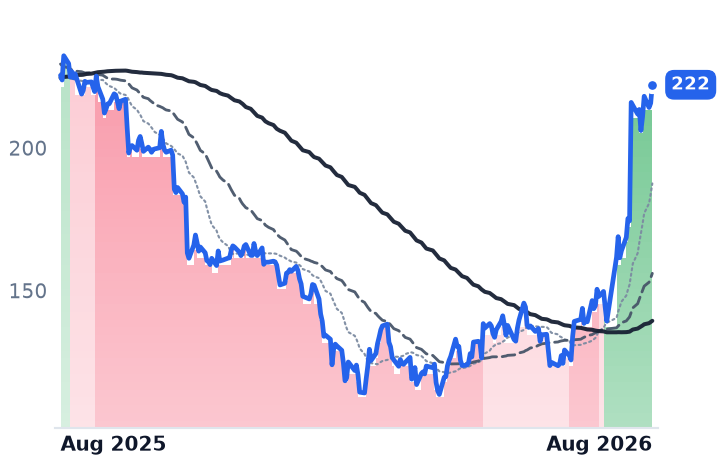
| Ticker | Mkt cap | P/E | P/E fwd | P/S | P/S fwd | P/GP | P/GP fwd | EV/EBITDA | FCF yld |
|---|---|---|---|---|---|---|---|---|---|
PAYC | $10.0B | 23.6x | 18.4x | 4.7x | 4.5x | 5.8x | 5.7x | 12.0x | 7.5% |
BLKB | $1.4B | 9.9x | 5.9x | 1.2x | 1.2x | 2.1x | 2.0x | 8.1x | 20.6% |
INTA | $1.6B | n/m | 17.0x | 2.9x | 2.8x | 3.9x | 3.7x | n/m | 7.5% |
| Ticker | Mkt cap | P/E | P/E fwd | P/S | P/S fwd | P/GP | P/GP fwd | EV/EBITDA | FCF yld |
|---|---|---|---|---|---|---|---|---|---|
WK | $2.7B | 189.9x | 16.3x | 2.9x | 2.6x | 3.6x | 3.2x | 95.9x | 6.5% |
ASAN | $1.9B | n/m | 22.0x | 2.4x | 2.3x | 2.7x | 2.6x | n/m | 5.8% |
SPSC | $2.8B | 36.7x | 15.7x | 3.6x | 3.5x | 5.1x | 5.0x | 14.1x | 7.2% |
| Ticker | Mkt cap | P/E | P/E fwd | P/S | P/S fwd | P/GP | P/GP fwd | EV/EBITDA | FCF yld |
|---|---|---|---|---|---|---|---|---|---|
NOW | $121.7B | 73.1x | 28.9x | 8.3x | 7.5x | 11.0x | 10.0x | 36.6x | 3.8% |
APPF | $7.7B | 48.8x | 31.2x | 7.4x | 6.8x | 11.7x | 10.9x | 36.2x | 3.5% |
DOCU | $11.5B | 38.4x | 13.3x | 3.5x | 3.3x | 4.4x | 4.1x | 17.2x | 9.7% |
| Ticker | Mkt cap | P/E | P/E fwd | P/S | P/S fwd | P/GP | P/GP fwd | EV/EBITDA | FCF yld |
|---|---|---|---|---|---|---|---|---|---|
PCTY | $8.0B | 29.9x | 16.9x | 4.5x | 4.2x | 6.5x | 6.1x | 15.7x | 5.6% |
AGYS | $1.9B | 61.9x | 31.2x | 6.1x | 5.2x | 10.0x | 8.6x | 37.4x | 3.1% |
TYL | $12.8B | 41.0x | 23.9x | 5.3x | 5.1x | 11.3x | 11.0x | 28.0x | 5.6% |
| Ticker | Mkt cap | P/E | P/E fwd | P/S | P/S fwd | P/GP | P/GP fwd | EV/EBITDA | FCF yld |
|---|---|---|---|---|---|---|---|---|---|
BL | $1.6B | 60.9x | 11.0x | 2.2x | 2.1x | 3.0x | 2.8x | 19.3x | 10.3% |
Consensus projections
| Ticker | FY2026E | FY2027E | FY2028E | |
|---|---|---|---|---|
DSGX | Revenue | +15.0% | +9.7% | +11.2% |
| EPS | +16.1% | +23.3% | +16.0% | |
MANH | Revenue | +8.2% | +8.5% | +8.9% |
| EPS | +10.3% | +11.5% | +15.7% | |
BSY | Revenue | +13.9% | +10.3% | +10.7% |
| EPS | +16.6% | +11.7% | +8.6% | |
PAYC | Revenue | +7.7% | +7.1% | +8.4% |
| EPS | +30.8% | +14.6% | +9.8% | |
BLKB | Revenue | +4.4% | +4.4% | +3.8% |
| EPS | +17.8% | +14.3% | −35.4% | |
INTA | Revenue | +14.7% | +14.1% | +14.6% |
| EPS | +36.9% | +25.7% | +26.0% | |
WK | Revenue | +17.9% | +15.6% | +17.5% |
| EPS | +77.9% | +20.3% | +33.4% | |
ASAN | Revenue | +9.2% | +8.9% | +7.9% |
| EPS | −272.8% | +45.4% | +26.1% | |
SPSC | Revenue | +5.1% | +6.4% | +7.5% |
| EPS | +17.9% | +8.9% | +13.3% | |
NOW | Revenue | +22.4% | +18.7% | +18.6% |
| EPS | +17.1% | +23.2% | +21.4% | |
APPF | Revenue | +18.5% | +17.3% | +17.8% |
| EPS | +33.8% | +22.1% | +24.5% | |
DOCU | Revenue | +8.4% | +8.9% | +7.6% |
| EPS | +6.9% | +19.5% | +12.6% | |
PCTY | Revenue | +11.1% | +7.5% | +7.6% |
| EPS | +15.4% | +9.0% | +9.7% | |
AGYS | Revenue | +16.5% | +14.4% | +15.3% |
| EPS | +26.9% | +31.0% | +27.3% | |
TYL | Revenue | +6.7% | +10.1% | +9.3% |
| EPS | +14.7% | +17.5% | +14.3% | |
BL | Revenue | +9.5% | +10.8% | +12.3% |
| EPS | +18.7% | +13.2% | +19.6% |
Forward fiscal years only. Blank means no analyst coverage for that year.
Almost every enterprise software company sells by the head: so many users, so many dollars a month. The Descartes Systems Group, a Waterloo, Ontario business whose network sits between shippers, carriers and customs authorities, sells by the event. A customs declaration lodged, a sanctioned-party screen run, a shipment routed, a carrier message delivered — each is a billable transaction. That makes its revenue line an unusually direct read on the paperwork of cross-border trade, and it is why the debate about artificial intelligence deleting software seats mostly misses it.
Paid by the filing
In the quarter to April, reported 3 June, revenue reached $193.6m, up 15%. Of that, $180.5m — 93% of the total — was the recurring services line; licences contributed $1.6m. Adjusted EBITDA was $89.8m, or 46% of revenue, against 45% a year earlier.
The operating leverage is the part worth pausing on. Operating income rose 40.8% on revenue up 15.7%, lifting operating margin to 33.3% from 27.4%. Revenue growth has now accelerated for four consecutive quarters, from 10.0%. Chief executive Edward Ryan runs a company of about 2,400 people and a $6.7bn market value; it is compounding its earnings roughly two and a half times as fast as its sales.
Fewer parcels, more paperwork
The mechanism behind that acceleration is two-sided, and one side is hostile. The American ban on duty-free treatment for low-value Chinese shipments remains the primary reason trade volumes are falling, and from 1 July the European Union began applying a €3 (about $3.50) customs duty to consignments under €150, pushing Shein and Temu toward local warehousing and consolidated hub shipments. That means fewer, larger filings — fewer billable events.
What offsets it is complexity. A 25% tariff on covered Brazilian products took effect 22 July, and certain Canadian imports face a new 50% duty from 19 August. Every rate change, exclusion and origin rule is content Descartes maintains and sells through its Global Trade Intelligence line, which management named as its main growth theme while describing the underlying freight market as weak. Its defensible position is regulatory data and carrier connectivity rather than execution software — the reason it competes with, rather than inside, WiseTech Global and Manhattan Associates.
The rally it did not join
Software shares surged over three sessions in late July after Huang rejected the AI-disruption thesis, saying customers will rent agents that use software tools and the industry will end up larger. Sixteen comparable application-software names rose an average 21.8% over the following month. Descartes managed 5.3%, and by 19 August sat slightly below its 29 July close.
The multiple reflects that. Descartes trades at 11.4 times forward gross profit — the fitting lens, since gross margins across these businesses range from 53% to 82% — against roughly 14.5 times a year ago. Manhattan Associates, the warehouse-software company whose gap higher powered much of the group's month, is back at 18.9 times forward gross profit, recovering nearly all of its twelve-month de-rating even though its operating income fell 10.2% last quarter on 9.3% revenue growth. The market has paid up for the business with negative operating leverage and left the one with widening margins where it was.
Two things argue for caution. Consensus models Descartes at $807m of revenue this fiscal year, growth of 9.7%, well below the 15.7% just delivered — a deceleration the weak freight backdrop partly justifies. And growth is part-bought: Idelic, a driver-safety platform, closed in April, and Drivin followed in July, with no disclosed split between organic and acquired revenue. Descartes has not held an earnings call since 3 June, so nothing in its share price since reflects new company information.
The setup
Where it stands — A transaction-billed trade-compliance network accelerating into a weak freight market, priced below where it was a year ago. Would confirm — Q2 revenue growth holding above 13% with adjusted EBITDA margin at or above 46%. Would invalidate — Growth falling toward the 9.7% consensus with acquisitions supplying most of it. Watch next — Fiscal second-quarter results, due early September. Valuation — 11.4x forward gross profit and 12.2x trailing, against roughly 14.5x a year ago; 33.7x forward earnings.