

China internet: BABA's pop is one gap, not a cohort re-rating
Prompt v1.0
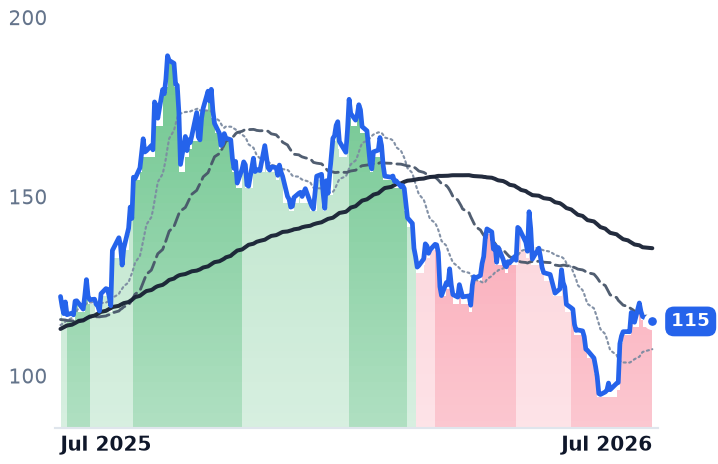
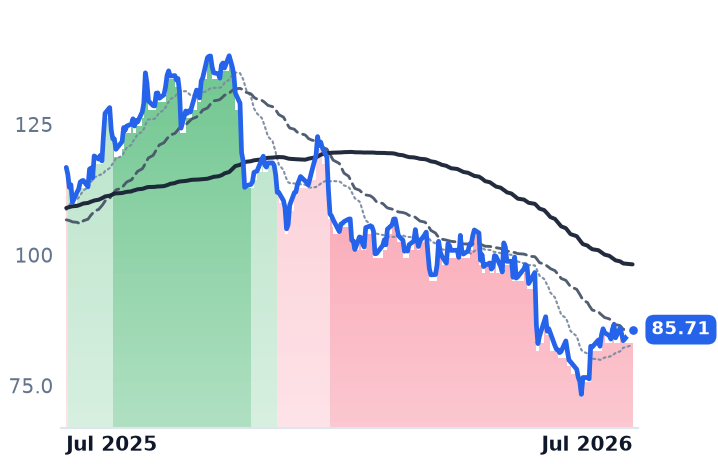
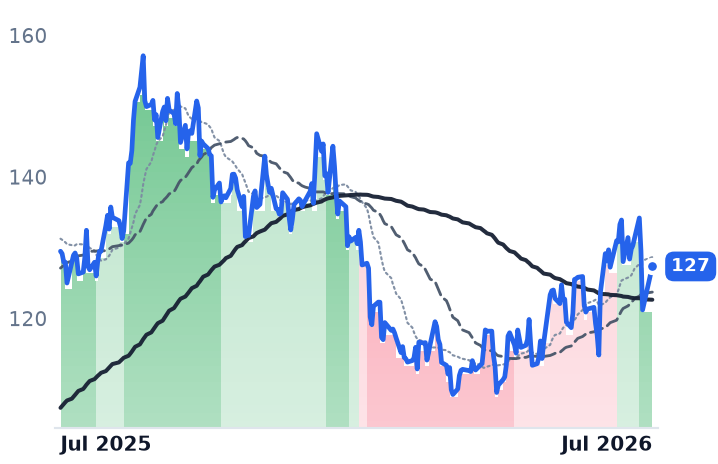
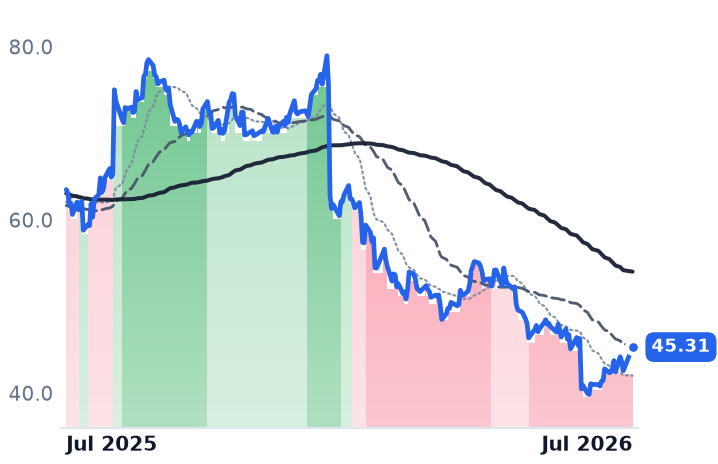
Alibaba's advance is +11.0% over 30 days, not +22%, and effectively all of it came from a single +11.1% catalyst gap on 2026-07-08. BABA has sat in a strongly bearish band continuously since 2026-06-08, PDD has been strongly bearish on all 76 sessions since April, and only NTES exited the bear complex — the cohort-wide re-rating thesis fails on its own data.
| Ticker | Company | Segment | Trend · 13mo | 30D | 1Y |
|---|---|---|---|---|---|
BABA | Alibaba | Online Marketplaces | ⚠️ Emerging Bear | +20.6% | −5.7% |
PDD | PDD | Online Marketplaces | ⚠️ Emerging Bear | +12.0% | −26.6% |
JD | JD.com | Online Marketplaces | 🌱 Emerging Bull | — | — |
BIDU | Baidu | Music & Entertainment Streaming | ⚠️ Emerging Bear | −6.5% | +17.4% |
TCEHY | TCEHY | — | 🔴 Cont. Bear | — | — |
NTES | NetEase | Diversified Gaming & Services | 🟢 Cont. Bull | −1.4% | −1.7% |
TCOM | Trip.com | Online Travel Agencies | ⚠️ Emerging Bear | +13.4% | −28.6% |
KWEB | KWEB | — | 🔴 Cont. Bear | — | — |
LI | Li Auto | Chinese EV Makers | 🔴 Cont. Bear | +11.1% | −54.7% |
XPEV | XPeng | Chinese EV Makers | 🔴 Cont. Bear | −0.7% | −32.9% |
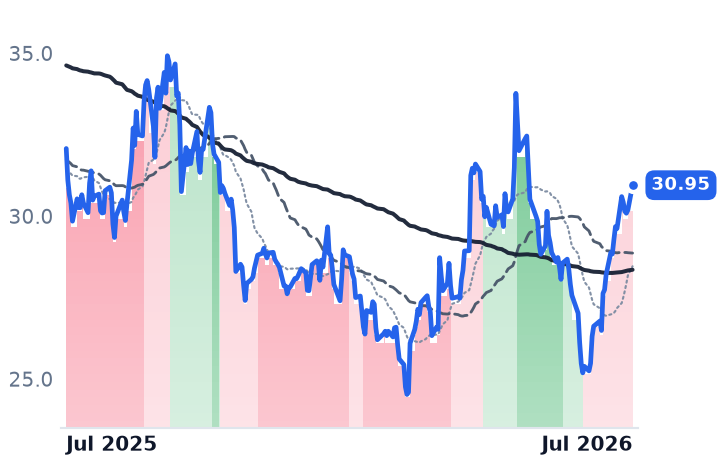
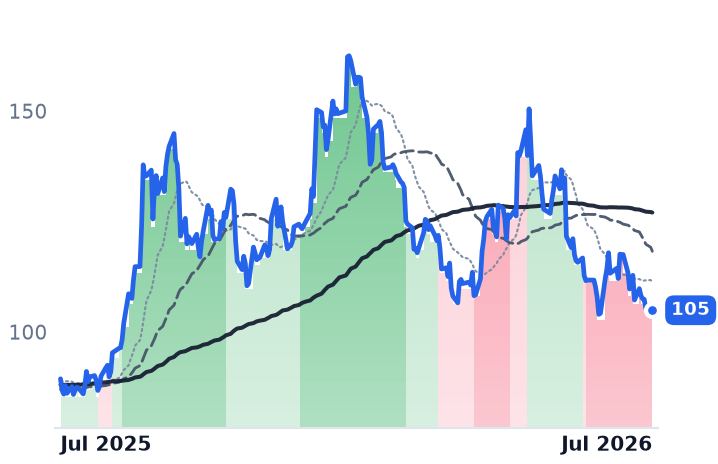
12-month price & trend
| Ticker | Mkt cap | P/E | P/E fwd | P/S | P/S fwd | P/GP | P/GP fwd | EV/EBITDA | FCF yld |
|---|---|---|---|---|---|---|---|---|---|
BABA | $307.9B | 20.7x | — | 2.2x | — | 5.5x | — | 18.6x | -2.7% |
PDD | $136.4B | 9.2x | — | 2.2x | — | 3.8x | — | 7.2x | 11.5% |
JD | $43.9B | 22.0x | — | 0.2x | — | 1.6x | — | 43.9x | 1.6% |
| Ticker | Mkt cap | P/E | P/E fwd | P/S | P/S fwd | P/GP | P/GP fwd | EV/EBITDA | FCF yld |
|---|---|---|---|---|---|---|---|---|---|
BIDU | $46.0B | 69.1x | — | 2.6x | — | 5.8x | — | 22.3x | -4.9% |
TCEHY | — | — | — | — | — | — | — | — | — |
NTES | $72.4B | 14.7x | — | 4.4x | — | 6.9x | — | 11.9x | 9.8% |
| Ticker | Mkt cap | P/E | P/E fwd | P/S | P/S fwd | P/GP | P/GP fwd | EV/EBITDA | FCF yld |
|---|---|---|---|---|---|---|---|---|---|
TCOM | $29.6B | 6.6x | — | 3.1x | — | 3.8x | — | 4.8x | 6.8% |
KWEB | — | — | — | — | — | — | — | — | — |
LI | $18.6B | 118.1x | — | 1.2x | — | 6.4x | — | 47.4x | -0.2% |
| Ticker | Mkt cap | P/E | P/E fwd | P/S | P/S fwd | P/GP | P/GP fwd | EV/EBITDA | FCF yld |
|---|---|---|---|---|---|---|---|---|---|
XPEV | $14.8B | n/m | — | 1.3x | — | 7.1x | — | n/m | 0.0% |
Consensus projections
| Ticker | FY2026E | FY2027E | FY2028E | |
|---|---|---|---|---|
BABA | Revenue | +2.3% | +12.1% | +11.6% |
| EPS | −49.0% | +39.5% | +36.2% | |
PDD | Revenue | +15.9% | +13.2% | +10.1% |
| EPS | +10.4% | +17.8% | +15.1% | |
JD | Revenue | +7.6% | +6.2% | +5.6% |
| EPS | +25.0% | +31.6% | +22.0% | |
BIDU | Revenue | +3.9% | +6.2% | +9.1% |
| EPS | −0.2% | +16.2% | +19.4% | |
NTES | Revenue | +7.0% | +8.2% | +8.0% |
| EPS | +3.6% | +10.3% | +9.1% | |
TCOM | Revenue | +9.6% | +10.9% | +10.5% |
| EPS | −48.1% | +17.1% | +10.5% | |
LI | Revenue | +14.7% | +20.1% | +7.2% |
| EPS | −20.3% | +266.5% | +24.2% | |
XPEV | Revenue | +25.2% | +25.8% | +13.1% |
| EPS | −51.8% | −437.1% | +74.3% |
Forward fiscal years only. Blank means no analyst coverage for that year.
The move is one session, not a drift
Measured cleanly, BABA closed at $116.56 on 2026-07-22, up 11.0% from $104.97 thirty days earlier — while still down 11.5% over 90 days, 32.7% over 180 days and 3.4% over a year. The +22-23% figure only appears if you anchor to the 2026-06-26 panic low of $94.81. And the advance was not gradual: BABA gapped +11.1% on 2026-07-08 from $97.91 to $108.98 on 38.7M shares against a 12.7M average — 3.1x normal. Alibaba's Hong Kong line jumped 12% that day, its biggest move in ten months. The driver was a stack of one-offs: a $600M DOJ non-prosecution deal, ~45% expected June-quarter cloud growth, narrowing instant-commerce losses, and reports Beijing would permit limited Nvidia H200 purchases.
The cohort does not confirm
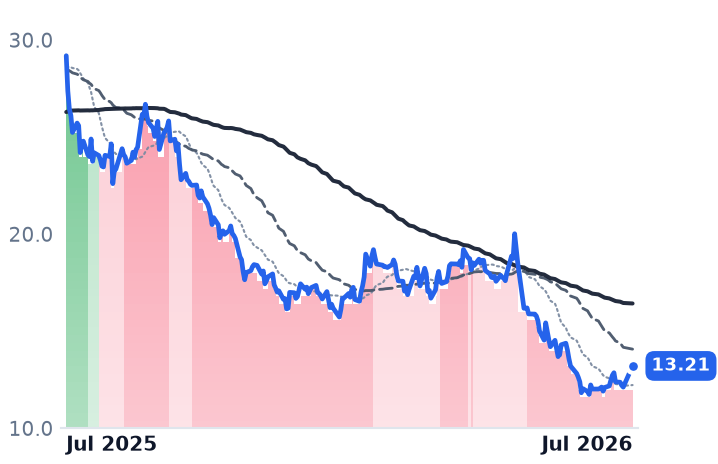
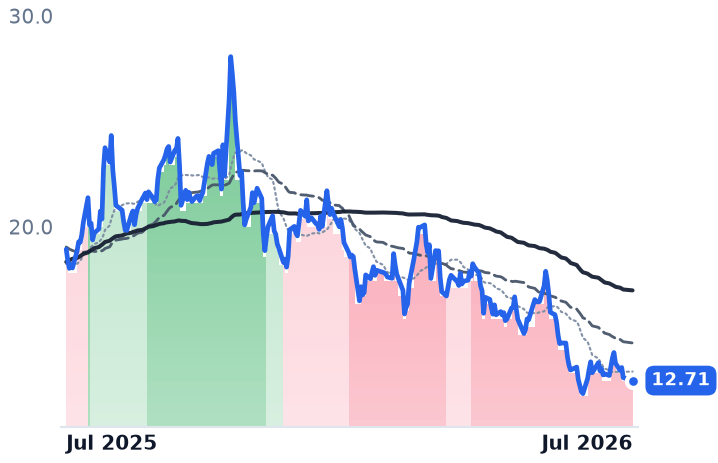
BABA has been in strongly bearish on the moving-average trend signal band continuously since 2026-06-08 — the gap repaired nothing structurally. PDD printed strongly bearish on all 76 sessions from 2026-04-01 to 2026-07-22 with zero transitions, closing $83.59. TCOM is strongly bearish at $42.58, down 8.3% over 30 days and 19.6% over 90. LI ($12.12, -60.7% over a year) and XPEV ($12.85) are strongly bearish too. Only NTES exited — mildly bullish 2026-07-06, strongly bullish 2026-07-20 — yet it is flat over 30 days and fell 6.4% on 2026-07-22 alone. The ETF proxy agrees: KWEB is down 17% year-to-date at $27.18 against a $23.23–$43.37 52-week range. Hong Kong had already logged its worst week in over a year in late June, and by 2026-07-24 the Hang Seng Tech Index was falling again, led lower by Alibaba and Tencent. Note BIDU and JD price data is stale in the local DB after 2026-05-19, so neither confirms nor denies.
The macro leg is a pledge, not a delivery
The PBoC held both benchmark lending rates unchanged on 2026-04-20, and firmer growth plus rising inflation have pushed easing expectations further out. The tariff truce runs only to 2026-11-10, with Washington "not in a rush" to extend. The chip catalyst is thinner than the headline: only a small volume has actually shipped under case-by-case licences, with Beijing approvals expected below 200,000 chips, under half what Chinese buyers requested.
The earnings problem is unresolved
Meituan, Alibaba and JD burned at least RMB145bn on instant-commerce subsidies, pushing JD to its first quarterly loss in nearly four years. PDD's Q1-2026 profit fell 15% and badly missed consensus, after an 11% slide the prior quarter. Alibaba's RMB380bn (~$56bn) AI-capex program lifted commercialised cloud 40% while adjusted EBITA fell 84%. The $170–$180 target gap is real but closing from the wrong side: HSBC cut to $170 and Morgan Stanley to $180 in mid-July on weaker China commerce and higher AI spend. The whole cohort sits 24-46% below 52-week highs — cheapness, not confirmation.