

Blue Owl Capped Withdrawals From Its $36bn Credit Fund at 5% as Investors Asked for 21.9%
Hypothesis Opus 5 · Research Opus 5 · Writing Opus 5 · Prompt v1.6
A year of selling has treated every listed private-capital manager as one trade. The businesses say it is two.
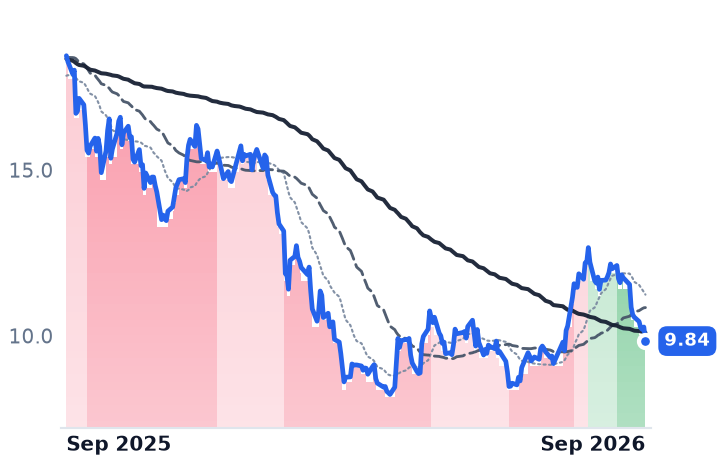
Blue Owl's fee-related earnings rose 9.5% to $392.2m in the June quarter and assets under management reached $319bn, up 12%, while the shares lost nearly half their value. What broke was the channel, not the credit: retail holders of its flagship non-traded business development company asked for 21.9% of shares back in the first quarter and 18.8% in the second, and the fund paid the 5% quarterly cap. The market halved Blue Owl's forward earnings multiple to 11.1x; BlackRock's barely moved, at 19.0x. Apollo, whose profit comes mostly from an annuity spread nobody can redeem, fell 12.3% and still originated $74bn in a quarter. The one genuine impairment at Blue Owl is coverage — a $0.92 dividend against roughly $0.88 of distributable earnings.
| Ticker | Company | Segment | Trend · 13mo | 30D | 1Y |
|---|---|---|---|---|---|
| The subject · what this brief is about | |||||
OWL | Blue Owl Capital | Alternative & Private Capital | 🌱 Emerging Bull | −16.4% | −46.7% |
APO | Apollo Global Management | Alternative & Private Capital | 🌱 Emerging Bull | −5.8% | −11.5% |
| Compared against · context, not the story | |||||
OBDC | Blue Owl Capital | Business Development & Specialty Finance | 🔴 Cont. Bear | −0.5% | −10.6% |
BX | Blackstone | Alternative & Private Capital | 🌱 Emerging Bull | −13.3% | −31.9% |
BLK | BlackRock | Diversified Asset Managers | 🌱 Emerging Bull | −9.2% | −6.5% |
KKR | KKR | Alternative & Private Capital | 🌱 Emerging Bull | −9.9% | −33.1% |
ARES | Ares Management | Alternative & Private Capital | 🌱 Emerging Bull | −11.2% | −29.3% |
CG | The Carlyle | Alternative & Private Capital | 🔴 Cont. Bear | −17.0% | −40.1% |
AMG | Affiliated Managers | Diversified Asset Managers | 🟢 Cont. Bull | −2.0% | +42.6% |
BEN | Franklin Resources | Diversified Asset Managers | 🟢 Cont. Bull | −2.8% | +41.1% |
IVZ | Invesco | Diversified Asset Managers | 🟢 Cont. Bull | −5.2% | +37.1% |
TROW | T. Rowe Price | Diversified Asset Managers | 🟢 Cont. Bull | −8.1% | +0.2% |
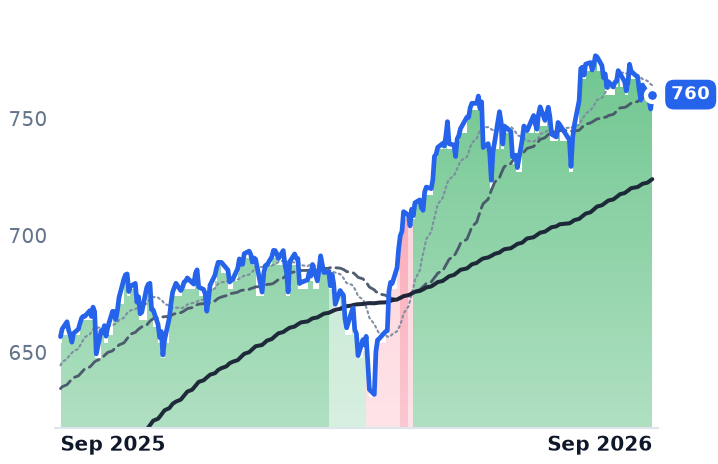
SPY | State Street SPDR S&P 500 ETF Trust | Asset Management | 🟢 Cont. Bull | −1.2% | +15.8% |
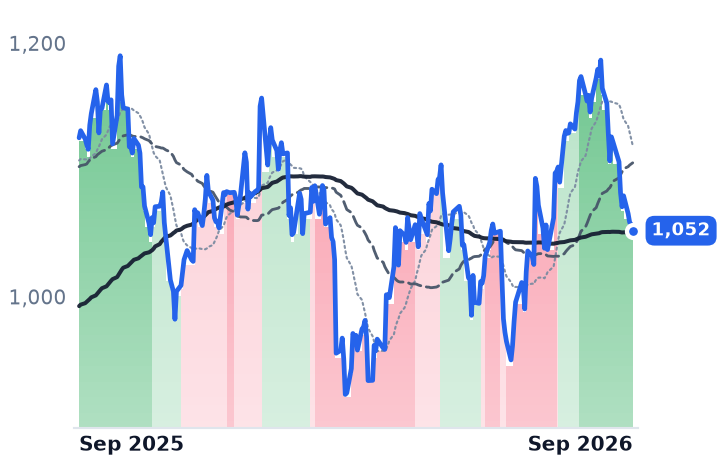
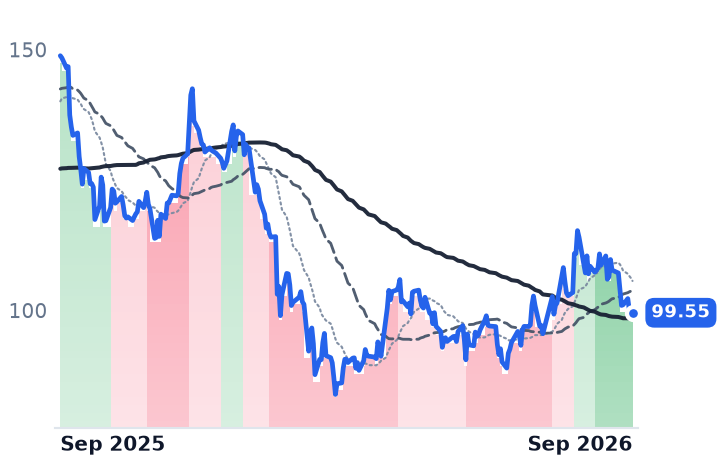
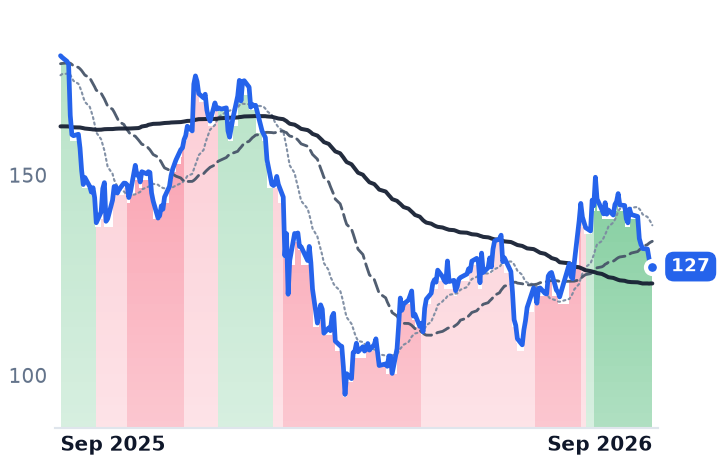
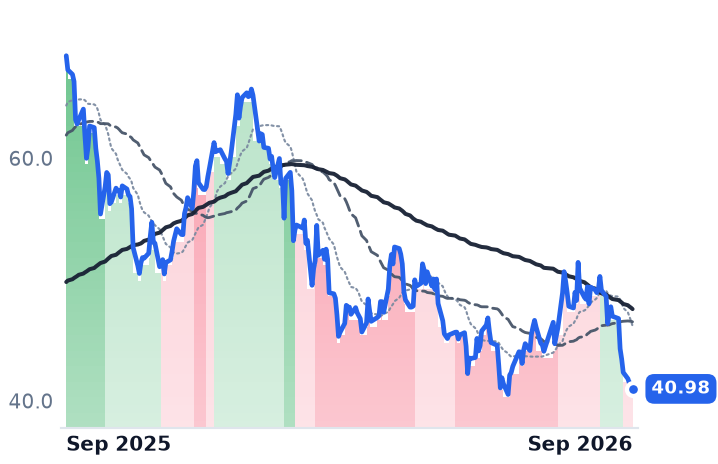
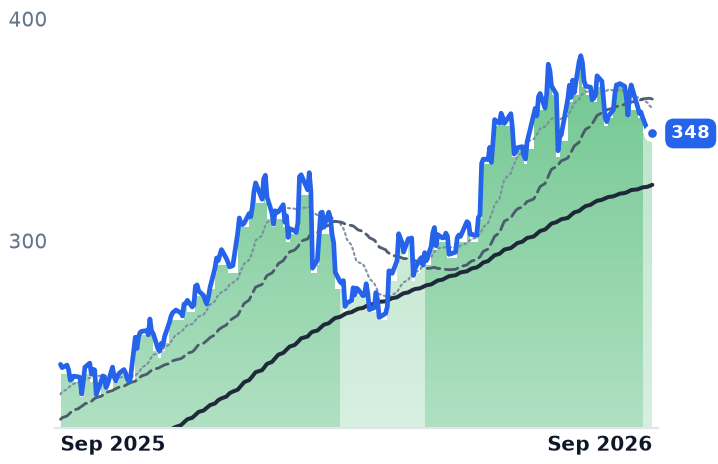
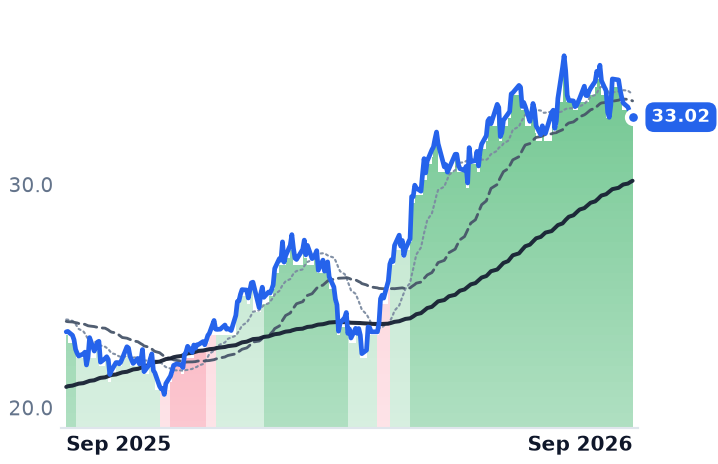
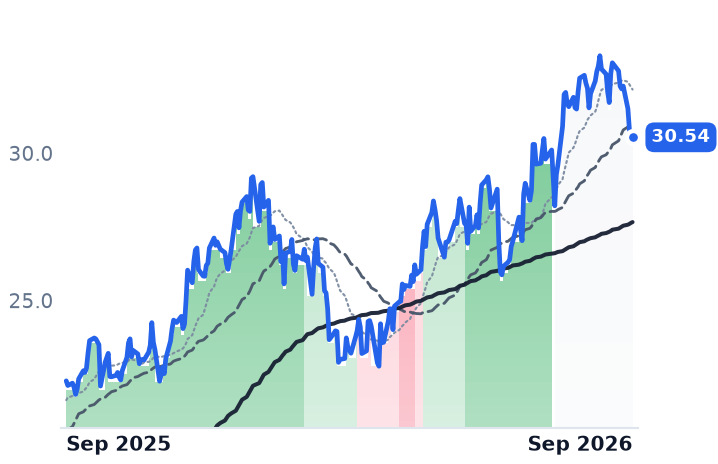
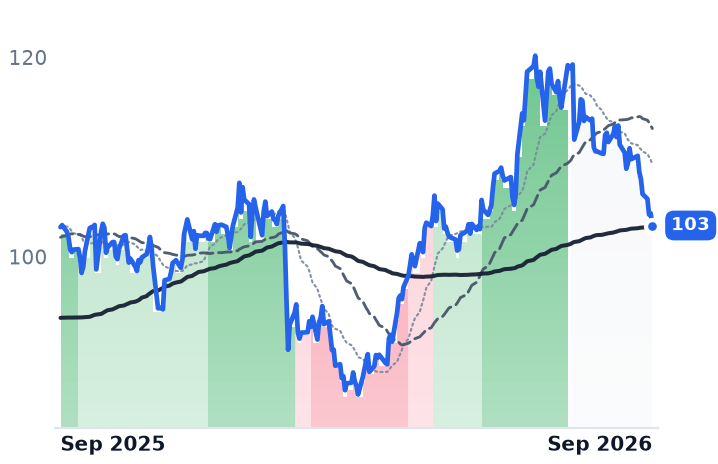
12-month price & trend
| Ticker | Mkt cap | P/E | P/E fwd | P/S | P/S fwd | P/GP | P/GP fwd | EV/EBITDA | FCF yld |
|---|---|---|---|---|---|---|---|---|---|
OWL | $15.4B | 82.8x | 11.1x | 5.1x | 5.4x | 8.4x | 8.9x | 20.4x | 8.6% |
APO | $72.5B | 27.3x | 14.4x | 2.0x | 3.1x | 2.4x | 3.7x | 6.3x | 11.0% |
OBDC | $5.5B | 19.9x | 8.6x | 3.9x | 3.5x | 5.8x | 5.2x | 13.9x | 20.7% |
| Ticker | Mkt cap | P/E | P/E fwd | P/S | P/S fwd | P/GP | P/GP fwd | EV/EBITDA | FCF yld |
|---|---|---|---|---|---|---|---|---|---|
BX | $151.0B | 27.8x | 20.8x | 9.4x | 10.4x | 10.6x | 11.7x | 19.3x | 2.9% |
BLK | $165.8B | 25.2x | 19.0x | 6.1x | 5.7x | 10.9x | 10.2x | 15.9x | 1.4% |
KKR | $88.7B | 29.4x | 14.9x | 4.2x | 8.4x | 18.7x | 37.2x | 13.2x | 2.6% |
| Ticker | Mkt cap | P/E | P/E fwd | P/S | P/S fwd | P/GP | P/GP fwd | EV/EBITDA | FCF yld |
|---|---|---|---|---|---|---|---|---|---|
ARES | $40.7B | 54.1x | 21.1x | 6.4x | 7.5x | 10.2x | 12.0x | 21.6x | 2.1% |
CG | $17.7B | 48.7x | 13.7x | 4.5x | 4.8x | 6.3x | 6.7x | 35.2x | -11.3% |
AMG | $7.8B | 10.4x | 8.5x | 3.3x | 3.3x | 4.8x | 4.9x | 6.7x | 13.8% |
| Ticker | Mkt cap | P/E | P/E fwd | P/S | P/S fwd | P/GP | P/GP fwd | EV/EBITDA | FCF yld |
|---|---|---|---|---|---|---|---|---|---|
BEN | $16.5B | 20.3x | 11.6x | 1.8x | 2.4x | 2.5x | 3.2x | 16.0x | 5.6% |
IVZ | $12.0B | n/m | 10.5x | 1.8x | 2.3x | 3.6x | 4.6x | 16.7x | 13.2% |
TROW | $21.9B | 10.9x | 10.8x | 3.0x | 2.9x | 4.3x | 4.2x | 6.4x | 10.7% |
| Ticker | Mkt cap | P/E | P/E fwd | P/S | P/S fwd | P/GP | P/GP fwd | EV/EBITDA | FCF yld |
|---|---|---|---|---|---|---|---|---|---|
SPY | $773.0B | — | — | — | — | — | — | — | — |
Consensus projections
| Ticker | FY2026E | FY2027E | FY2028E | |
|---|---|---|---|---|
OWL | Revenue | +6.2% | +10.5% | +15.5% |
| EPS | +7.9% | +11.5% | +14.6% | |
APO | Revenue | +26.9% | +16.3% | +14.0% |
| EPS | +10.4% | +22.4% | +15.5% | |
OBDC | Revenue | −15.3% | −1.6% | −0.6% |
| EPS | −15.4% | −0.8% | −6.1% | |
BX | Revenue | +13.8% | +25.4% | +4.6% |
| EPS | +12.3% | +24.2% | +11.7% | |
BLK | Revenue | +21.1% | +11.8% | +13.3% |
| EPS | +19.1% | +14.6% | +14.4% | |
KKR | Revenue | +34.2% | +17.5% | +31.4% |
| EPS | +34.4% | +11.5% | +15.6% | |
ARES | Revenue | +17.8% | +19.4% | +9.7% |
| EPS | +17.1% | +24.2% | +18.1% | |
CG | Revenue | −1.7% | +36.3% | +9.0% |
| EPS | −10.1% | +41.6% | +15.4% | |
AMG | Revenue | +12.0% | +10.6% | +11.2% |
| EPS | +35.0% | +14.5% | +18.4% | |
BEN | Revenue | +6.0% | +6.2% | +6.7% |
| EPS | +28.6% | +6.8% | +7.3% | |
IVZ | Revenue | +10.7% | +6.0% | +2.9% |
| EPS | +29.0% | +14.5% | +12.3% | |
TROW | Revenue | +1.5% | +2.1% | +1.3% |
| EPS | −3.3% | +0.4% | −1.8% |
Forward fiscal years only. Blank means no analyst coverage for that year.
Blue Owl Capital told holders of its largest non-traded credit fund this year that they could have 5% of their money back. They had asked for a great deal more. Investors in Blue Owl Credit Income Corp., a roughly $36bn vehicle that lends to mid-sized American companies, requested withdrawal of 21.9% of shares outstanding in the first quarter and 18.8%, or $3.6bn, in the second; the fund repurchased at its standard cap of 5% of net asset value per quarter, satisfying about 27% of each second-quarter request. Moody's cut the fund's outlook to negative, citing "significantly higher-than-peer redemption requests in the first quarter."
That is the money at issue, and it is not the fund's money. Blue Owl, a New York manager that does direct lending, buys minority stakes in other private-capital firms and writes sale-leasebacks on corporate real estate, earns almost all of its profit as contracted management fees on fee-paying assets. The semi-liquid retail vehicle is where that fee base had been growing fastest. When the retail door jammed, the market repriced the fee stream behind it — and left the fee streams that have no such door alone.
The fee dollar, and what can be taken back
The reported numbers have not yet broken. Second-quarter fee-related earnings were $392.2m, up about 9.5% year on year, on $319.0bn of assets under management, of which $190.6bn pays fees; a further $31.1bn is committed but not yet earning, worth roughly $380m of annual fees once deployed. The firm raised $7.8bn in the quarter and $50.5bn over twelve months. Co-chief executive Marc Lipschultz told investors on the second-quarter call that the redemption wave "has stayed very concentrated in the products where the narrative and the conversations perhaps got most carried away."
What has broken is the trajectory. Reported revenue growth decelerated across four quarters, from 21.2% year on year in the September 2025 quarter to 7.1% in June 2026, and consensus now has full-year revenue up 6.2% with earnings before interest, taxes, depreciation and amortization falling 1.0% before a reacceleration in 2027. The shares fell 48.5% over twelve months. On unchanged 2026 consensus earnings per share of $0.89, the forward multiple halved, from 21.6x to 11.1x.
The second impairment is arithmetic. Distributable earnings ran $0.22 per adjusted share in the quarter against a declared quarterly dividend of $0.23 and an announced annual dividend of $0.92 — a payout near 105% of what the business currently distributes. It is the yield being repriced, more than the fees.
The loans themselves
Blue Owl Capital Corporation, the firm's listed business development company, lends senior secured debt to middle-market borrowers and trades at 0.79x book against a net asset value of $14.26 per share. Its credit is not the problem: non-accruals were 0.8% of the portfolio at fair value in the June quarter, payment-in-kind income — interest taken in more debt rather than cash — fell to 10.7% of total investment income from above 13% two years ago, and net leverage of 1.11x was the lowest in over two years. "Since inception, our platform loss rate has been just 12 bps," chief executive Craig Packer said on the August 6 call. The vehicle bought $35m of its own shares in the quarter. But its base dividend was cut from $0.37 to $0.31, and consensus has its earnings per share falling to $1.30 this year from $1.54.
Apollo, the same asset without the door
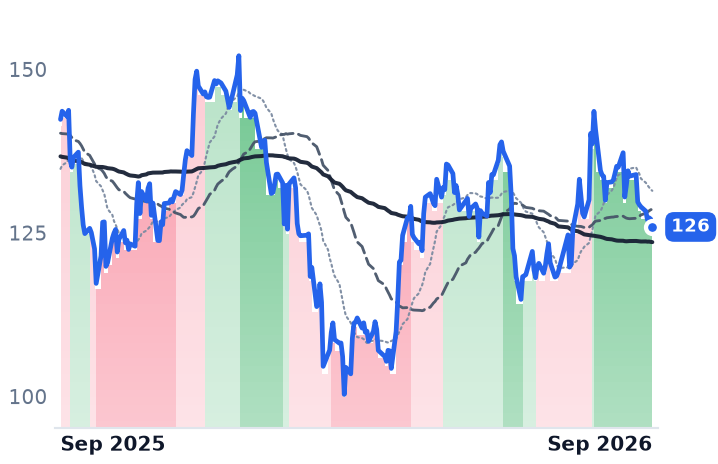
Apollo Global Management fell 12.3% over the same year — a third of Blue Owl's decline — and its forward multiple went from 16.4x to 14.4x. Its June quarter produced $877m of spread-related earnings, the gap between asset yields and what it owes annuity holders at Athene, against $785m of fee-related earnings, up 25%. Athene's net spread widened sequentially to 114 basis points from 97, after compressing over the year as its cost of funds rose to 3.79% from 3.46%. Apollo originated $74bn in the quarter and led a record $35bn financing for Broadcom's artificial-intelligence platform. Apollo and Ares both crossed their 50-day averages above their 200-day in mid-August and have held there since.
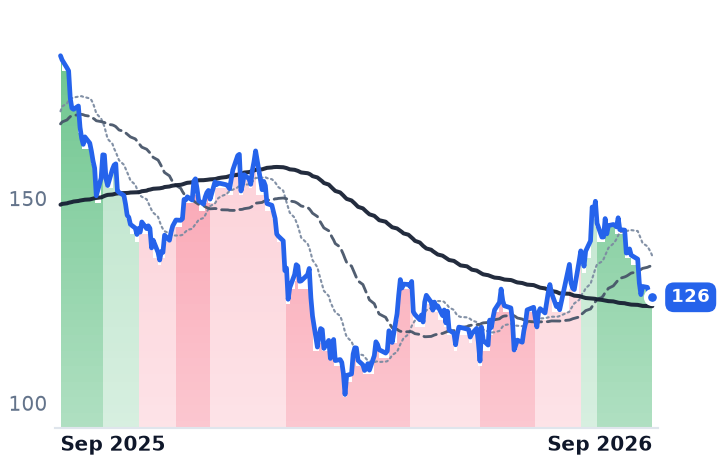
Blackstone, whose own $82bn non-traded credit fund met record redemption requests in full, fell 33.3% and trades at 20.8x forward. The obvious non-movers sat this out entirely: BlackRock slipped 7.5% and its forward multiple went from 20.2x to 19.0x, while Affiliated Managers Group rose 42.6% and Invesco 34.8%, against the S&P 500 exchange-traded fund up 14.8%.
What the business earns and what it does not
The de-rating is private-credit-specific over twelve months, and within private credit it tracks how much of the fee base can be withdrawn on ninety days' notice. Blue Owl's earnings grew; what collapsed was the market's willingness to capitalize fees sourced from individual investors who proved they would run. Apollo, whose largest profit line is a liability retail cannot call, kept most of its multiple while writing the biggest private loan ever made. The past thirty days muddy this: BlackRock fell 8.9% and T. Rowe Price 6.5% alongside the alternatives, which looks like something wider than gating.
For Blue Owl the test is now narrow and dated. Fees on permanent capital do not care what the door does. The dividend does.