

Yelp and Cars.com Held Their Merchant Counts as the Traffic They Resell Shrank
Hypothesis Opus 5 · Research Opus 5 · Writing Opus 5 · Prompt v1.6
A year of selling has treated everything that sits between a consumer and a local merchant as one trade; the latest quarter says it is two. Yelp kept its advertisers — paying locations near 510,000 — but the clicks those advertisers buy fell 5%, and revenue grew 1.4% while operating income shrank. Cars.com kept its 19,343 dealer rooftops and lifted monthly revenue per dealer to a record $2,500, with operating income up 83%.
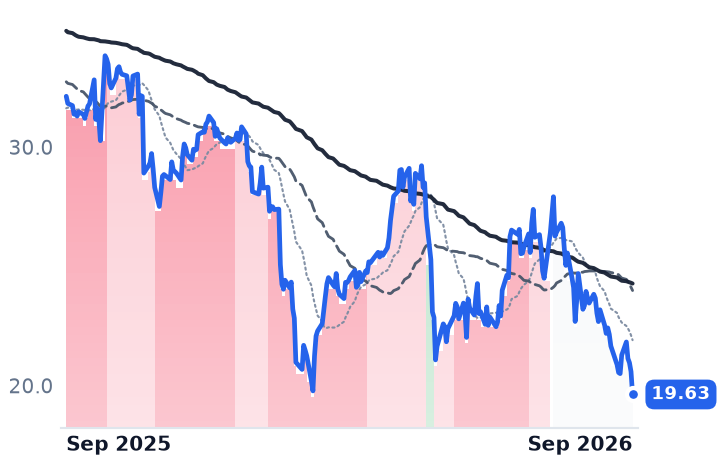
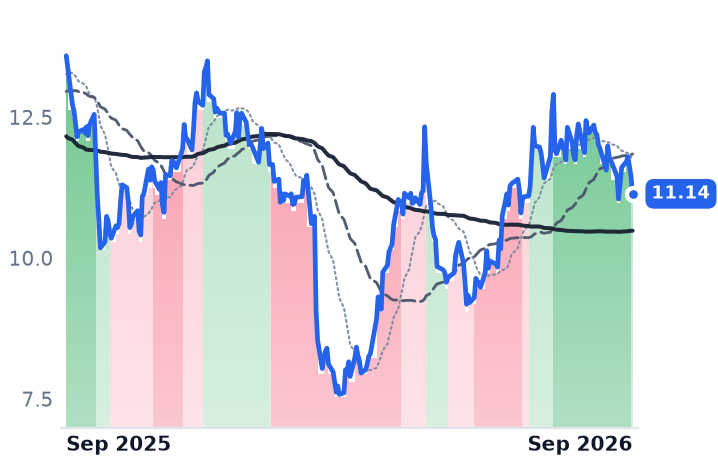
Neither company is losing merchants; both are losing traffic. The market is pricing the difference honestly rather than indiscriminately: Yelp's earnings are falling and its shares set a 52-week low this week, while Cars.com's margin expansion has carried it well off its March bottom.
| Ticker | Company | Segment | Trend · 13mo | 30D | 1Y |
|---|---|---|---|---|---|
| The subject · what this brief is about | |||||
YELP | Yelp | Marketplace & Local Services | 🔴 Cont. Bear | −18.0% | −38.9% |
CARS | Cars.com | Marketplace & Local Services | 🌱 Emerging Bull | −10.5% | −18.0% |
| Compared against · context, not the story | |||||
Z | Zillow | Marketplace & Local Services | 🔴 Cont. Bear | −15.3% | −65.6% |
TRIP | Tripadvisor | Marketplace & Local Services | 🌱 Emerging Bull | −13.5% | −53.0% |
CARG | CarGurus | E-Commerce Platforms | 🟢 Cont. Bull | −7.6% | −8.9% |
SPY | State Street SPDR S&P 500 ETF Trust | Asset Management | 🟢 Cont. Bull | −1.2% | +15.8% |
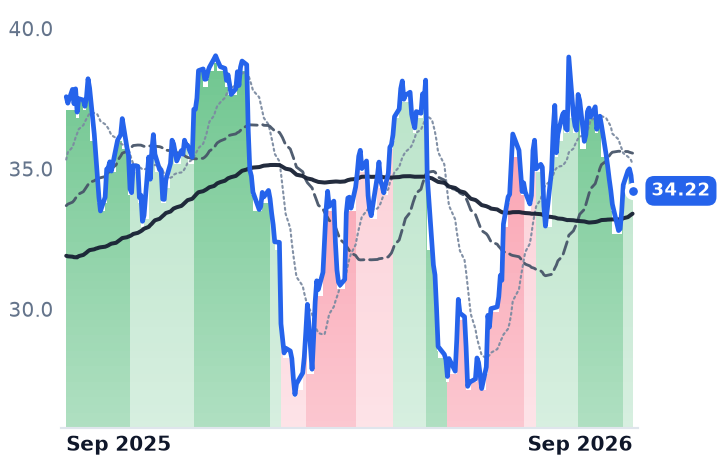
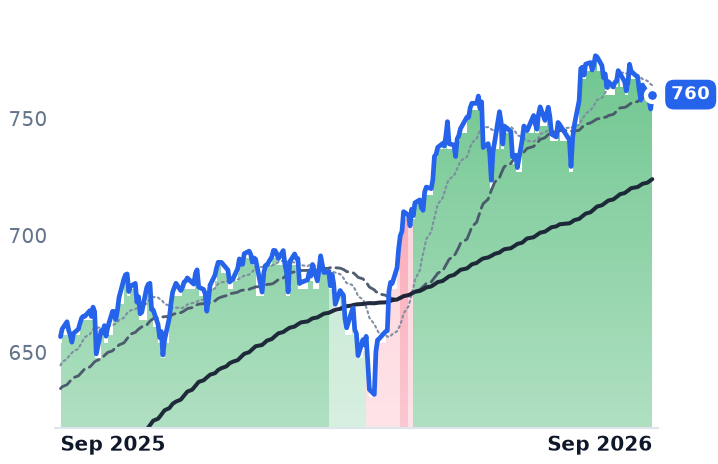
12-month price & trend
| Ticker | Mkt cap | P/E | P/E fwd | P/S | P/S fwd | P/GP | P/GP fwd | EV/EBITDA | FCF yld |
|---|---|---|---|---|---|---|---|---|---|
YELP | $1.1B | 9.3x | 10.9x | 0.7x | 0.7x | 0.8x | 0.8x | 4.2x | 27.5% |
CARS | $622.8M | 19.1x | 5.3x | 0.9x | 0.9x | 1.0x | 1.0x | 6.2x | 24.1% |
Z | $7.2B | 129.4x | 13.3x | 2.6x | 2.4x | 3.5x | 3.3x | 20.6x | 3.6% |
| Ticker | Mkt cap | P/E | P/E fwd | P/S | P/S fwd | P/GP | P/GP fwd | EV/EBITDA | FCF yld |
|---|---|---|---|---|---|---|---|---|---|
TRIP | $1.0B | 221.0x | 10.4x | 0.6x | 0.6x | 0.8x | 0.8x | 5.4x | 12.9% |
CARG | $2.8B | 18.1x | 11.3x | 2.9x | 2.7x | 3.2x | 3.0x | 10.4x | 10.1% |
SPY | $773.0B | — | — | — | — | — | — | — | — |
Consensus projections
| Ticker | FY2026E | FY2027E | FY2028E | |
|---|---|---|---|---|
YELP | Revenue | +0.2% | +3.2% | +2.9% |
| EPS | −17.2% | +40.2% | +8.3% | |
CARS | Revenue | +0.9% | +2.4% | +2.3% |
| EPS | +17.1% | +23.3% | +4.5% | |
Z | Revenue | +14.3% | +11.6% | +11.1% |
| EPS | +34.8% | +28.0% | +28.3% | |
TRIP | Revenue | −15.3% | +0.9% | +3.2% |
| EPS | −37.3% | +26.4% | +39.1% | |
CARG | Revenue | +8.4% | +9.3% | +7.3% |
| EPS | +13.6% | +15.9% | +9.5% |
Forward fiscal years only. Blank means no analyst coverage for that year.
The merchants are still there. Yelp ended its second quarter with roughly 510,000 paying advertising locations, down 1% from a year earlier, and Cars.com carried 19,343 dealer rooftops, essentially unchanged. What left was the traffic. Yelp's ad clicks fell 5%; Cars.com's average monthly unique visitors fell 14%.
That split matters because of how these businesses are actually paid. Yelp — the local-review platform that sells restaurants, plumbers and dentists a monthly advertising budget per business location — prices that budget internally as clicks times cost-per-click. Cars.com, which sells franchised and independent dealerships a monthly marketplace subscription bundled with websites, appraisal software and reputation tools, is paid per rooftop regardless of how many shoppers arrive. In both cases the merchant contract is the revenue and the traffic is the inventory consumed inside it. With zero-click Google searches reaching 68% in early 2026, the erosion turns up in volume long before it turns up in the customer list. What happens next depends on what else is in the bundle.
Yelp: the merchant stayed, the inventory did not
Yelp's revenue grew 1.4% to $375.5m, a fourth straight quarter of roughly flat growth. Underneath it, advertising revenue from restaurants, retail and other categories fell 10% to $102m while Services advertising was flat at $241m. Average cost-per-click rose only 1%, so the price side did not offset the 5% decline in clicks. Operating margin went from 14.4% to 11.6% and operating income fell 18%; gross profit actually shrank slightly, diluted by the $270m Hatch acquisition.
Management's framing is demand, not disintermediation: Yelp expects the difficult environment for local businesses to persist through 2026, and chief financial officer David Schwarzbach attributed better net revenue retention to onboarding, ad targeting and upselling, changes he called structural. The buyback that removed 15% of diluted shares over the past year has been paused to repay the revolver drawn for Hatch, with a resumption flagged for 2027.
The shares closed at $19.63 on 18 September, their lowest in a year. At 9.3x trailing earnings against roughly 14–15x a year ago, the de-rating is real — but the forward multiple of 10.9x sits above the trailing one, which is arithmetic for falling profits: consensus has 2026 earnings at $1.80 a share against $2.24 last year.
Cars.com: same traffic loss, opposite result
Cars.com reported the same erosion and the reverse outcome. Traffic fell 12% and unique visitors 14%, yet dealer revenue rose 3% and monthly average revenue per dealer hit a record $2,500. "Marketplace revenue grew over 7% year-over-year in Q2," chief executive Tobias Hartmann told investors on 6 August. "Outside of 2021's pandemic-related recovery, this is the fastest marketplace growth rate in our public company history." Operating income rose 83% to $27.9m on a top line up less than a percent, as the 2017 customer list finished amortizing and operating expenses fell.
The bundle is doing the work, unevenly. Premium Plus is the fastest-growing tier, but AccuTrade appraisal subscribers were flat-to-down sequentially and Dealer Inspire website units declined, with a new general manager given two to three quarters to stabilize them. Automaker and national advertising — the part not under subscription — fell 18% to $13.6m. Net debt of about $417m against guided adjusted profits implies roughly two times leverage, and first-half free cash flow of $43.5m did not cover $57m of buybacks.
What the market is actually marking down
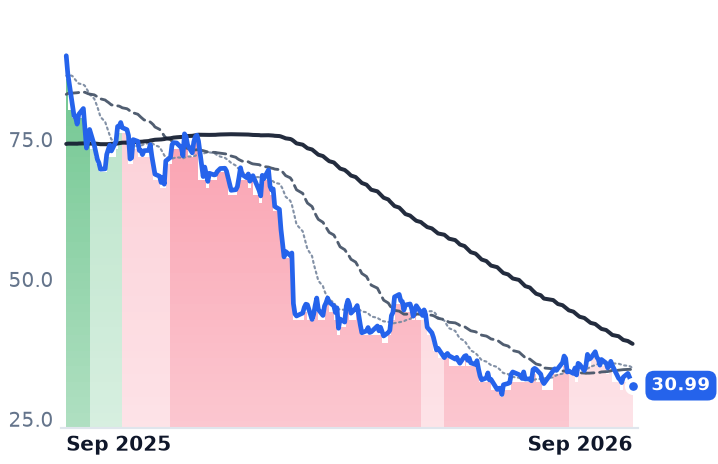
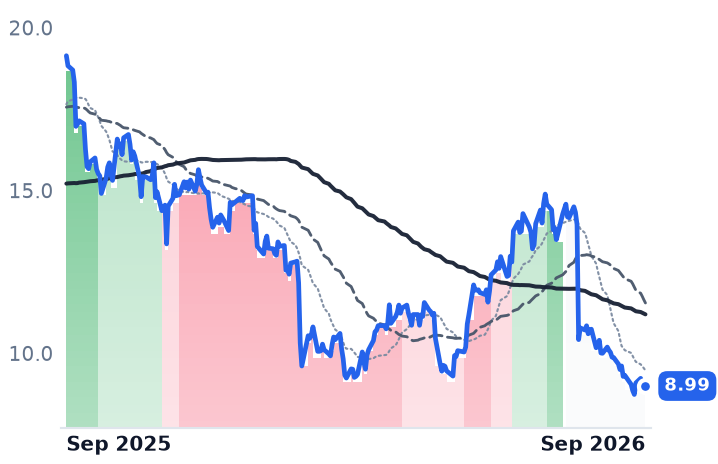
It is not contracted per-merchant revenue. Both companies held their merchant counts and Cars.com raised its price. What is being marked down is monetizable volume, and the pass-through differs by meter: Yelp's subscription is consumed in clicks, so a click shortfall becomes a revenue shortfall within the quarter, while Cars.com's rooftop contract absorbs a traffic decline as long as leads still convert. Cars.com is up 41% from its March low; Yelp is at a 52-week low, and the eight-name local-marketplace group fell about 10% in thirty days against a flat market, with a September rate rise and a 10-year Treasury yield near 5% compressing every low-growth small cap at once. CarGurus, the nearest auto-marketplace comparison, is down under 7% over twelve months — this is not one uniform verdict on referral traffic.
Yelp is now paid by the thing eroding it. In July it licensed 330 million reviews to OpenAI for surfacing inside ChatGPT, and Schwarzbach told investors on 6 August: "We are targeting an annual run rate of $250 million in Other revenue by the end of 2028." That was the fastest-growing line Yelp sold last quarter. It is also still the smallest.