

Crude names aren't de-rating — they're bleeding out a war premium
Prompt v1.0
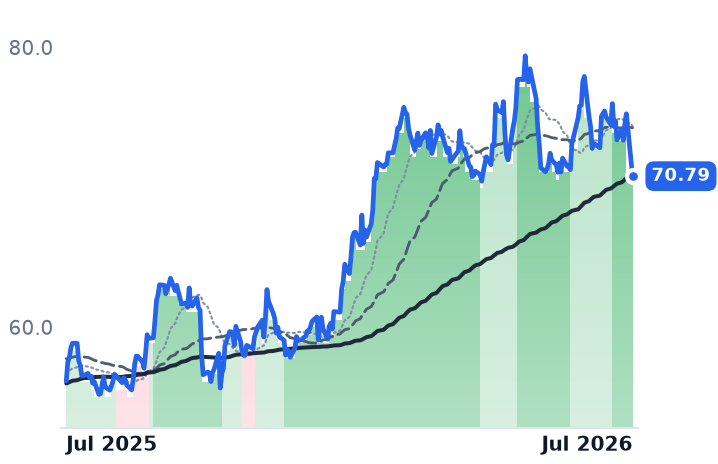
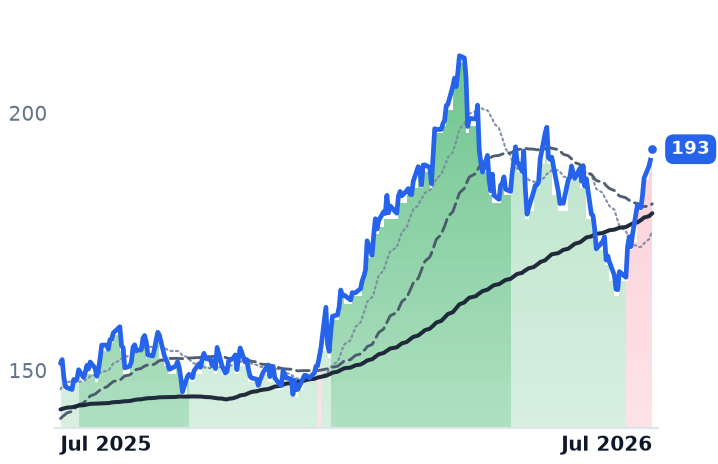
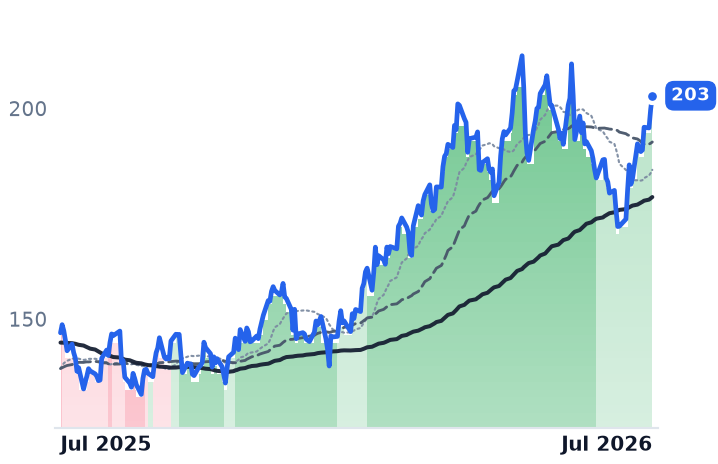
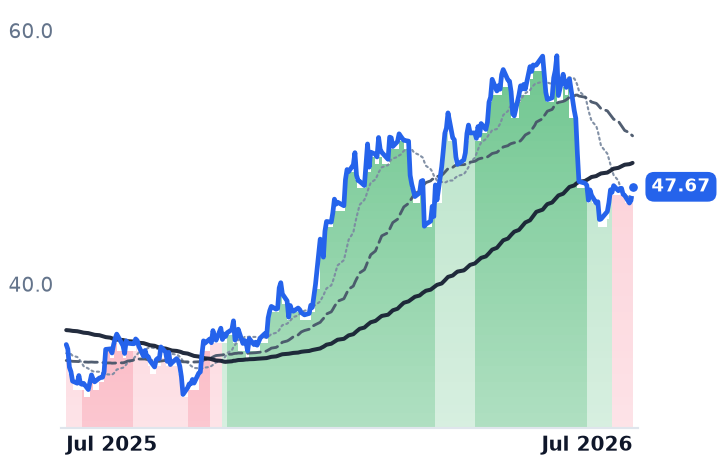
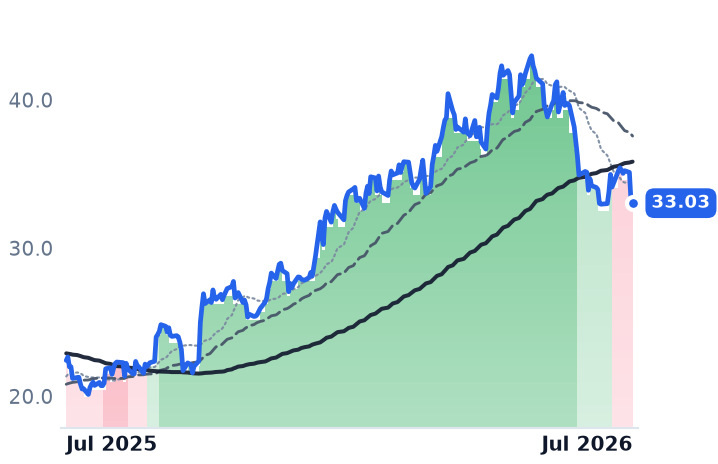
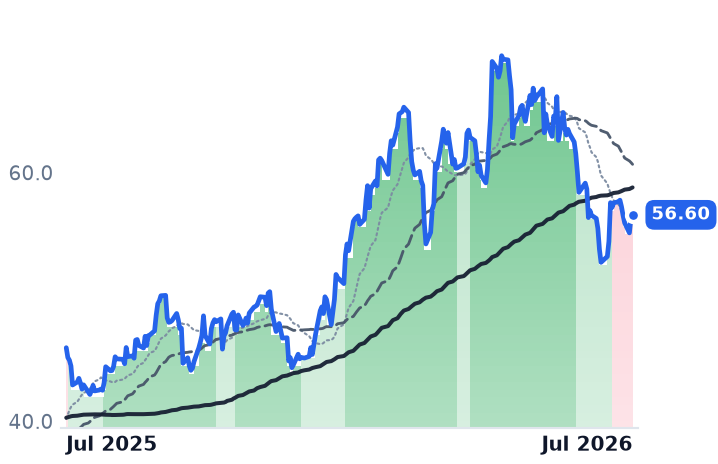
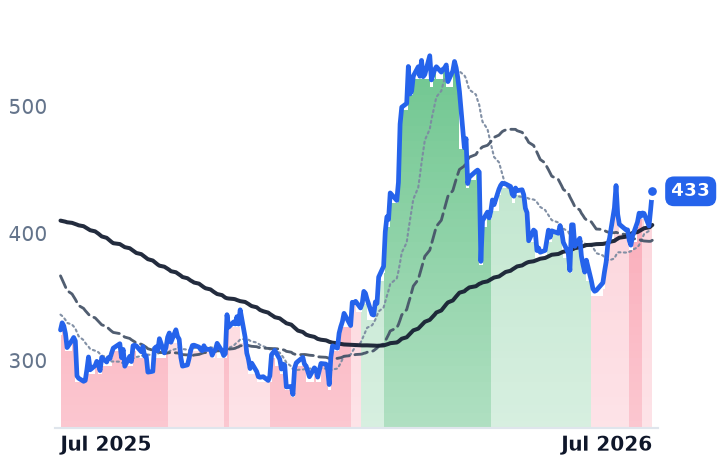
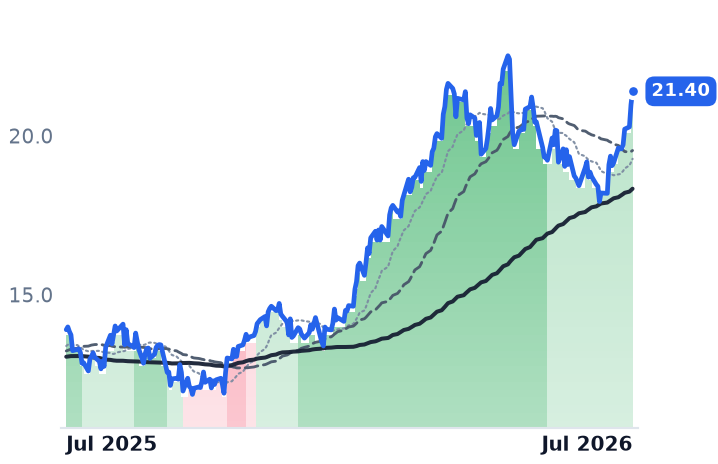
The oil-levered cohort didn't roll over: SHEL, CVX, FANG, ARX.TO and the Permian names are all up double digits or holding bull bands over 30 days, and the "five-session weakness" is one session — 27 July, when Brent fell 8.7% on US-Iran talks. The confirmed 90-day breakdown sits in oilfield services and Appalachian gas, while the forecast surplus that would actually de-rate crude producers is still ahead of them.
| Ticker | Company | Segment | Trend · 13mo | 30D | 1Y |
|---|---|---|---|---|---|
SOC | Sable Offshore | Oil & Gas Production | 🔴 Cont. Bear | −37.2% | −85.3% |
DVN | Devon Energy | Diversified Onshore & Conventional | 🟢 Cont. Bull | +2.8% | +29.0% |
SHEL | Shell | Upstream Exploration & Production | 🟢 Cont. Bull | +12.3% | +23.1% |
ARX.TO | ARC Resources | — | 🌱 Emerging Bull | +8.7% | +21.6% |
WMB | The Williams Companies | Natural Gas Pipelines & Transmission | 🟢 Cont. Bull | −5.7% | +26.1% |
CVX | Chevron | Upstream Exploration & Production | 🟢 Cont. Bull | +14.5% | +27.5% |
FANG | Diamondback Energy | Permian Basin Focused | 🟢 Cont. Bull | +12.5% | +38.4% |
SLB | SLB | Well Services & Stimulation | 🟢 Cont. Bull | +2.8% | +35.3% |
HAL | Halliburton | Well Services & Stimulation | 🟢 Cont. Bull | −3.1% | +47.3% |
BKR | Baker Hughes | Well Services & Stimulation | 🟢 Cont. Bull | +0.5% | +23.3% |
TPL | Texas Pacific Land | Royalty & Mineral Interests | 🌱 Emerging Bull | +3.1% | +33.7% |
PR | Permian Resources | Permian Basin Focused | 🟢 Cont. Bull | +15.9% | +54.0% |
SM | SM Energy | Permian Basin Focused | 🌱 Emerging Bull | +27.0% | +18.7% |
MTDR | Matador Resources | Permian Basin Focused | 🌱 Emerging Bull | +10.5% | +7.9% |
EQT | EQT | Appalachian Shale Gas | ⚠️ Emerging Bear | +0.0% | +1.1% |
AR | Antero Resources | Appalachian Shale Gas | 🔴 Cont. Bear | −1.7% | +3.7% |
12-month price & trend
| Ticker | Mkt cap | P/E | P/E fwd | P/S | P/S fwd | P/GP | P/GP fwd | EV/EBITDA | FCF yld |
|---|---|---|---|---|---|---|---|---|---|
SOC | $1.5B | n/m | 11.5x | — | 1.6x | — | — | n/m | -42.0% |
DVN | $30.8B | 13.6x | 9.2x | 1.8x | 1.3x | 8.1x | 5.8x | 4.9x | 8.7% |
SHEL | $240.6B | 12.9x | 8.8x | 0.9x | 0.8x | 5.4x | 4.6x | 5.0x | 7.9% |
| Ticker | Mkt cap | P/E | P/E fwd | P/S | P/S fwd | P/GP | P/GP fwd | EV/EBITDA | FCF yld |
|---|---|---|---|---|---|---|---|---|---|
ARX.TO | — | — | — | — | — | — | — | — | — |
WMB | $90.1B | 29.2x | 30.4x | 7.4x | 7.3x | 10.0x | 10.0x | 16.2x | -0.2% |
CVX | $380.5B | 34.4x | 14.2x | 2.0x | 1.7x | 8.0x | 6.6x | 10.4x | 3.5% |
| Ticker | Mkt cap | P/E | P/E fwd | P/S | P/S fwd | P/GP | P/GP fwd | EV/EBITDA | FCF yld |
|---|---|---|---|---|---|---|---|---|---|
FANG | $57.3B | 142.8x | 10.8x | 3.8x | 3.3x | 9.0x | 7.8x | 13.1x | 2.8% |
SLB | $82.8B | 25.1x | 21.3x | 2.3x | 2.3x | 13.3x | 13.1x | 13.0x | 5.6% |
HAL | $34.9B | 22.7x | 17.9x | 1.6x | 1.6x | 10.3x | 10.3x | 10.7x | 4.8% |
| Ticker | Mkt cap | P/E | P/E fwd | P/S | P/S fwd | P/GP | P/GP fwd | EV/EBITDA | FCF yld |
|---|---|---|---|---|---|---|---|---|---|
BKR | $63.6B | 20.4x | 26.8x | 2.3x | 2.3x | 9.7x | 9.8x | 14.3x | 3.6% |
TPL | $26.6B | 52.7x | 42.3x | 31.7x | 26.6x | 32.4x | 27.2x | 38.1x | 1.9% |
PR | $14.9B | 26.1x | 12.4x | 2.9x | 2.4x | 8.2x | 6.7x | 5.6x | 2.3% |
| Ticker | Mkt cap | P/E | P/E fwd | P/S | P/S fwd | P/GP | P/GP fwd | EV/EBITDA | FCF yld |
|---|---|---|---|---|---|---|---|---|---|
SM | $3.7B | 28.7x | 4.6x | 1.0x | 0.5x | 2.2x | 1.2x | 4.9x | -6.0% |
MTDR | $7.5B | 15.4x | 8.3x | 2.1x | 1.9x | 2.3x | 2.1x | 5.2x | 0.8% |
EQT | $33.8B | 11.9x | 12.8x | 3.6x | 3.6x | 5.3x | 5.2x | 6.4x | 11.1% |
| Ticker | Mkt cap | P/E | P/E fwd | P/S | P/S fwd | P/GP | P/GP fwd | EV/EBITDA | FCF yld |
|---|---|---|---|---|---|---|---|---|---|
AR | $11.6B | 10.8x | 9.0x | 2.0x | 1.7x | 4.4x | 3.8x | 6.8x | 12.1% |
Consensus projections
| Ticker | FY2026E | FY2027E | FY2028E | |
|---|---|---|---|---|
SOC | Revenue | +10057.7% | +30.8% | +1.7% |
| EPS | −130.4% | +102.0% | +15.0% | |
DVN | Revenue | +42.1% | +10.1% | +4.9% |
| EPS | +35.0% | −1.0% | +8.2% | |
SHEL | Revenue | +17.3% | −6.5% | −0.1% |
| EPS | +52.5% | −7.0% | +5.7% | |
WMB | Revenue | +7.4% | +9.9% | +12.7% |
| EPS | +14.1% | +4.5% | +18.3% | |
CVX | Revenue | +20.5% | −10.9% | −0.3% |
| EPS | +88.5% | −11.2% | +2.8% | |
FANG | Revenue | +16.0% | −5.6% | +1.3% |
| EPS | +51.1% | −10.1% | +5.2% | |
SLB | Revenue | +2.6% | +7.6% | +7.1% |
| EPS | −9.6% | +28.0% | +15.3% | |
HAL | Revenue | +0.9% | +5.9% | +4.4% |
| EPS | +2.6% | +22.7% | +15.5% | |
BKR | Revenue | +0.4% | +7.9% | +3.5% |
| EPS | −2.8% | +19.8% | +13.6% | |
TPL | Revenue | +26.0% | +11.3% | +14.5% |
| EPS | +30.3% | +11.2% | −100.0% | |
PR | Revenue | +19.0% | +4.4% | +1.3% |
| EPS | +44.8% | +23.1% | +2.6% | |
SM | Revenue | +119.1% | +3.2% | +1.1% |
| EPS | +30.2% | +5.8% | +4.3% | |
MTDR | Revenue | +10.3% | +9.6% | +1.3% |
| EPS | +29.6% | +14.9% | −0.5% | |
EQT | Revenue | +12.9% | −0.5% | +9.5% |
| EPS | +43.8% | −5.2% | +31.6% | |
AR | Revenue | +30.3% | +0.3% | +7.0% |
| EPS | +130.9% | +1.8% | +26.1% |
Forward fiscal years only. Blank means no analyst coverage for that year.
The cohort went up, not down
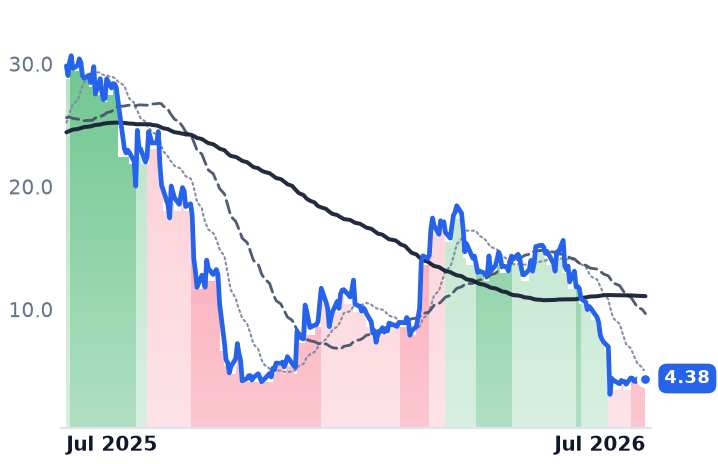
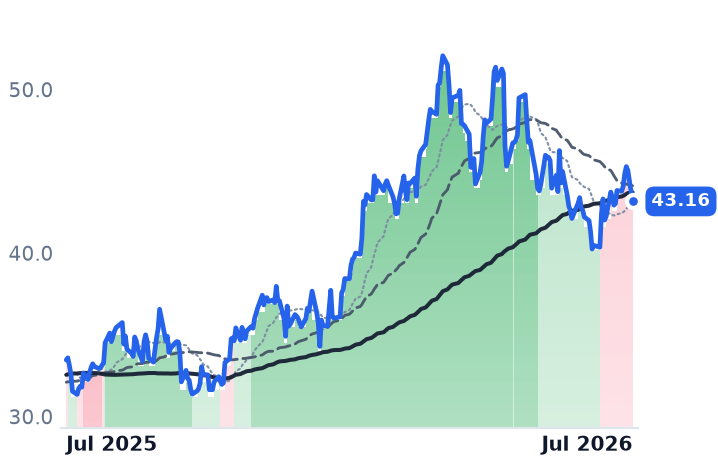
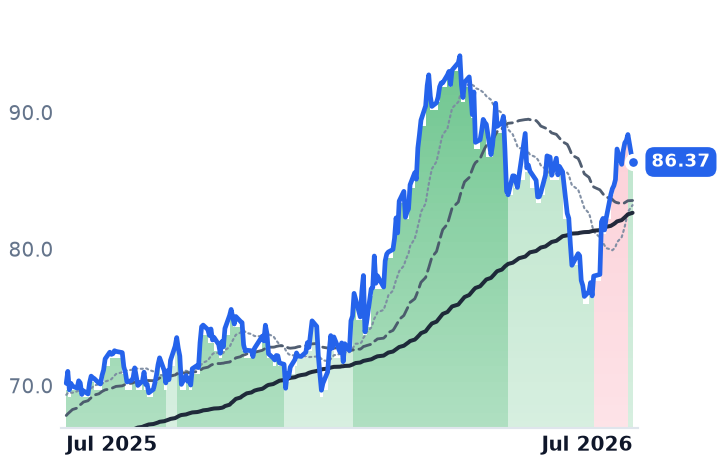
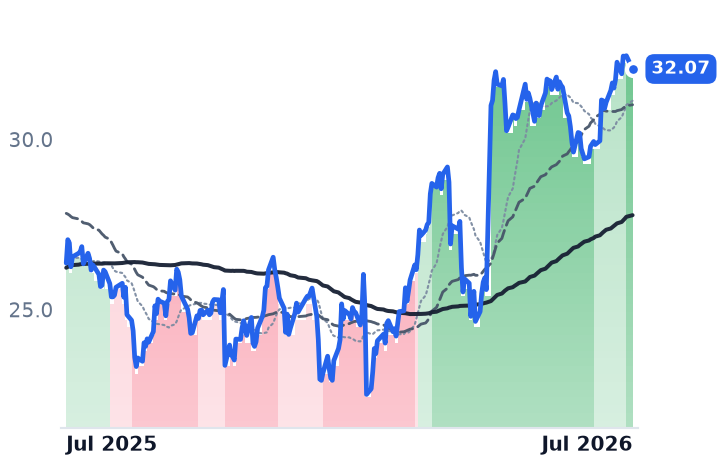
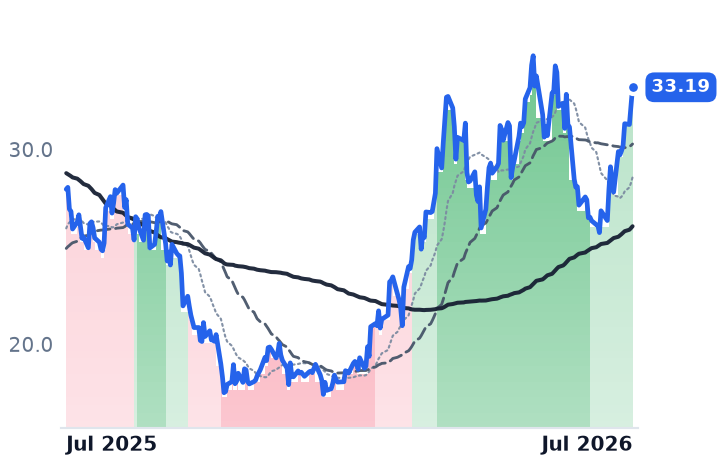
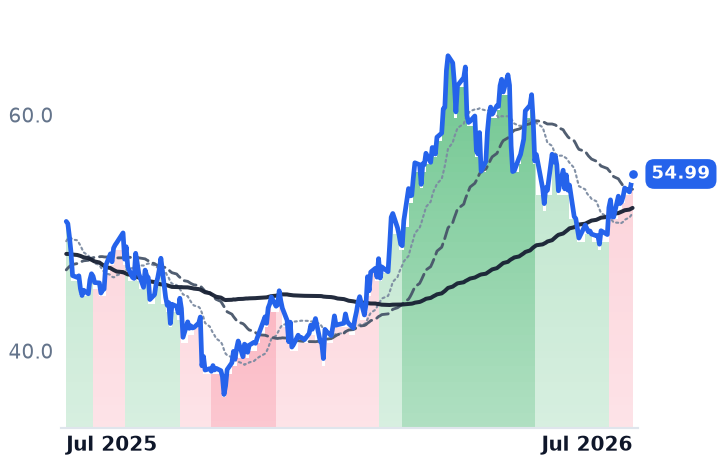
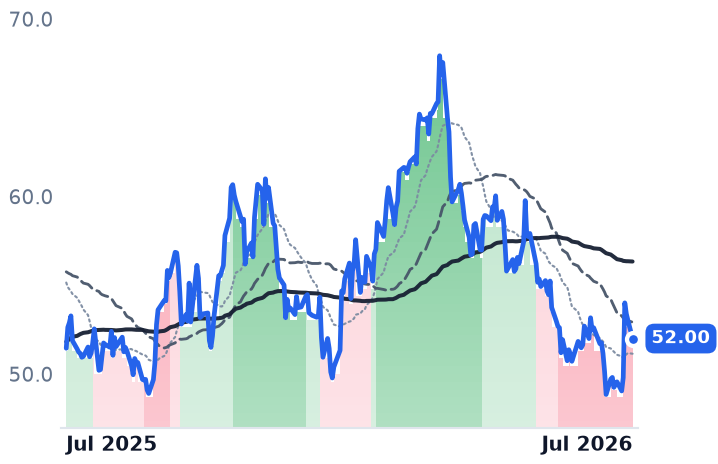
The premise of a quiet cross-cohort de-rating doesn't survive the tape. Over the trailing 30 days almost every crude-weighted name rose: SHEL +12.9%, CVX +10.2%, ARX.TO +8.2%, FANG +8.1%, PR +12.6%, SM +20.4%, TPL +19.9%, DVN +2.3%. Band states agree — FANG, PR, SHEL, SM and TPL are mildly bullish, ARX.TO and WMB strongly bullish, and all of DVN, SHEL, CVX, FANG, ARX.TO and WMB sit above their 200-day averages.
The "five-session weakness" is essentially a single session. On 27 July WMB fell 5.9%, DVN 4.2%, AR 3.5% and SHEL 2.3%; sessions from 13–24 July were flat-to-up for all of them. That day Brent dropped about 8.7%, its biggest one-day fall in more than three months, after President Trump said the US and Iran were in talks to end the war and both sides paused strikes. The 52-week highs for DVN, CVX, MTDR, AR, EQT and SHEL cluster on 30–31 March — the peak of the war premium. The 90-day "declines" are that premium draining, not a glut being priced.
Where the breakdown actually is
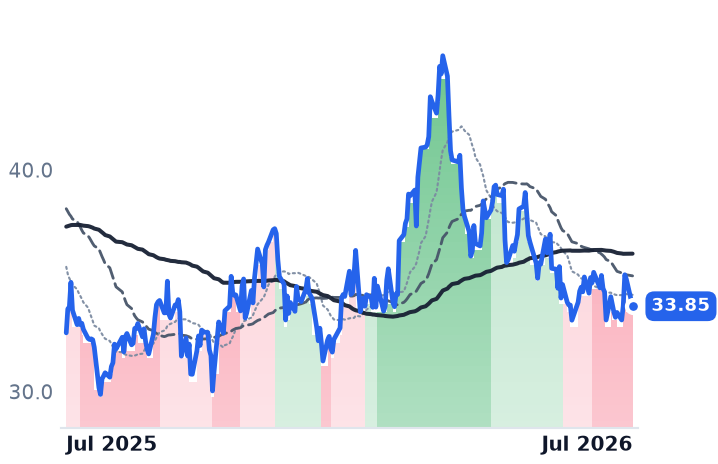
Oilfield services: HAL -16.7%, SLB -12.9%, BKR -12.2% over 90 days, all three flipping to mildly bearish on 6–9 July after five to seven months in bull bands. That break is not accompanied by guidance deterioration — Halliburton's Q2 revenue rose to $5.7bn from $5.4bn on stronger North American stimulation, and SLB reported stable North America with an unconventionals rebound. The other confirmed strongly bearish names are EQT (-12.5%) and AR (-12.2%), the gas side this desk covered on 28 July.
SOC is disqualified as a proxy. Its -53% month traces to a 30 June raise of up to $450m in stock and convertibles to repay an ExxonMobil senior secured term loan, layered on a Santa Ynez restart story that is permitting-and-execution driven, not curve-driven.
The risk points forward
The macro leg is real but unspent. EIA's July STEO cut its 2026 Brent forecast 14% to roughly $82 and 2027 18% to about $65, explicitly attributing the higher production path to the reopening of the Strait of Hormuz. The IEA still models a record 2026 surplus above 4 mb/d against demand growth near 930 kb/d, while OPEC+ has approved a fourth consecutive monthly quota hike for July and another increase for August as Gulf shipments recovered.
Against that, the producers are not behaving defensively: Rystad notes flat 2026 E&P capex plans, a 543 rig count and ~$60 corporate breakevens, Devon guided to 1.380 mmboe/d on ~$4.9bn capex with an $8bn buyback authorisation, and WMB's drop came days after a $5.34bn Blackstone-led power infrastructure investment. The de-rating, if it comes, is a 2027 strip problem the bands haven't registered yet.