

Cameco Sells Uranium Under Contracts Floored in the High $70s and Capped at $160
Hypothesis Opus 5 · Research Opus 5 · Writing Opus 5 · Prompt v1.6
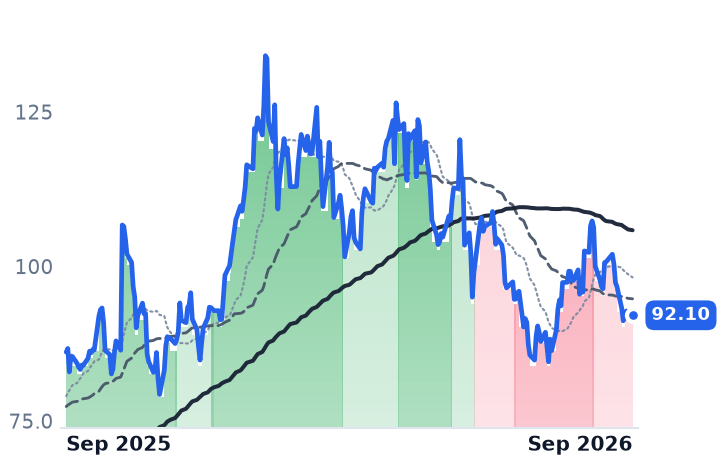
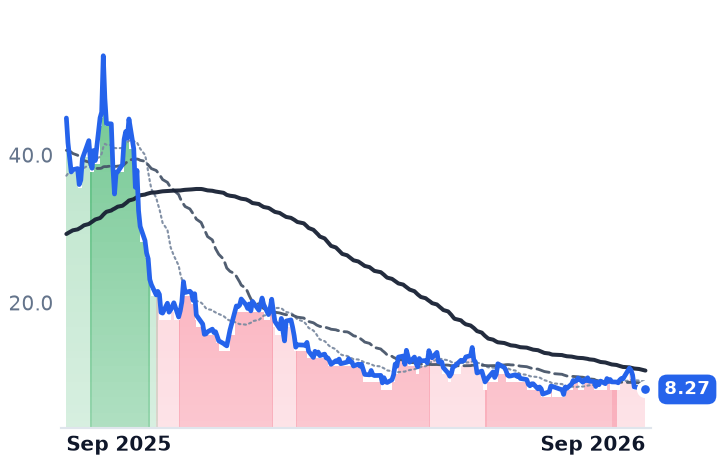
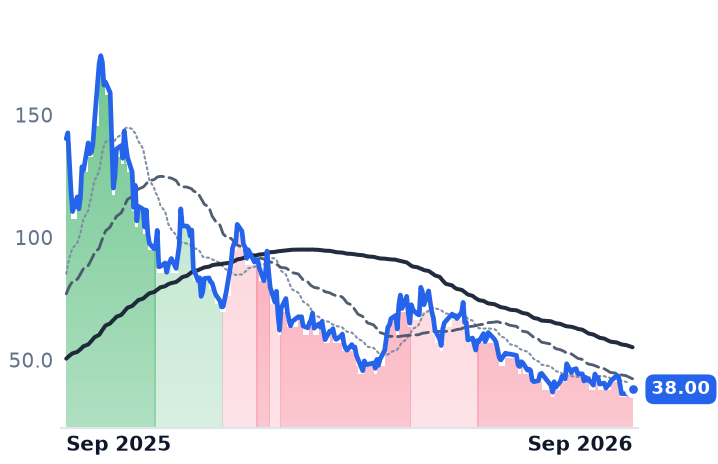
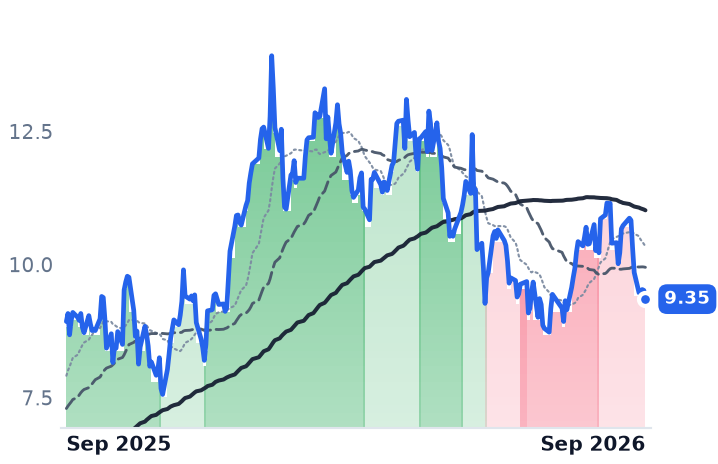
The uranium market and the uranium equities spent September moving in opposite directions. Term contract prices sit at 18-year highs near $90 a pound and Cameco lifted its 2026 realized-price guidance to C$91.00–96.00 from C$85.00–89.00, yet the shares fell roughly a tenth over thirty sessions.
The same ten days took Constellation Energy down 15.4% and Talen down 10.5% against an S&P 500 tracker off 0.8% — a power-complex repricing on long yields and cooling enthusiasm for the artificial-intelligence buildout, not a fuel-market verdict. Cameco's insulation is contractual: floors in the high $70s, ceilings at $160 escalated, deliveries averaging more than 28 million pounds a year.
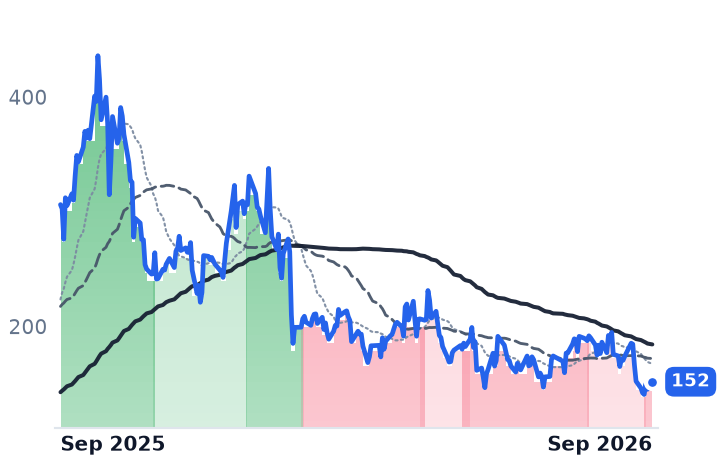
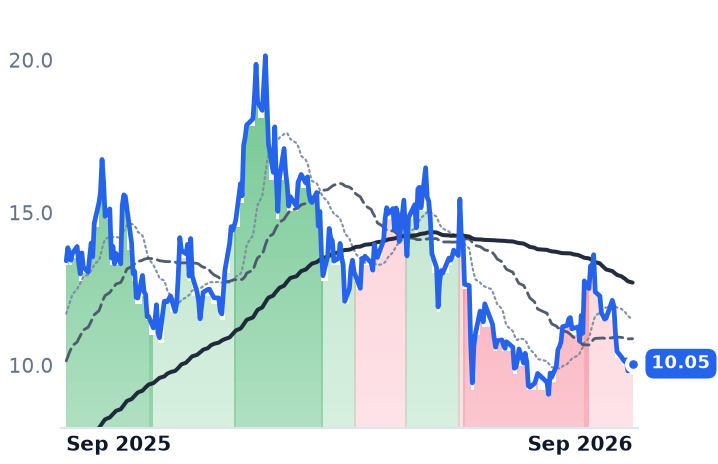
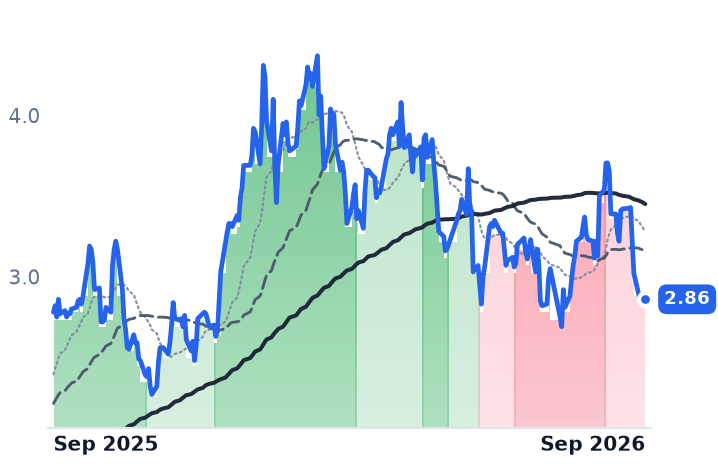
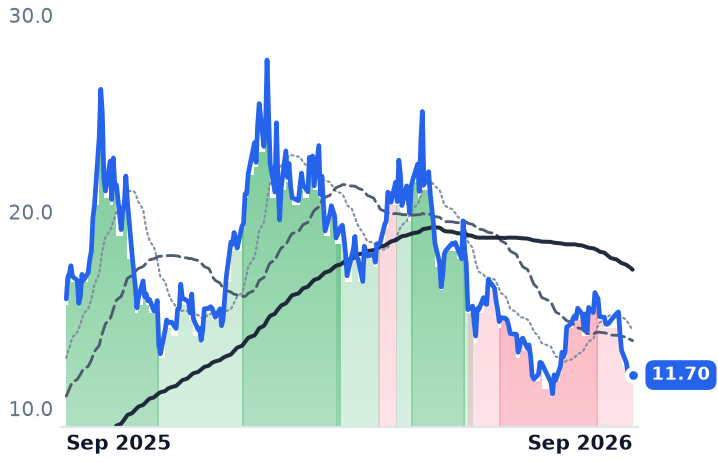
The markdowns are not one story. Centrus earnings are falling faster than its price — consensus 2026 earnings per share of $2.55 is 43% below 2025's $3.90 — while Uranium Energy has no contract book at all.
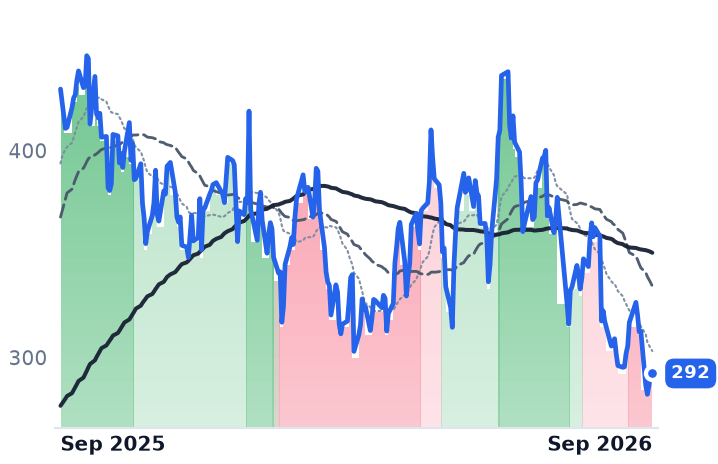
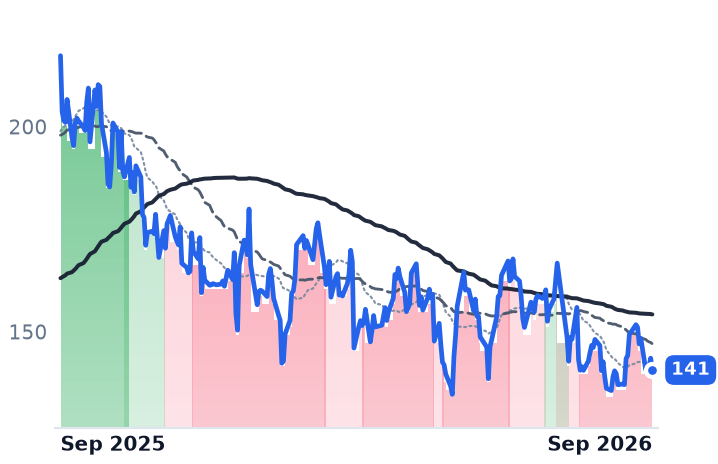
| Ticker | Company | Segment | Trend · 13mo | 30D | 1Y |
|---|---|---|---|---|---|
| The subject · what this brief is about | |||||
CCJ | Cameco | Uranium | 🔴 Cont. Bear | −9.9% | +6.9% |
LEU | Centrus Energy | Uranium | 🔴 Cont. Bear | −14.3% | −50.4% |
UEC | Uranium Energy | Uranium | 🔴 Cont. Bear | −19.7% | −25.1% |
| Compared against · context, not the story | |||||
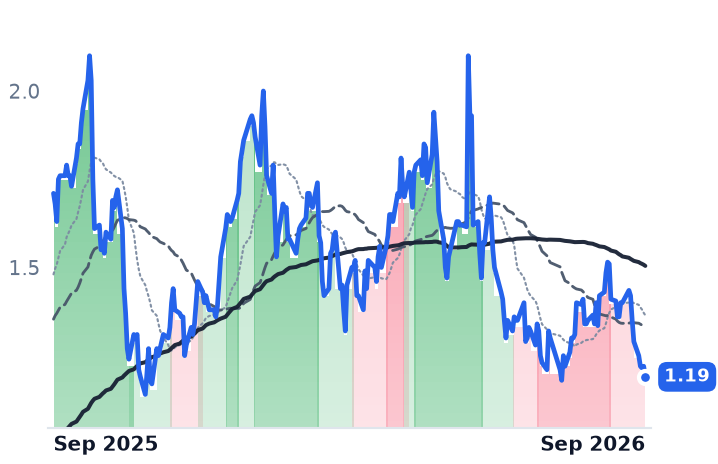
BWXT | BWX Technologies | Naval & Shipbuilding | 🔴 Cont. Bear | −1.3% | −17.0% |
SMR | NuScale Power | Advanced Nuclear | 🔴 Cont. Bear | −8.6% | −81.6% |
OKLO | Oklo | Emerging & Specialized Energy | 🔴 Cont. Bear | −4.3% | −72.9% |
NNE | Nano Nuclear Energy | Power & Propulsion Systems | 🔴 Cont. Bear | −13.9% | −65.3% |
LTBR | Lightbridge | Electrical Equipment & Parts | 🔴 Cont. Bear | −16.1% | −67.6% |
NXE | NexGen Energy | Uranium | 🔴 Cont. Bear | −14.5% | +4.7% |
DNN | Denison Mines | Uranium | 🔴 Cont. Bear | −19.2% | +2.9% |
UUUU | Energy Fuels | Uranium | 🔴 Cont. Bear | −21.4% | −24.9% |
URG | Ur-Energy | Uranium | ⚠️ Emerging Bear | −16.8% | −30.4% |
EU | enCore Energy | Uranium | 🔴 Cont. Bear | −27.7% | −69.1% |
ISOU | IsoEnergy | Uranium | ⚠️ Emerging Bear | −21.2% | −7.7% |
URA | Global X - Uranium ETF | Asset Management | 🔴 Cont. Bear | −8.8% | −13.4% |
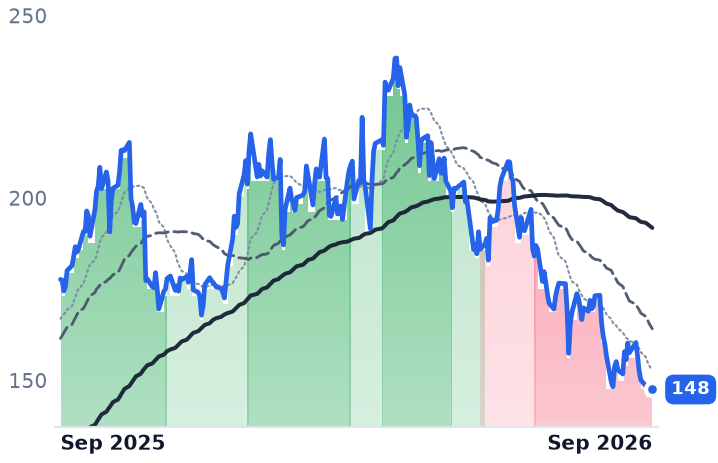
CEG | Constellation Energy | Diversified Renewable Generators | 🔴 Cont. Bear | −6.8% | −26.4% |
TLN | Talen Energy | Wholesale Power Producers | ⚠️ Emerging Bear | −4.3% | −32.0% |
VST | Vistra | Integrated Retail & Generation | 🔴 Cont. Bear | +3.7% | −35.3% |
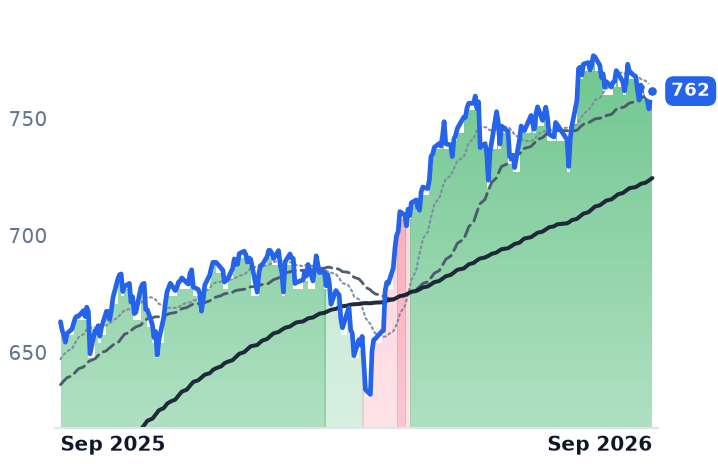
SPY | State Street SPDR S&P 500 ETF Trust | Asset Management | 🟢 Cont. Bull | −0.2% | +14.9% |
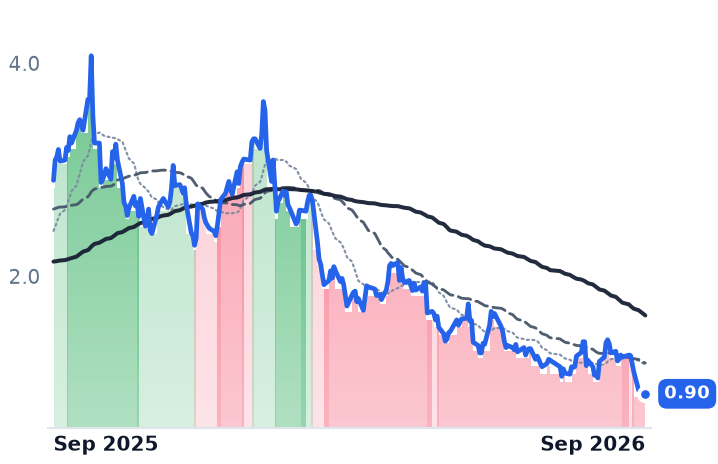
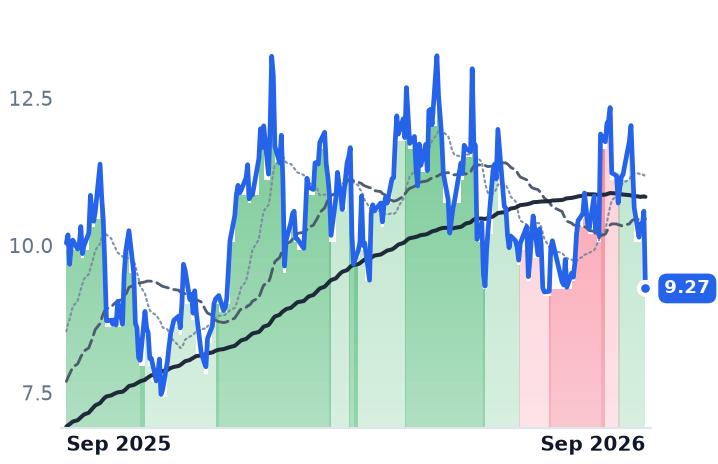
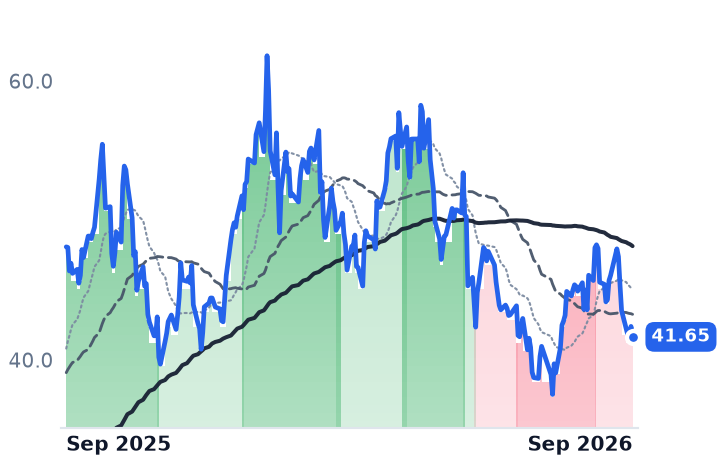
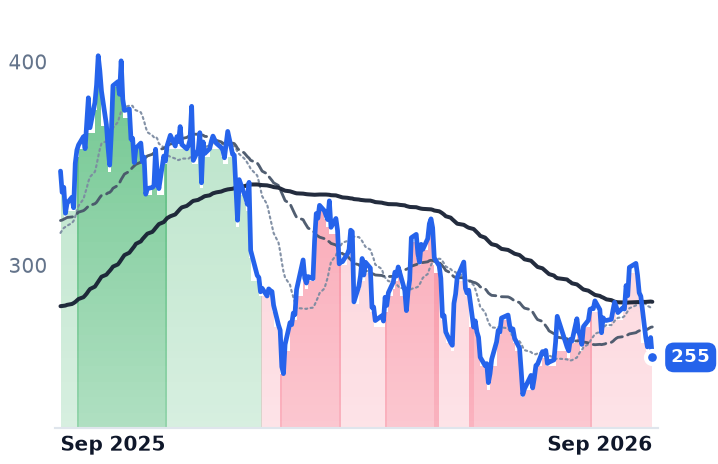
12-month price & trend
| Ticker | Mkt cap | P/E | P/E fwd | P/S | P/S fwd | P/GP | P/GP fwd | EV/EBITDA | FCF yld |
|---|---|---|---|---|---|---|---|---|---|
CCJ | $40.1B | 157.9x | 61.4x | 16.2x | 11.5x | 58.7x | 41.8x | 65.1x | 0.9% |
LEU | $2.9B | 60.4x | 59.6x | 6.1x | 6.1x | 26.1x | 26.3x | 30.1x | -7.7% |
UEC | $5.0B | n/m | — | 246.1x | 48.5x | 581.5x | 114.7x | n/m | -2.4% |
| Ticker | Mkt cap | P/E | P/E fwd | P/S | P/S fwd | P/GP | P/GP fwd | EV/EBITDA | FCF yld |
|---|---|---|---|---|---|---|---|---|---|
BWXT | $13.5B | 38.0x | 31.1x | 3.8x | 3.6x | 17.4x | 16.1x | 27.0x | 2.3% |
SMR | $3.0B | n/m | — | 284.6x | 160.7x | — | 762.7x | n/m | -25.5% |
OKLO | $6.9B | n/m | — | — | — | — | — | n/m | -4.0% |
| Ticker | Mkt cap | P/E | P/E fwd | P/S | P/S fwd | P/GP | P/GP fwd | EV/EBITDA | FCF yld |
|---|---|---|---|---|---|---|---|---|---|
NNE | $1.1B | n/m | — | — | 887.7x | — | — | n/m | -3.7% |
LTBR | $258.0M | n/m | — | n/m | — | — | — | n/m | -6.6% |
NXE | $7.2B | n/m | — | n/m | — | — | — | n/m | -2.4% |
| Ticker | Mkt cap | P/E | P/E fwd | P/S | P/S fwd | P/GP | P/GP fwd | EV/EBITDA | FCF yld |
|---|---|---|---|---|---|---|---|---|---|
DNN | $2.9B | n/m | — | 988.4x | 120.1x | — | — | n/m | -4.1% |
UUUU | $3.0B | n/m | — | 28.3x | 22.5x | 65.5x | 52.0x | n/m | -3.7% |
URG | $719.2M | n/m | — | 26.4x | 8.1x | — | — | n/m | -9.3% |
| Ticker | Mkt cap | P/E | P/E fwd | P/S | P/S fwd | P/GP | P/GP fwd | EV/EBITDA | FCF yld |
|---|---|---|---|---|---|---|---|---|---|
EU | $363.2M | n/m | — | 8.8x | 4.1x | 39.1x | 18.2x | n/m | -12.1% |
ISOU | $743.6M | n/m | — | n/m | — | — | — | n/m | -3.3% |
URA | $3.9B | — | — | — | — | — | — | — | — |
| Ticker | Mkt cap | P/E | P/E fwd | P/S | P/S fwd | P/GP | P/GP fwd | EV/EBITDA | FCF yld |
|---|---|---|---|---|---|---|---|---|---|
CEG | $102.3B | 27.7x | 23.6x | 3.3x | 3.1x | 3.4x | 3.2x | 14.8x | 0.3% |
TLN | $14.2B | n/m | 15.2x | 4.0x | 3.2x | 9.0x | 7.2x | 29.6x | 3.6% |
VST | $47.4B | 23.5x | 16.3x | 3.0x | 2.1x | 22.9x | 16.3x | 10.3x | 2.9% |
| Ticker | Mkt cap | P/E | P/E fwd | P/S | P/S fwd | P/GP | P/GP fwd | EV/EBITDA | FCF yld |
|---|---|---|---|---|---|---|---|---|---|
SPY | $773.0B | — | — | — | — | — | — | — | — |
Consensus projections
| Ticker | FY2026E | FY2027E | FY2028E | |
|---|---|---|---|---|
CCJ | Revenue | +1.6% | +12.3% | +8.4% |
| EPS | +4.4% | +70.5% | +24.3% | |
LEU | Revenue | +5.2% | −0.8% | −10.9% |
| EPS | −43.2% | +13.2% | −23.3% | |
UEC | Revenue | −61.4% | +301.4% | +159.3% |
| EPS | +51.4% | −73.5% | −428.1% | |
BWXT | Revenue | +20.6% | +9.8% | +7.3% |
| EPS | +24.1% | +11.5% | +11.8% | |
SMR | Revenue | −54.8% | +517.4% | +185.1% |
| EPS | −76.8% | +19.4% | −24.8% | |
OKLO | Revenue | — | +252.7% | +552.9% |
| EPS | +57.1% | +9.6% | +13.5% | |
NNE | Revenue | +1684.0% | +356.5% | +39.0% |
| EPS | −23.4% | +55.2% | +34.3% | |
NXE | Revenue | −68.7% | +131.4% | +32282.1% |
| EPS | −38.6% | −10.8% | +37.8% | |
DNN | Revenue | +394.2% | −27.3% | +1699.7% |
| EPS | −30.5% | −73.1% | −363.0% | |
UUUU | Revenue | +128.1% | +88.3% | +62.7% |
| EPS | −37.3% | −160.5% | +170.0% | |
URG | Revenue | +219.2% | +57.2% | +23.7% |
| EPS | −60.5% | −141.9% | +278.9% | |
EU | Revenue | +101.0% | +20.6% | +72.5% |
| EPS | −66.0% | −114.4% | +1843.9% | |
ISOU | Revenue | — | — | −100.0% |
| EPS | +534.4% | +164.5% | +114.0% | |
CEG | Revenue | +36.6% | +2.6% | +5.5% |
| EPS | +28.7% | +10.1% | +26.3% | |
TLN | Revenue | +84.0% | +15.8% | +4.6% |
| EPS | +247.6% | +48.4% | +17.8% | |
VST | Revenue | +16.7% | +9.3% | +4.7% |
| EPS | +80.0% | +18.7% | +18.0% |
Forward fiscal years only. Blank means no analyst coverage for that year.
The price utilities pay for uranium under multi-year contracts reached its highest level since 2008 this year, around $90 a pound, according to Sprott, and Cameco — the Saskatoon miner that sells concentrate to nuclear utilities across three continents — raised the price it expects to collect. Its shares still fell about a tenth over the thirty sessions to 21 September, to roughly $92.
What moved was not uranium. Between 8 and 18 September, Constellation Energy fell 15.4% and Talen 10.5%, while an S&P 500 tracker slipped 0.8%; reporting on Constellation's week attributed the move to rising long-term Treasury yields and investors stepping back from the artificial-intelligence buildout trade. Nuclear fuel names were repriced alongside the electricity generators they are assumed to supply — which matters because a fuel dollar is earned nothing like a megawatt-hour is.
How the pounds are actually priced
Cameco does not get paid the spot price. It delivers under utility contracts struck years earlier, and on the July 31 second-quarter call management described the shape of them: floors in the high $70s a pound and ceilings at $160, escalated. Those terms cap participation in a spike and cushion a fall. The company has commitments for average annual deliveries of more than 28 million pounds of uranium oxide over five years, and second-quarter realized price came in at C$91.30 (US$65.53) a pound, up 12% year on year. In the same release it raised 2026 realized-price guidance to C$91.00–96.00 from C$85.00–89.00, with unit cost of sales also lifted, to C$63.00–67.50 from C$61.50–65.00, and production held at 19.5–21.5 million pounds.
The reported quarter was ugly regardless: revenue down 7.2% to $814.1m, gross margin from 29.3% to 21.1%, net income down 92% to $25.2m as the 49%-owned Westinghouse swung to a $10m loss from $126m of earnings, the prior year having carried roughly $170m from the Dukovany reactor project in the Czech Republic. Chief executive Tim Gitzel framed the volume shortfall as deliberate: the company is "not prepared to dilute the value of our assets by committing supply into contracts that do not appropriately reflect the durability of market fundamentals," he told investors on July 31. Westinghouse also sits behind a conditional Department of Energy commitment of up to $17.5bn in loans for long-lead items on as many as ten AP1000 reactors — conditional, and a 2030s in-service story.
Two other ways to sell the same atom
Centrus Energy sells separative work units and enrichment services rather than pounds, and its backlog reached $4.5bn at 30 June, extending to 2040. The income statement went the other way: June-quarter operating income fell 69% to $10.4m on gross margin of 28.3%, down from 34.9%, and consensus 2026 earnings per share of $2.55 sits 43% below the $3.90 reported for 2025. Its trailing and forward multiples — 60.4x and 59.6x — are essentially identical, because profit is falling as fast as the shares. It also priced $500m of stock and warrants at $199.64 on 9 September; the stock closed at $151.82 on 21 September.
Uranium Energy is the unhedged mirror. It booked no revenue in two of its last three quarters; its one recent sale was 200,000 pounds at $101 a pound, against a quarterly spot average of $80.76. It held 1,456,000 pounds of purchased inventory at 30 April — about $131m of metal against a $4.97bn market value.
The verdict
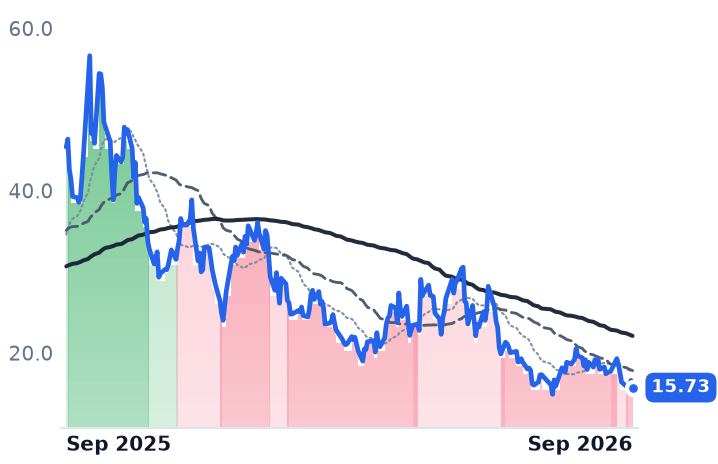
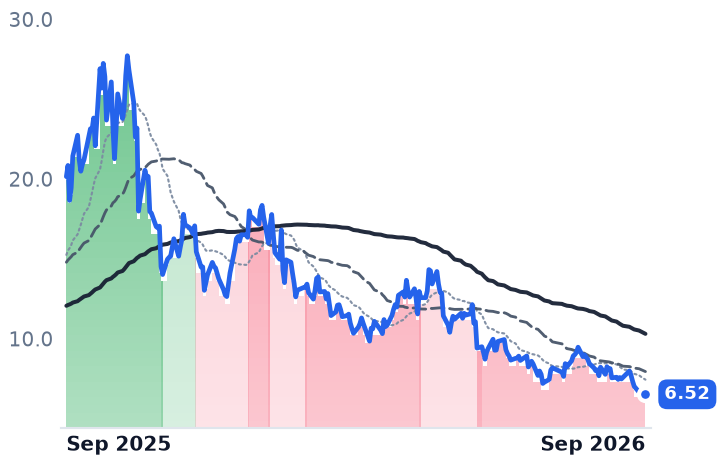
The group is not one trade and should not be marked as one. Over twelve months the producers with contract books rose — Cameco 6.9%, NexGen 11.6%, Denison 11.3% — while the pre-revenue reactor developers collapsed, NuScale down 78.3% and Oklo 63.8%. Cameco's fall is a very high multiple compressing, from about 65x forward earnings in May to 61.4x now, still 36x 2027 consensus earnings of $2.56; the fuel meters improved through it. Centrus's fall is earned by its own income statement. Uranium Energy's is neither, because there is no delivery book to judge.
Behind all three, the arithmetic accumulates quietly: utilities need roughly 150 million pounds a year to replace what they burn, and 2025 was the thirteenth straight year they contracted for less. That bill does not go away when yields rise.