

Samsara's Cloud Bill Outgrew Its Camera Bill and Cut Gross Margin to 75.4%
Hypothesis Opus 5 · Research Opus 5 · Writing Opus 5 · Prompt v1.6
Samsara's per-asset subscription meter is compounding faster than almost anything else in mid-cap software — annual recurring revenue of $1.991bn, up 30%, with the customers paying over $1m a year growing their spend 62% — and the cost of running it is rising faster still.
Cost of revenue jumped 42% year over year in the quarter ended 2 May, and the company's own quarterly filing blames third-party cloud and cellular charges, not the connected devices bolted to customer trucks. Gross margin has now fallen five quarters running, from 77.3% to 75.4%.
The business earns the growth; the re-rating is harder to defend. Shares have added 30% in three months into a fifth-quarter margin slide and management's own guide of 23-24% revenue growth for the quarter it reports on 3 September.
| Ticker | Company | Segment | Trend · 13mo | 30D | 1Y |
|---|---|---|---|---|---|
| The subject · what this brief is about | |||||
IOT | Samsara | IoT & Connected Operations | 🌱 Emerging Bull | +15.0% | +13.9% |
| Compared against · context, not the story | |||||
ZBRA | Zebra Technologies | IoT & Edge Connectivity | 🌱 Emerging Bull | +23.5% | +12.4% |
TRMB | Trimble | Data Infrastructure & Software Solutions | 🔴 Cont. Bear | +6.9% | −24.5% |
DGII | Digi International | IoT & Edge Connectivity | 🟢 Cont. Bull | +11.1% | +118.2% |
FROG | JFrog | Developer Tools & DevOps | 🟢 Cont. Bull | +25.9% | +100.0% |
VEEV | Veeva Systems | Life Sciences Software & Data | 🌱 Emerging Bull | +37.3% | +2.8% |
TWLO | Twilio | Communications & Messaging Platforms | 🟢 Cont. Bull | +25.8% | +127.4% |
DT | Dynatrace | Other | 🌱 Emerging Bull | +21.7% | +6.1% |
NTNX | Nutanix | Cloud Infrastructure & Platforms | 🌱 Emerging Bull | +16.7% | +2.9% |
TEAM | Atlassian | Developer Tools & DevOps | 🔴 Cont. Bear | +94.1% | +7.1% |
CRM | Salesforce | Customer Experience & CRM | 🔴 Cont. Bear | +41.7% | +0.7% |
BILL | Bill.com | Fintech & Digital Finance | 🌱 Emerging Bull | +10.8% | +8.4% |
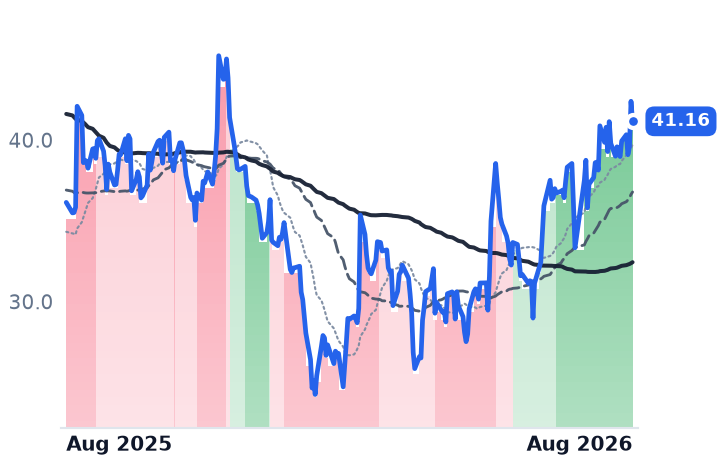
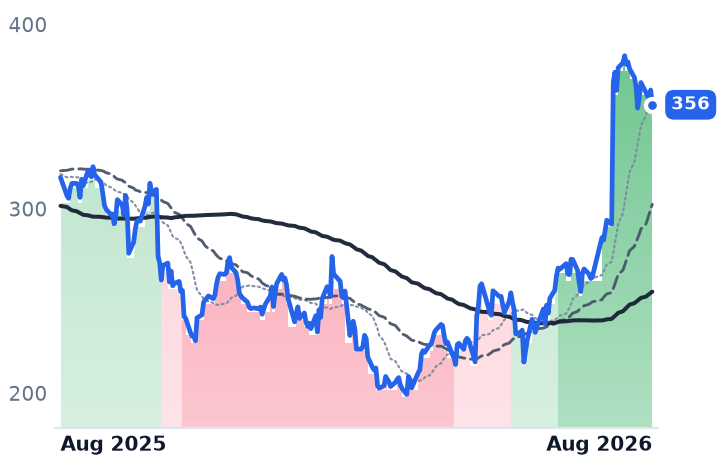
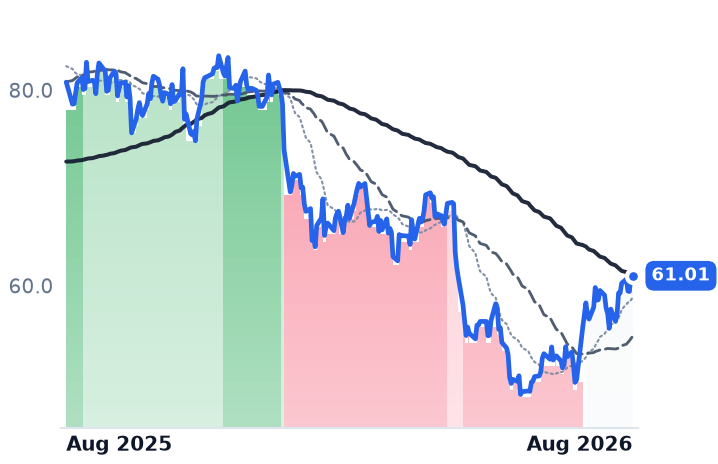
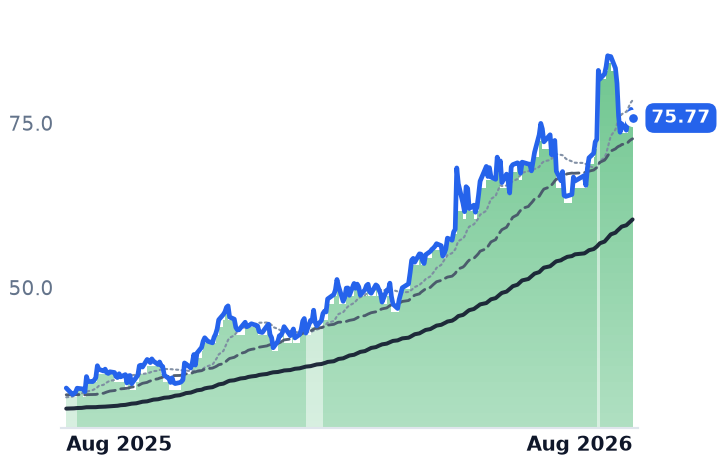
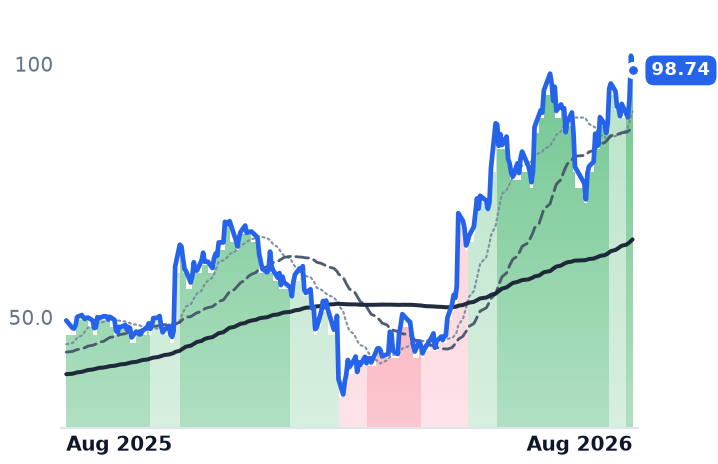
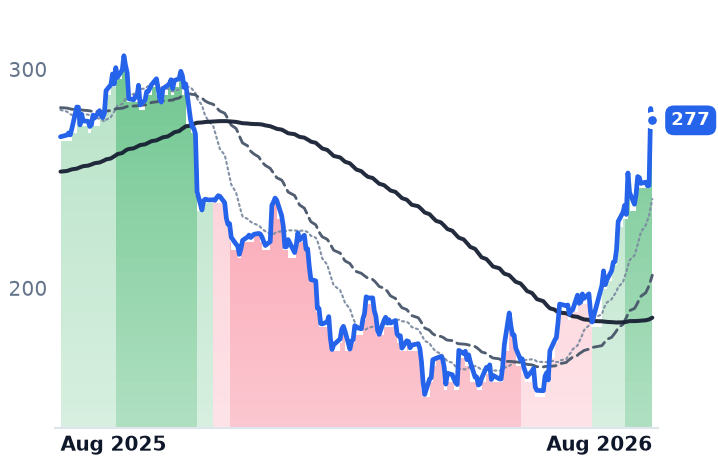
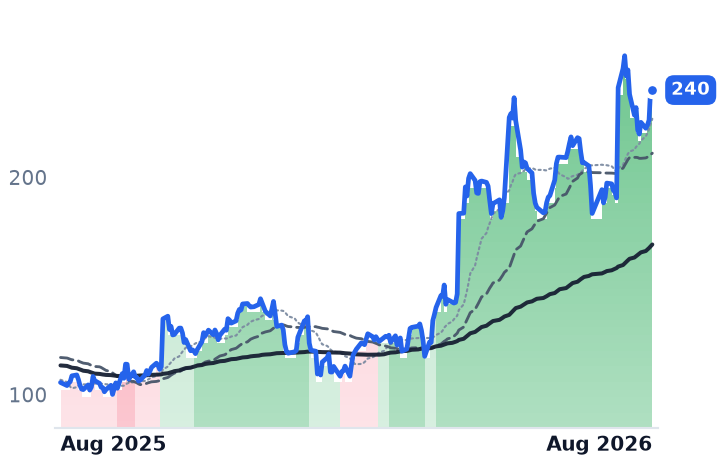
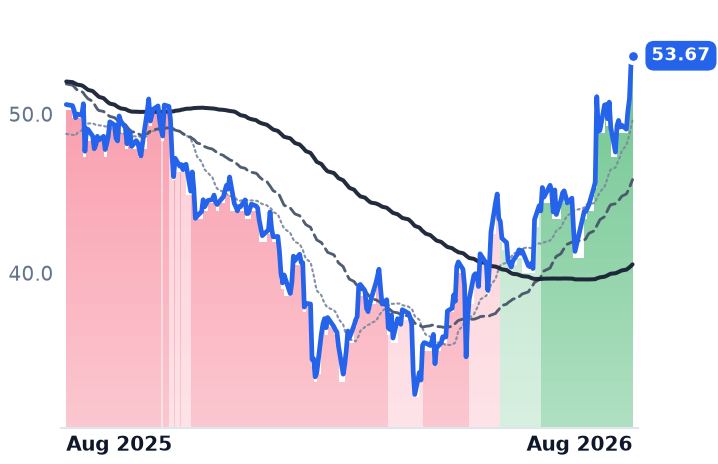
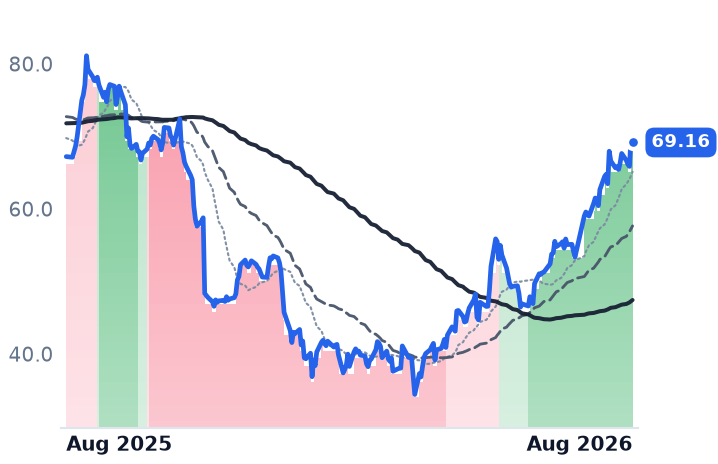
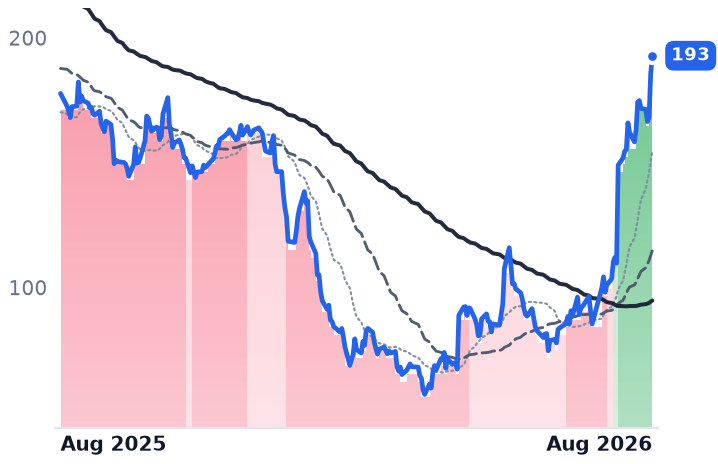
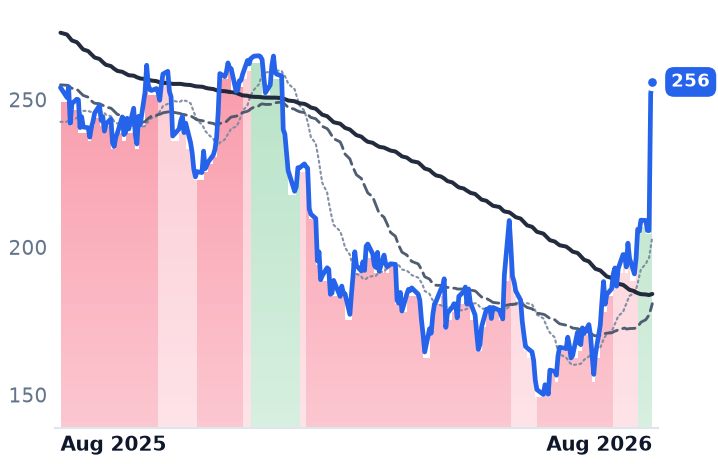
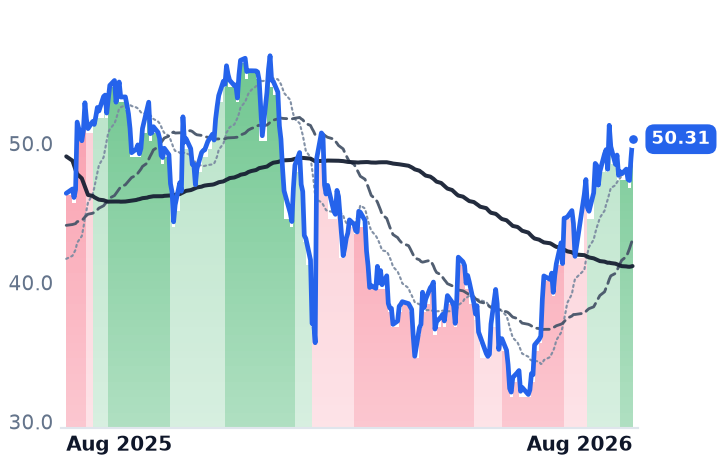
12-month price & trend
| Ticker | Mkt cap | P/E | P/E fwd | P/S | P/S fwd | P/GP | P/GP fwd | EV/EBITDA | FCF yld |
|---|---|---|---|---|---|---|---|---|---|
IOT | $23.8B | 402.7x | 57.3x | 13.7x | 11.8x | 18.0x | 15.5x | 242.8x | 1.0% |
ZBRA | $17.0B | 33.3x | 16.9x | 2.9x | 2.7x | 5.9x | 5.6x | 17.2x | 5.3% |
TRMB | $14.2B | n/m | 16.6x | 3.8x | 3.6x | 5.5x | 5.3x | 58.8x | 3.8% |
| Ticker | Mkt cap | P/E | P/E fwd | P/S | P/S fwd | P/GP | P/GP fwd | EV/EBITDA | FCF yld |
|---|---|---|---|---|---|---|---|---|---|
DGII | $2.9B | 58.3x | 28.1x | 5.6x | 5.4x | 8.8x | 8.4x | 29.6x | 4.7% |
FROG | $10.9B | n/m | 92.0x | 18.2x | 16.7x | 23.4x | 21.5x | n/m | 1.6% |
VEEV | $44.9B | 44.6x | 30.0x | 13.0x | 12.2x | 17.4x | 16.3x | 31.5x | 3.7% |
| Ticker | Mkt cap | P/E | P/E fwd | P/S | P/S fwd | P/GP | P/GP fwd | EV/EBITDA | FCF yld |
|---|---|---|---|---|---|---|---|---|---|
TWLO | $36.1B | 31.6x | 40.1x | 6.5x | 6.0x | 13.3x | 12.4x | 99.1x | 3.1% |
DT | $14.4B | 97.0x | 24.9x | 6.9x | 6.2x | 8.4x | 7.6x | 44.1x | 4.0% |
NTNX | $18.7B | 12.4x | 31.4x | 6.6x | 5.8x | 7.5x | 6.7x | 48.5x | 4.5% |
| Ticker | Mkt cap | P/E | P/E fwd | P/S | P/S fwd | P/GP | P/GP fwd | EV/EBITDA | FCF yld |
|---|---|---|---|---|---|---|---|---|---|
TEAM | $50.0B | n/m | 34.6x | 7.6x | 6.7x | 9.0x | 7.9x | 331.1x | 2.6% |
CRM | $209.7B | 23.3x | 15.8x | 4.8x | 4.5x | 6.2x | 5.9x | 15.4x | 7.2% |
BILL | $4.8B | n/m | 13.4x | 2.9x | 2.7x | 3.6x | 3.3x | 50.1x | 8.9% |
Consensus projections
| Ticker | FY2026E | FY2027E | FY2028E | |
|---|---|---|---|---|
IOT | Revenue | +28.9% | +25.9% | +19.7% |
| EPS | +129.2% | +41.5% | +26.7% | |
ZBRA | Revenue | +15.5% | +6.0% | +4.1% |
| EPS | +33.4% | +5.1% | +7.9% | |
TRMB | Revenue | −2.1% | +10.2% | +7.8% |
| EPS | +8.8% | +18.7% | +12.4% | |
DGII | Revenue | +24.8% | +8.7% | +4.5% |
| EPS | +31.4% | +16.3% | +8.4% | |
FROG | Revenue | +24.2% | +17.7% | +18.3% |
| EPS | +23.8% | +16.8% | +26.0% | |
VEEV | Revenue | +16.3% | +16.4% | +12.1% |
| EPS | +23.1% | +16.1% | +10.8% | |
TWLO | Revenue | +19.4% | +11.7% | +10.6% |
| EPS | +23.5% | +14.5% | +14.2% | |
DT | Revenue | +18.9% | +15.6% | +15.0% |
| EPS | +22.8% | +17.8% | +14.6% | |
NTNX | Revenue | +12.2% | +13.0% | +12.7% |
| EPS | +11.0% | +14.3% | +16.8% | |
TEAM | Revenue | +24.7% | +15.4% | +14.7% |
| EPS | +55.5% | −0.1% | +21.6% | |
CRM | Revenue | +9.3% | +11.4% | +9.6% |
| EPS | +17.4% | +37.6% | −1.6% | |
BILL | Revenue | +13.2% | +8.9% | +10.1% |
| EPS | +26.1% | +35.2% | +19.3% |
Forward fiscal years only. Blank means no analyst coverage for that year.
Samsara's cost of serving its customers is growing faster than the customers are. The company installs its own dash cams, vehicle gateways and asset trackers on customer trucks, trailers and job sites, then sells the data back as safety, telematics and equipment-monitoring software — and in the quarter ended 2 May its cost of revenue rose 42% to $117.7m while revenue grew 30.5%.
The cameras are not the reason. Samsara's quarterly filing attributes the fall in gross margin from 77% to 75% mainly to third-party cloud and cellular costs, which added $16.1m year over year against $10.8m of extra connected-device cost. That is the whole argument in one line: the market pays Samsara a software multiple on the assumption that each newly connected truck arrives at software economics, and the marginal truck is currently arriving with an inference bill attached. Second-quarter results land after the close on 3 September.
The meter is real
Start with what confirms. Samsara ended the quarter with $1.991bn of annual recurring revenue, up 30%, on $101m of net new ARR that also grew 30%. Customers paying more than $100,000 a year numbered 3,363, and their ARR grew 37% — the third straight quarter of acceleration. The 190 customers above $1m grew theirs 62%, accelerating for a fourth quarter.
That growth comes from attach and expansion rather than price. Core dollar-based net retention ran about 115%, and 96% of those $100,000-plus customers run two or more products, 70% three or more. Newer products supplied more than a fifth of net new annual contract value, and seven of the ten largest new deals included one. Hertz, Foundation Building Materials and the State of Connecticut were among the wins — rental, distribution and government, not long-haul trucking alone.
The demand backdrop helps rather than hurts. After a four-year freight recession, Class 8 truck net orders in June ran 241% above a year earlier as fleets pulled purchases forward ahead of 2027 emissions rules, with truckload spot rates excluding fuel up 43%. More assets are being bought, and Samsara meters assets.
What the meter costs
Samsara does not book hardware as a margin-bearing line. Device costs are capitalized and amortized inside the subscription, which is why the economics of shipping boxes show up as gross-margin drag rather than loss-making hardware revenue. Gross margin has fallen in five consecutive quarters, from 77.3% to 75.4%, and gross profit grew 27.3% against revenue's 30.5%.
"Our focus on AI and cloud infrastructure is driving efficiencies across the business," chief executive Sanjit Biswas told investors on the June 4 call. The efficiencies are real further down: GAAP operating income turned positive at $7.2m against a $33.3m loss a year earlier. But full-year fiscal 2026 still carried a $52.6m GAAP operating loss, and stock-based compensation of roughly $315m — 19.5% of revenue — is what separates a 1.5% GAAP operating margin from the 19% non-GAAP figure management reports. Diluted shares rose 3.5% in a year.
What a metered asset costs to own
The three listed companies that monetize the same physical asset by selling the device once are priced nothing like this. Samsara trades at 15.5x forward gross profit against 5.6x for Zebra Technologies, the barcode-scanner and rugged-computer maker that grew revenue 20.4% last quarter at a 20.6% GAAP operating margin; 5.3x for Trimble, whose transportation unit — the closest comparable to Samsara's core market — grew ARR just 7% to $533m and is now under a Goldman-advised strategic review; and 8.4x for Digi International, the cellular-router maker whose ARR reached a record $191m. Samsara's trailing free-cash-flow yield is 0.99%; Zebra's is 5.3%.
Shares closed at $41.16 on 28 August, up 30% in three months and 42% in six, with the 50-day average above the 200-day all month. There was no gap: Samsara appears nowhere in the largest 90-day movers. Brokers followed rather than led, RBC lifting its target to $50 and Truist to $38 in August.
The verdict
The growth is earned and the bear case on demand is simply wrong this year. What the business does not yet explain is the price. Samsara's multiple of gross profit has expanded 31% since early May, from 13.7x, while the gross profit underneath it grew 27% — and management guides the quarter it is about to report to 23-24% revenue growth, seven points below what it just delivered.
Samsara has trained its investors to read the ARR line. On 3 September the number that settles the argument sits two rows below revenue.