

NetApp Guided Fiscal 2027 Gross Margin Two Points Lower as Memory Contract Prices Doubled
Hypothesis Opus 5 · Research Opus 5 · Writing Opus 5 · Prompt v1.6
NetApp absorbed the first year of the worst memory-price shock in a decade without losing a point of gross margin — then told investors the second year will cost it.
Conventional dynamic random-access memory contract prices rose roughly 93-98% in the first quarter of 2026 and a further 58-63% in the second, and NetApp's arrays are built out of that memory. Fiscal 2026 non-GAAP gross margin came in at 71.3%, against 71.1% the year before. Fiscal 2027 is guided to 68.5-69.5% — about $149m of foregone gross profit on the company's own revenue guide.
The high-margin cloud layer credited with the re-rating is 9.3% of revenue; the growth came from all-flash hardware, up 18% in the April quarter, which is exactly what the memory shock prices. The quarter management called the product-margin trough is reported September 2.
| Ticker | Company | Segment | Trend · 13mo | 30D | 1Y |
|---|---|---|---|---|---|
| The subject · what this brief is about | |||||
NTAP | NetApp | Enterprise Storage & Software | 🟢 Cont. Bull | +10.3% | +65.4% |
| Compared against · context, not the story | |||||
DELL | Dell Technologies | Enterprise Storage & Software | 🟢 Cont. Bull | +24.4% | +246.7% |
P | Everpure | Other | 🌱 Emerging Bull | +36.5% | +17.4% |
HPE | Hewlett Packard Enterprise | Enterprise Storage & Software | 🟢 Cont. Bull | +18.7% | +131.9% |
WDC | Western Digital | Data Storage Devices | 🟢 Cont. Bull | +0.3% | +466.3% |
STX | Seagate Technology | Data Storage Devices | 🟢 Cont. Bull | +10.0% | +391.3% |
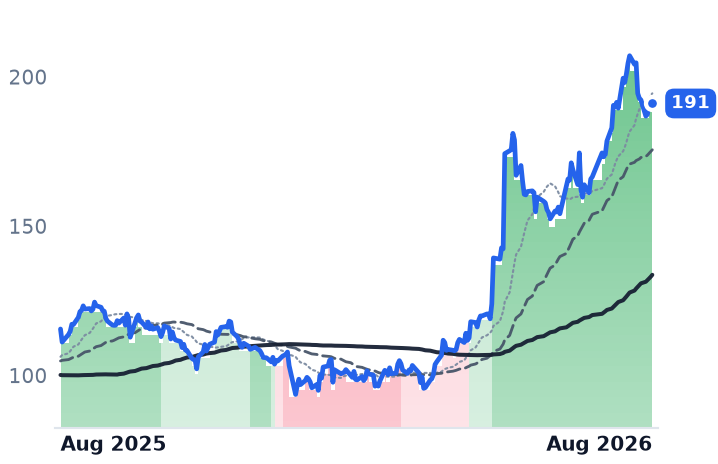
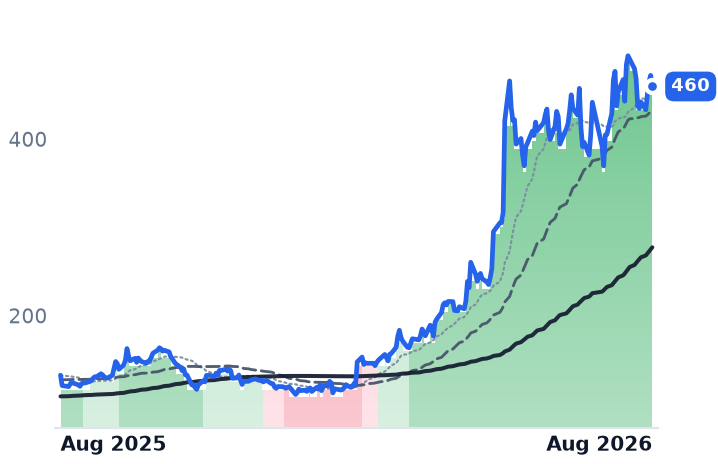
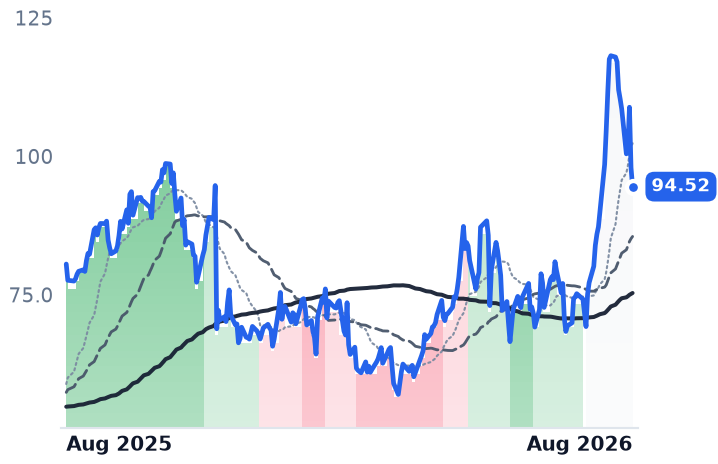
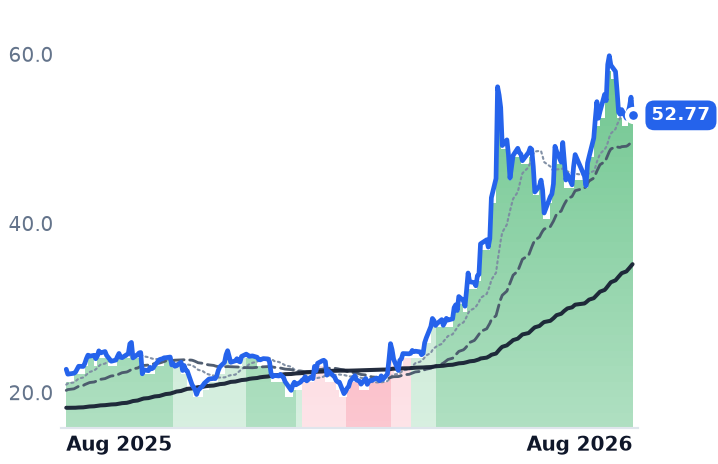
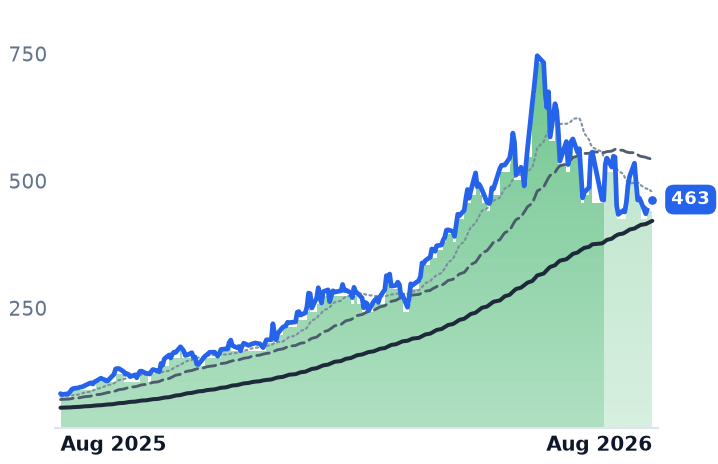
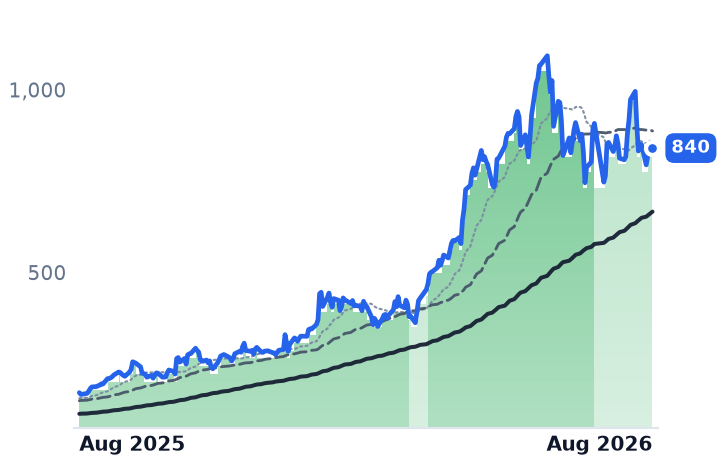
12-month price & trend
| Ticker | Mkt cap | P/E | P/E fwd | P/S | P/S fwd | P/GP | P/GP fwd | EV/EBITDA | FCF yld |
|---|---|---|---|---|---|---|---|---|---|
NTAP | $36.7B | 29.1x | 20.8x | 5.3x | 4.9x | 7.5x | 6.9x | 19.1x | 5.1% |
DELL | $308.2B | 36.3x | 24.6x | 2.3x | 1.8x | 12.1x | 9.3x | 22.2x | 3.1% |
P | $36.1B | 159.6x | 44.3x | 9.2x | 8.0x | 13.1x | 11.4x | 86.1x | 1.4% |
| Ticker | Mkt cap | P/E | P/E fwd | P/S | P/S fwd | P/GP | P/GP fwd | EV/EBITDA | FCF yld |
|---|---|---|---|---|---|---|---|---|---|
HPE | $73.1B | 50.7x | 16.1x | 1.9x | 1.6x | 5.7x | 4.9x | 22.2x | 5.5% |
WDC | $166.1B | 25.6x | 48.3x | 14.1x | 12.9x | 31.1x | 28.4x | 31.1x | 1.7% |
STX | $178.4B | 73.9x | 53.5x | 16.2x | 14.8x | 39.0x | 35.7x | 53.6x | 1.5% |
Consensus projections
| Ticker | FY2026E | FY2027E | FY2028E | |
|---|---|---|---|---|
NTAP | Revenue | +4.3% | +10.0% | +5.7% |
| EPS | +10.4% | +12.9% | +11.1% | |
DELL | Revenue | +16.2% | +55.3% | +14.9% |
| EPS | +27.3% | +89.4% | +21.3% | |
P | Revenue | +15.2% | +23.8% | +16.4% |
| EPS | +16.4% | +25.9% | +26.2% | |
HPE | Revenue | +30.5% | +11.6% | +5.8% |
| EPS | +81.3% | +18.7% | +10.1% | |
WDC | Revenue | +36.9% | +37.2% | +26.5% |
| EPS | +106.2% | +72.8% | +48.0% | |
STX | Revenue | +32.7% | +35.9% | +24.9% |
| EPS | +86.9% | +77.9% | +48.0% |
Forward fiscal years only. Blank means no analyst coverage for that year.
NetApp spent fiscal 2026 buying memory into a market that had roughly doubled the price of it, and still shipped a record year of all-flash arrays without giving up gross margin. Then, on May 28, the company guided the year ahead down.
The guide — non-GAAP gross margin of 68.5-69.5% for fiscal 2027, against 71.3% delivered — is worth roughly $149m of gross profit on NetApp's own $7.325-7.575bn revenue guide, and the mechanism reaches past one vendor: every maker of flash arrays buys the same dynamic random-access memory and NAND flash that artificial-intelligence servers are bidding away. NetApp's own risk-factor language now names "our ability to manage our gross profit margins, including managing component costs." The quarter management called the trough ended July 31 and is reported after the close on September 2.
The input
Conventional memory contract prices rose an estimated 93-98% in the first quarter of 2026 and a further 58-63% in the second, with enterprise solid-state drive contract prices up 53-58% and then 48-53%, as AI server demand absorbed supply and cloud providers locked the rest up under long-term agreements. The step-up is moderating rather than reversing: TrendForce expects server memory contract prices to rise a further 13-18% in the third quarter, with NAND up 10-15%.
Year one, absorbed
NetApp, which sells ONTAP data-management software, the all-flash arrays it runs on, and first-party storage services inside Microsoft Azure, Amazon Web Services and Google Cloud, took that shock without headline damage. Revenue growth accelerated through the year — 1.2%, 2.8%, 4.4%, then 12.5% in the April quarter — and full-year non-GAAP gross margin edged up to 71.3% from 71.1%.
The strain is visible one level down. Hybrid Cloud product gross margin fell to 56.3% in fiscal 2026 from 58.0%, about 170 basis points, on $3.19bn of product revenue. And the part of the business that would insulate NetApp from component prices is small. Public Cloud segment gross margin expanded to 85.7% in the April quarter from 68.4% two years earlier, but the segment is 9.3% of revenue and 11.4% of gross profit, and its revenue grew 3.5% for the year to $688m after the divestiture of Spot by NetApp. Keystone, the on-premises storage-as-a-service offering, booked $300m of total contract value, up 34% — bookings, roughly 4% of revenue. NetApp discloses no annual recurring revenue figure of any kind.
Growth came from boxes. All-flash revenue hit a record $1,216m in the April quarter, up 18%. That is the line memory prices.
What earnings were made of
Operating leverage carried the year: GAAP operating income rose 26.8% on revenue up 5.4%, while gross profit rose 6.2%. Roughly a third of the 12.1% growth in non-GAAP earnings per share came from a 3.8% reduction in diluted shares, to 201m, funded by $950m of buybacks alongside $413m of dividends. Billings grew 6.4% in the April quarter against revenue up 12.5% — the standard signature of demand pulled forward — though chief executive George Kurian told analysts that accelerated customer decisions had only a minimal effect on the quarter.
What the shares did
The 54% advance since May 21 was not a grind: a 12.4% session on the expanded Google Distributed Cloud air-gapped agreement and a 22.4% session on the April-quarter print together compound to 37.6%, leaving 66 other sessions worth 12.1%. Price per dollar of trailing gross profit went from about 4.96x at the May flip to 7.49x, roughly 51% of expansion against 5.7% growth in gross profit dollars. It still leaves NetApp the cheapest of the three box vendors — Everpure, the former Pure Storage, trades at 13.05x trailing gross profit on 35% quarterly revenue growth, Dell at 12.06x, and Dell's own April-quarter gross margin fell to 17.75% from 21.12%.
The verdict
The software meter is real and improving, but at a shade over a tenth of gross profit it cannot explain a 54% re-rating; the hardware line can, and the hardware line is the one being taxed. Chief financial officer Wissam Jabre described the July quarter as "more or less the trough" for product gross margin, with recovery dependent on price increases taking hold. That makes the coming print a test of pricing power, not of demand.
Consensus for fiscal 2027 sits at the very top of the range NetApp itself guided, which leaves the guided margin compression no cushion. On September 2 the trough stops being a forecast.