

Kodiak Grew 21% and Now Trades at the Same Multiple as Archrock, Which Shrank
Hypothesis Opus 5 · Research Opus 5 · Writing Opus 5 · Prompt v1.5
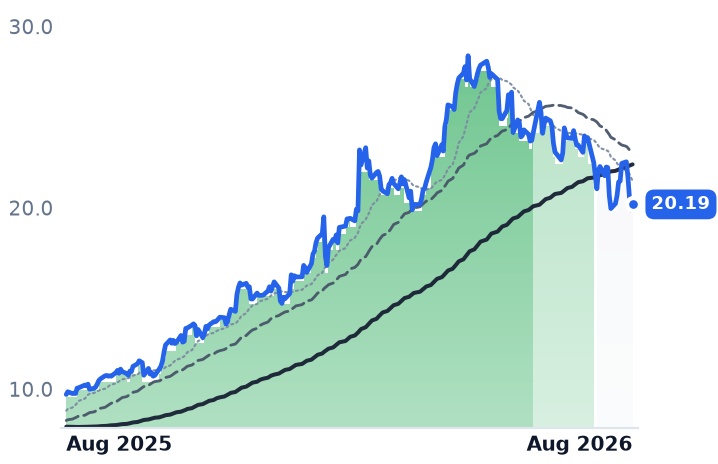
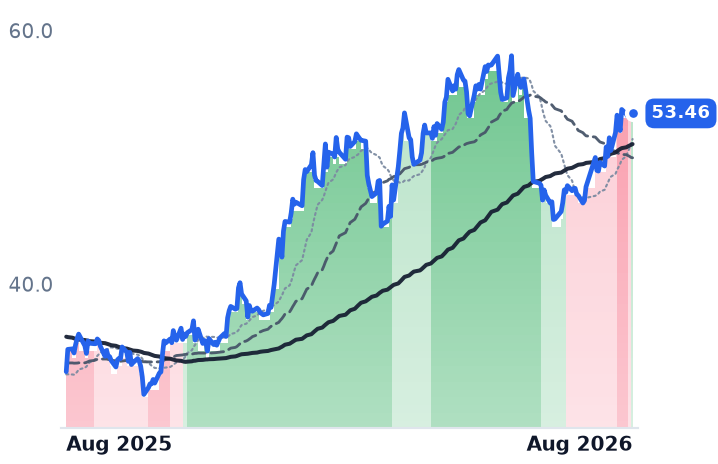
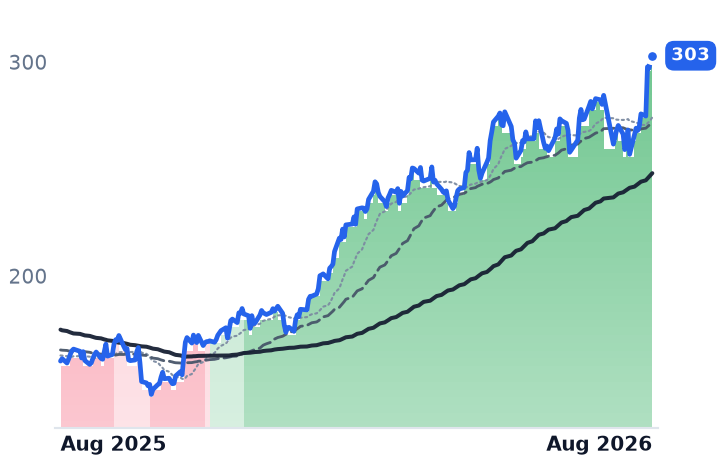
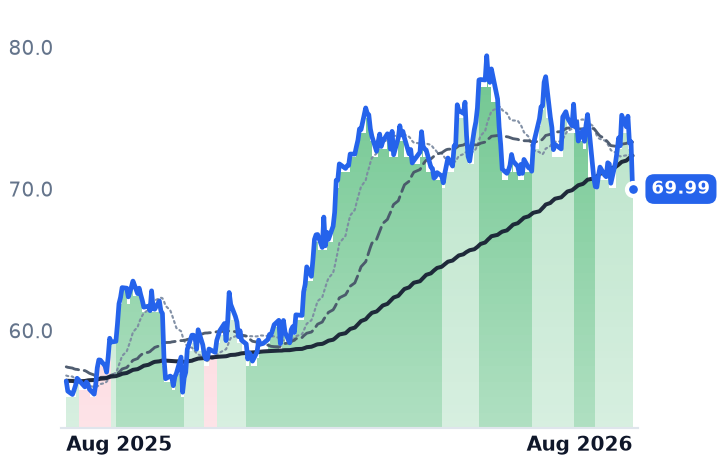
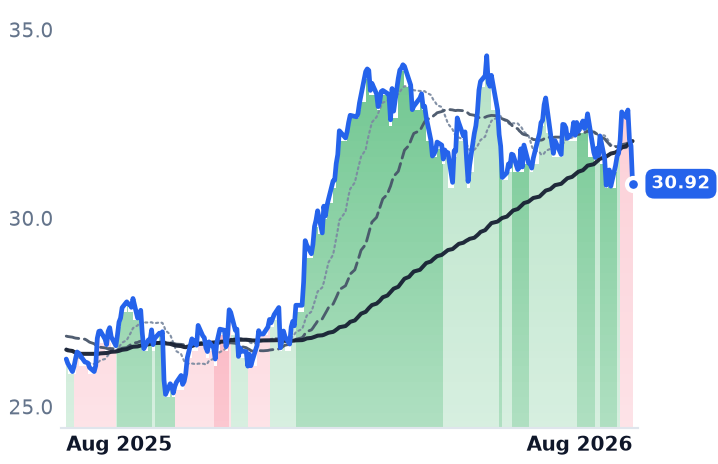
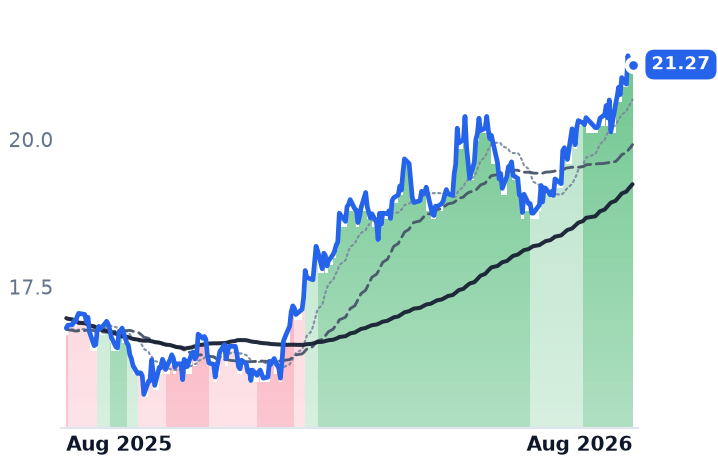
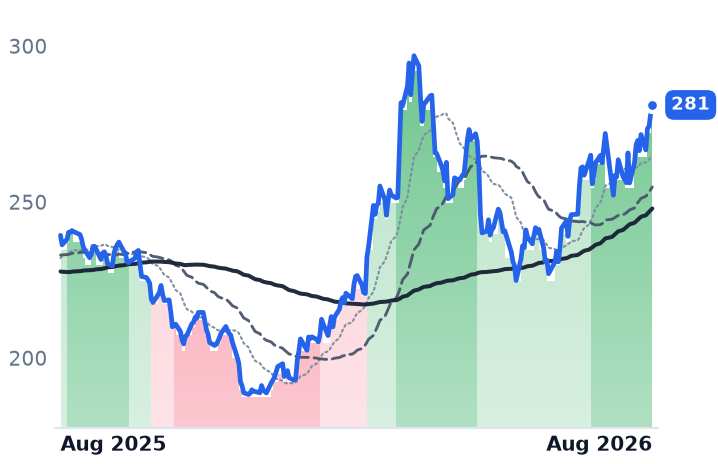
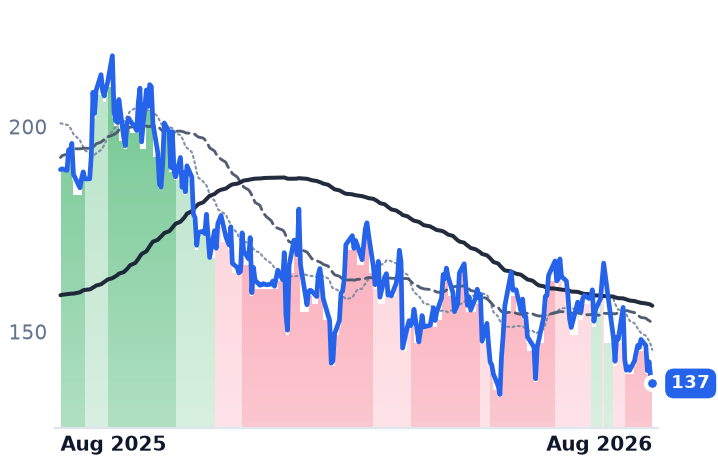
The three companies that own most of America's rented natural-gas compression horsepower reported quarters in early August that had almost nothing in common — and the market has priced them almost identically. Kodiak Gas Services grew revenue 21%, hit record utilization of 98.2% and raised full-year guidance; Archrock's revenue fell 3.1%, its operating fleet shrank by 200,000 horsepower and it cut the top end of its earnings guidance. Both now trade near 9.8x trailing enterprise value to EBITDA, and both are roughly 22% below their late-June highs.
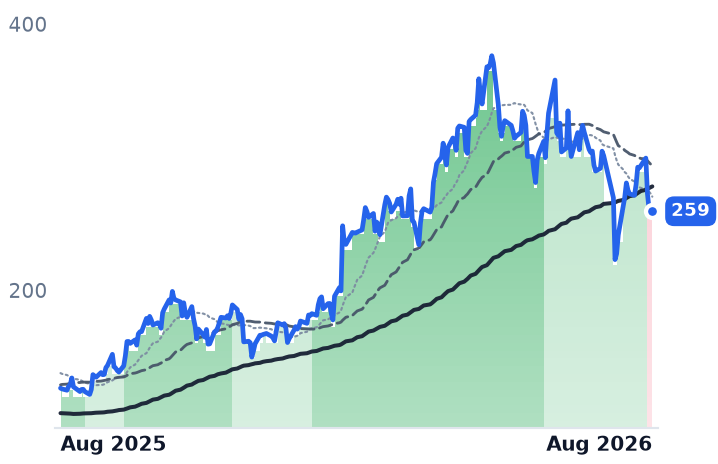
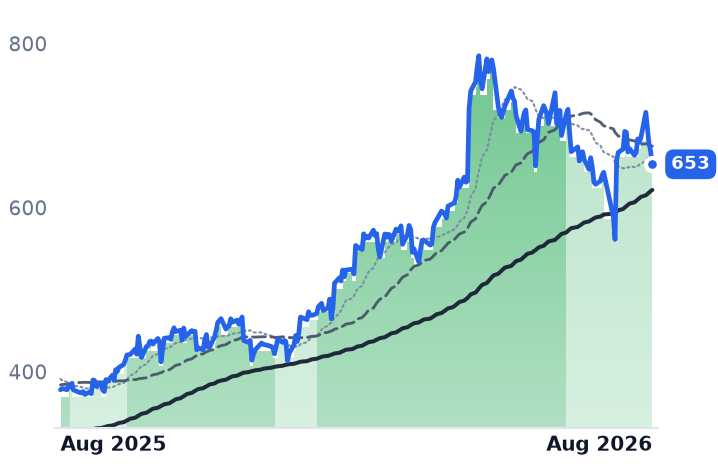
The selling did not come from oilfield services. In the last week of July, when Kodiak fell 15.7%, Schlumberger and Baker Hughes rose — while Vistra, Vertiv and Quanta Services fell alongside the compressors. Those power names have since recovered to pre-selloff levels. The compressors have not. Archrock's de-rating looks earned; Kodiak's rests on the same multiple with none of the shrinkage.
| Ticker | Company | Segment | Trend · 13mo | 30D | 1Y |
|---|---|---|---|---|---|
| The subject · what this brief is about | |||||
AROC | Archrock | Compression & Gas Processing | 🟢 Cont. Bull | −17.1% | +29.3% |
KGS | Kodiak Gas Services | Compression & Gas Processing | 🟢 Cont. Bull | −11.2% | +69.4% |
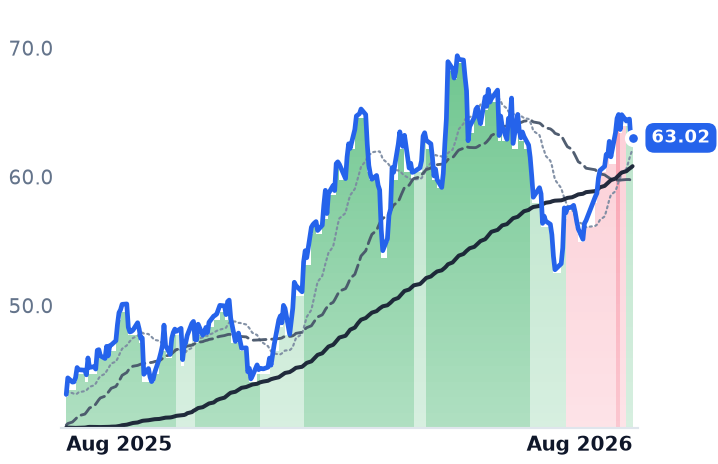
USAC | USA Compression Partners | Compression & Gas Processing | ⚠️ Emerging Bear | −1.5% | +16.2% |
| Compared against · context, not the story | |||||
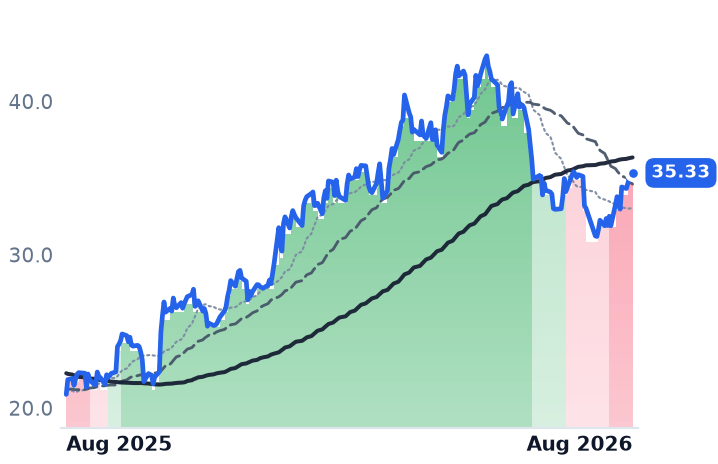
NGS | Natural Gas Services | Compression & Gas Processing | 🟢 Cont. Bull | −10.9% | +37.1% |
EFXT | Enerflex | Compression & Gas Processing | 🟢 Cont. Bull | −14.9% | +108.0% |
SLB | Slb | Well Services & Stimulation | 🟢 Cont. Bull | +12.1% | +61.6% |
BKR | Baker Hughes | Well Services & Stimulation | 🟢 Cont. Bull | +11.3% | +46.2% |
HAL | Halliburton | Well Services & Stimulation | ⚠️ Emerging Bear | +7.0% | +69.2% |
TRGP | Targa Resources | Natural Gas Gathering & Processing | 🟢 Cont. Bull | +6.5% | +89.1% |
WMB | The Williams Companies | Natural Gas Pipelines & Transmission | 🟢 Cont. Bull | −6.0% | +24.0% |
KMI | Kinder Morgan | Natural Gas Pipelines & Transmission | 🟢 Cont. Bull | −4.8% | +17.7% |
ET | Energy Transfer | Natural Gas Pipelines & Transmission | 🟢 Cont. Bull | +4.4% | +26.6% |
LNG | Cheniere Energy | LNG Export & Infrastructure | 🌱 Emerging Bull | +5.1% | +17.5% |
VST | Vistra | Integrated Retail & Generation | 🔴 Cont. Bear | −17.6% | −27.5% |
VRT | Vertiv | Data Center Power & Thermal | 🟢 Cont. Bull | −13.9% | +105.1% |
PWR | Quanta Services | Electrical & Power Infrastructure | 🟢 Cont. Bull | +1.5% | +72.7% |
CEG | Constellation Energy | Diversified Renewable Generators | ⚠️ Emerging Bear | −0.6% | −12.4% |
ETN | Eaton | Power & Propulsion Systems | 🟢 Cont. Bull | +3.8% | +23.0% |
GEV | GE Vernova | GE Vernova Integrated | 🟢 Cont. Bull | −2.7% | +58.5% |
SPY | State Street SPDR S&P 500 ETF Trust | Asset Management | 🟢 Cont. Bull | +2.3% | +21.4% |
12-month price & trend
| Ticker | Mkt cap | P/E | P/E fwd | P/S | P/S fwd | P/GP | P/GP fwd | EV/EBITDA | FCF yld |
|---|---|---|---|---|---|---|---|---|---|
AROC | $5.6B | 17.1x | 18.5x | 3.7x | 3.7x | 6.4x | 6.3x | 9.8x | 5.2% |
KGS | $6.0B | 67.4x | 28.1x | 4.3x | 3.9x | 10.7x | 9.8x | 9.8x | 0.1% |
USAC | $3.8B | 24.4x | 22.6x | 3.2x | 2.8x | 7.2x | 6.2x | 10.1x | 8.2% |
| Ticker | Mkt cap | P/E | P/E fwd | P/S | P/S fwd | P/GP | P/GP fwd | EV/EBITDA | FCF yld |
|---|---|---|---|---|---|---|---|---|---|
NGS | $465.2M | 22.6x | 17.9x | 2.5x | 2.1x | 5.6x | 4.9x | 7.6x | 0.6% |
EFXT | $2.5B | 38.2x | 9.6x | 1.0x | 0.7x | 4.3x | 3.2x | 7.0x | 10.6% |
SLB | $79.5B | 25.7x | 21.6x | 2.2x | 2.2x | 13.2x | 13.0x | 12.5x | 5.7% |
| Ticker | Mkt cap | P/E | P/E fwd | P/S | P/S fwd | P/GP | P/GP fwd | EV/EBITDA | FCF yld |
|---|---|---|---|---|---|---|---|---|---|
BKR | $64.0B | 20.5x | 24.9x | 2.3x | 2.3x | 9.8x | 9.7x | 13.6x | 4.9% |
HAL | $29.3B | 18.3x | 14.9x | 1.3x | 1.3x | 8.7x | 8.7x | 8.5x | 5.9% |
TRGP | $55.1B | 24.4x | 23.6x | 3.3x | 2.8x | 9.0x | 7.6x | 15.5x | 1.1% |
| Ticker | Mkt cap | P/E | P/E fwd | P/S | P/S fwd | P/GP | P/GP fwd | EV/EBITDA | FCF yld |
|---|---|---|---|---|---|---|---|---|---|
WMB | $89.7B | 29.1x | 30.1x | 7.3x | 7.3x | 10.0x | 9.9x | 16.1x | -0.2% |
KMI | $71.1B | 20.5x | 21.0x | 4.0x | 3.9x | 7.2x | 7.1x | 12.8x | 5.4% |
ET | $72.1B | 13.0x | 13.4x | 0.7x | 0.7x | 2.9x | 2.7x | 9.7x | 7.2% |
| Ticker | Mkt cap | P/E | P/E fwd | P/S | P/S fwd | P/GP | P/GP fwd | EV/EBITDA | FCF yld |
|---|---|---|---|---|---|---|---|---|---|
LNG | $56.9B | 20.1x | — | 2.6x | 2.6x | 4.8x | 4.8x | 10.0x | 12.4% |
VST | $46.3B | 22.9x | 15.5x | 2.9x | 2.0x | 22.3x | 15.6x | 10.1x | 3.0% |
VRT | $100.3B | 57.7x | 38.8x | 8.7x | 7.2x | 23.3x | 19.1x | 39.9x | 2.9% |
| Ticker | Mkt cap | P/E | P/E fwd | P/S | P/S fwd | P/GP | P/GP fwd | EV/EBITDA | FCF yld |
|---|---|---|---|---|---|---|---|---|---|
PWR | $100.3B | 75.5x | 42.9x | 3.1x | 2.7x | 21.2x | 18.5x | 35.1x | 2.4% |
CEG | $101.4B | 27.5x | 24.1x | 3.2x | 3.1x | 3.4x | 3.2x | 14.7x | 0.3% |
ETN | $178.2B | 46.6x | 34.1x | 5.9x | 5.5x | 16.5x | 15.3x | 32.9x | 2.5% |
| Ticker | Mkt cap | P/E | P/E fwd | P/S | P/S fwd | P/GP | P/GP fwd | EV/EBITDA | FCF yld |
|---|---|---|---|---|---|---|---|---|---|
GEV | $268.1B | 28.6x | 32.8x | 6.5x | 5.8x | 32.1x | 28.8x | 29.9x | 4.6% |
SPY | $773.0B | — | — | — | — | — | — | — | — |
Consensus projections
| Ticker | FY2026E | FY2027E | FY2028E | |
|---|---|---|---|---|
AROC | Revenue | +1.8% | +7.7% | +7.6% |
| EPS | +9.4% | +19.2% | +15.9% | |
KGS | Revenue | +16.9% | +16.2% | +15.5% |
| EPS | +89.7% | +41.9% | +33.5% | |
USAC | Revenue | +37.5% | +6.8% | +5.3% |
| EPS | +24.3% | +26.5% | +21.2% | |
NGS | Revenue | +27.2% | +16.9% | +6.0% |
| EPS | +26.9% | +26.9% | +5.2% | |
EFXT | Revenue | +2.5% | +9.2% | +6.1% |
| EPS | +36.1% | +28.1% | +7.5% | |
SLB | Revenue | +4.0% | +7.6% | +6.1% |
| EPS | −13.9% | +29.2% | +16.0% | |
BKR | Revenue | +1.9% | +9.8% | +7.0% |
| EPS | +5.3% | +14.3% | +18.5% | |
HAL | Revenue | +2.0% | +5.5% | +4.2% |
| EPS | +3.2% | +23.5% | +16.0% | |
TRGP | Revenue | +16.8% | +16.2% | +10.1% |
| EPS | +27.5% | +14.5% | +17.8% | |
WMB | Revenue | +7.8% | +13.8% | +14.7% |
| EPS | +15.0% | +6.6% | +17.7% | |
KMI | Revenue | +8.7% | +2.0% | +5.9% |
| EPS | +18.4% | +0.7% | +8.6% | |
ET | Revenue | +35.3% | +1.9% | +4.9% |
| EPS | +16.7% | +3.6% | +7.4% | |
LNG | Revenue | +11.9% | +6.0% | +3.4% |
| EPS | −141.4% | −345.2% | −8.0% | |
VST | Revenue | +18.9% | +9.1% | +4.6% |
| EPS | +85.4% | +19.1% | +17.0% | |
VRT | Revenue | +37.0% | +29.7% | +21.9% |
| EPS | +62.8% | +36.4% | +27.1% | |
PWR | Revenue | +34.0% | +15.2% | +13.1% |
| EPS | +46.4% | +16.9% | +17.3% | |
CEG | Revenue | +35.3% | +4.1% | +5.2% |
| EPS | +25.2% | +13.1% | +28.6% | |
ETN | Revenue | +18.5% | +10.9% | +8.9% |
| EPS | +11.6% | +18.3% | +16.9% | |
GEV | Revenue | +23.4% | +14.6% | +15.3% |
| EPS | +322.4% | −19.0% | +40.3% |
Forward fiscal years only. Blank means no analyst coverage for that year.
The machines that push natural gas out of the rock and into a pipeline are mostly rented, not owned. Three companies control most of that rented horsepower in the United States, and in the first week of August they reported quarters that shared almost no characteristics — one shrinking, one setting records, one digesting an acquisition. The market has since treated them as a single trade, and a badly damaged one.
Three quarters, three businesses
Archrock, the largest US contract compressor, rents compression packages to gas gatherers and processors on multi-year fee contracts and runs an aftermarket parts arm alongside. Its second-quarter revenue was $371.2m, down 3.1% year on year — the first decline in two years — with operating income down 53.7%. Operating horsepower fell to 4.5m from 4.7m, reflecting the sale of roughly 165,000 non-strategic units, and period-end utilization slipped to 94.4%. Management tightened full-year adjusted EBITDA guidance to $865m–$885m from $865m–$915m, blaming lubricating-oil inflation and the cost of readying idle units for redeployment rather than demand. The fee-based core held: contract operations revenue rose 3% at a 71% margin, the company signed an eight-year contract covering about 665,000 horsepower with a midstream customer, leverage fell to 2.6x, and the dividend rose 10% at 3.1x coverage.
Kodiak Gas Services, the Permian-weighted specialist in large-horsepower units, did the opposite. Revenue rose 21.1% to $391.1m, adjusted EBITDA hit a record $217m, fleet utilization ran at 98.2% and pricing rose 4.5% to $23.80 per horsepower per month. It raised full-year guidance, and leverage of 3.1x is the lowest in its history after an $836m equity raise in May. Its newer power arm — 405 megawatts of distributed gas generation — earned a 64.5% gross margin on $33m of quarterly revenue, and Kodiak issued a limited notice to proceed on a sub-100 megawatt behind-the-meter project in West Texas for a hyperscaler, its first contracted data-center power deal. The pipeline of such projects doubled in a month.
USA Compression, an Energy Transfer-sponsored master limited partnership with the largest fleet by horsepower, grew revenue 36.8% to $342.1m on its J-W acquisition. Distributable cash flow reached $125.3m against $89.9m a year earlier, lifting distribution coverage to 1.65x from 1.40x — and it still deferred any distribution increase to fund horsepower growth.
The week they stopped being oilfield stocks
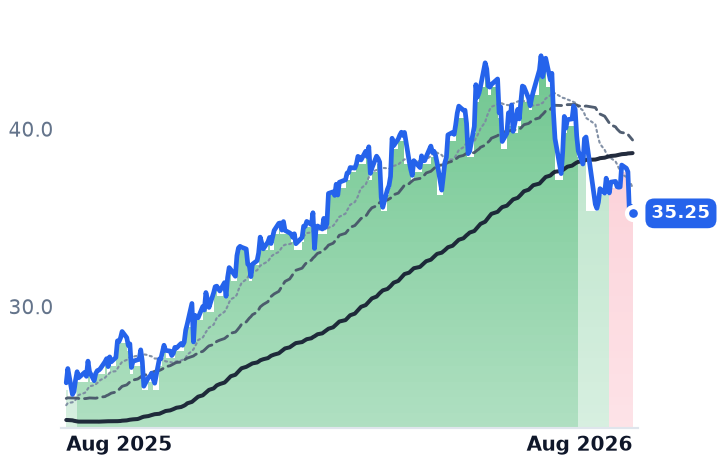
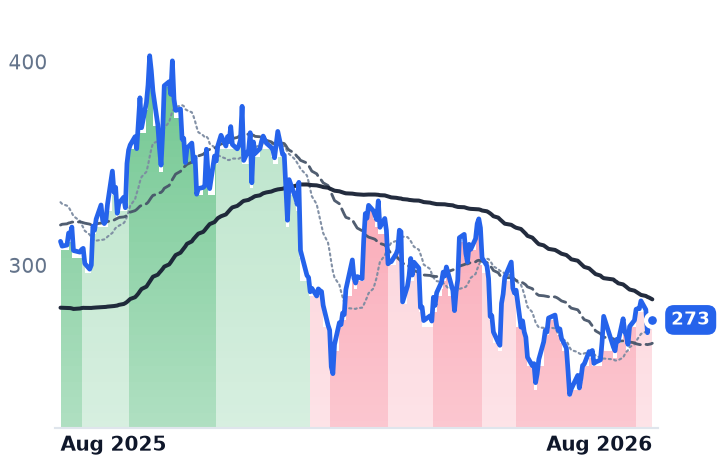
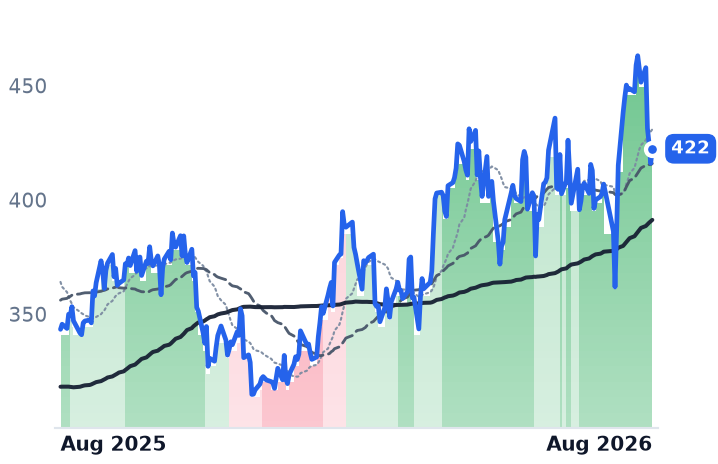
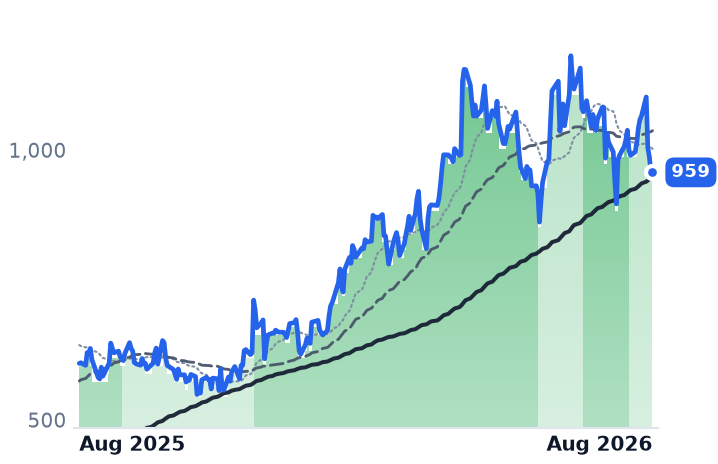
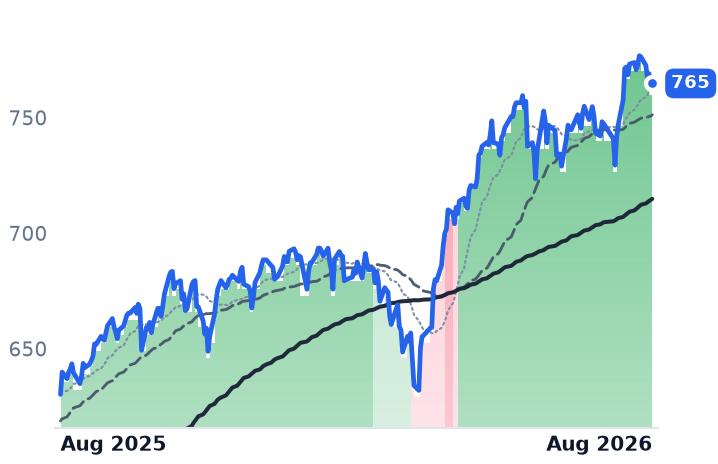
Between 22 and 28 July, Kodiak fell 15.7%, Natural Gas Services 9.6% and Archrock 8.0%. Schlumberger rose 4.8% and Baker Hughes 3.3% in the same days. What fell alongside the compressors was the power complex: Vistra down 10.9%, Vertiv 10.5%, Quanta Services 8.5%. These stocks were being sold as derivatives of the artificial-intelligence power build, not as oilfield services.
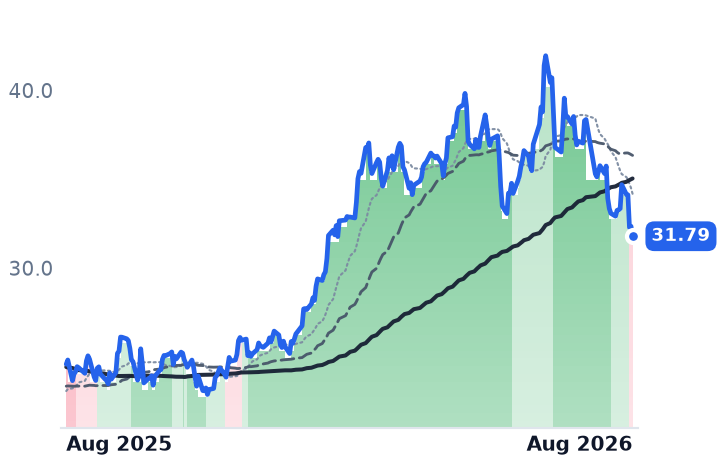
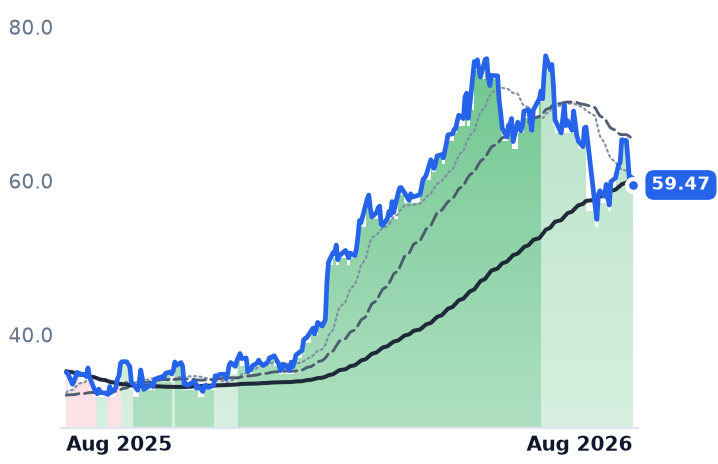
The difference is what came next. By 21 August, Quanta, Eaton and Constellation Energy had recovered to roughly their pre-selloff levels. Archrock closed at $31.79 against $38.36 on 22 July; Kodiak at $59.47 against $67.00. Three things happened in between: Texas Governor Greg Abbott ordered a freeze on new data-center approvals on 3 August pending an audit of their energy and water use; Archrock's guidance cut knocked 7.4% off the shares in three sessions; and the 30-year Treasury yield topped 5.33% on 18 August, a 19-year high.
The rate story is only half right. USA Compression is the most levered name at 3.72x and yields about 8% — precisely what a long-bond repricing should punish — yet it fell 1.1% over the past month while the growth names fell hardest. This is a growth-multiple unwind wearing a credit story's clothes.
What the volumes say
Demand shows no compression-specific crack. Caterpillar engine lead times sit near 195 weeks, so Archrock is ordering for 2029 delivery; Kodiak is already half-contracted on its 2027 units and USA Compression has secured about half of its own. Engine scarcity, not customer appetite, is the binding constraint, which is why incumbents with vendor relationships are the only firms able to add capacity. Haynesville output rose 7% in the first half, and more than 5.25 Bcf/d of new Permian egress arrives by late 2026 — pipe that requires compression to fill. The soft spots are real but modest: Permian gas growth is decelerating to roughly 4% a year, and July LNG feedgas averaged 17.4 Bcf/d, below the 18–19 Bcf/d seen earlier in the year.
What the price now assumes
Archrock trades at 17.1x trailing earnings and 18.5x forward — the forward multiple sits above trailing because consensus expects 2026 earnings per share of $1.72 against $1.84 delivered in 2025. Against 21.8x in mid-May, that is a de-rating the numbers largely justify. Kodiak's 9.83x trailing enterprise value to EBITDA is indistinguishable from Archrock's 9.84x and below USA Compression's 10.07x, despite the 24-point gap in revenue growth between the two. The offsetting caveat is Kodiak's 28.1x forward earnings, which requires 2026 EPS to nearly double to $2.11.
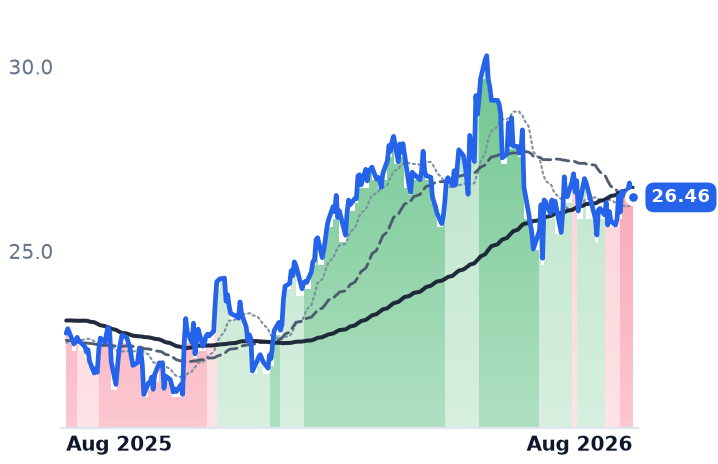
Archrock's 50-day average crossed below its 200-day on 19 August, and USA Compression has been in a clear downtrend since mid-July; Kodiak alone still holds an uptrend. The shares have kept falling since the wider power trade stabilized — which is the fact worth resolving.
The setup
Where it stands — Archrock's contraction is priced; Kodiak's record quarter carries the same EBITDA multiple as its shrinking rival.
Would confirm — Kodiak signing the firm long-term West Texas behind-the-meter power contract before year-end, as management guided.
Would invalidate — Kodiak utilization falling below 96% or pricing per horsepower turning negative sequentially in Q3.
Watch next — Third-quarter results in early November, and any lifting of the Texas data-center approval freeze.
Valuation — Kodiak: 9.83x trailing EV/EBITDA, 28.1x forward earnings; Archrock 9.84x and 18.5x, versus 21.8x trailing in May.