

Two-Fifths of Brookfield Renewable's Record Quarter Came From Selling Assets, Not Power
Hypothesis Opus 5 · Research Opus 5 · Writing Opus 5 · Prompt v1.5
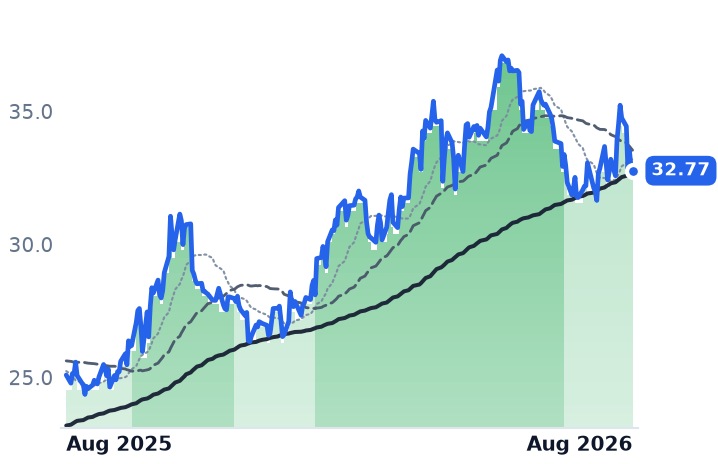
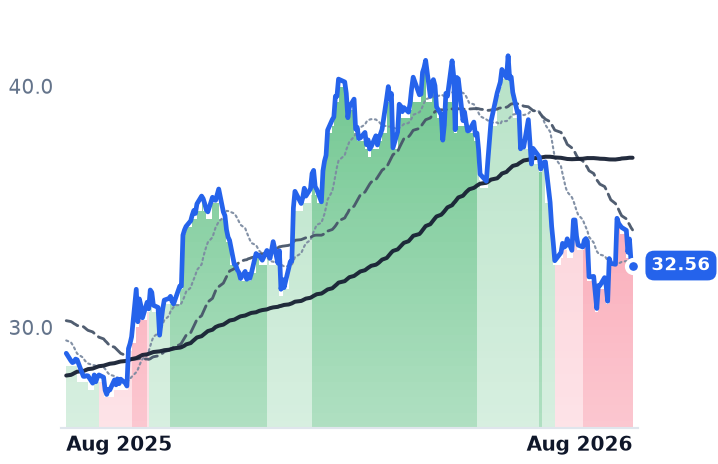
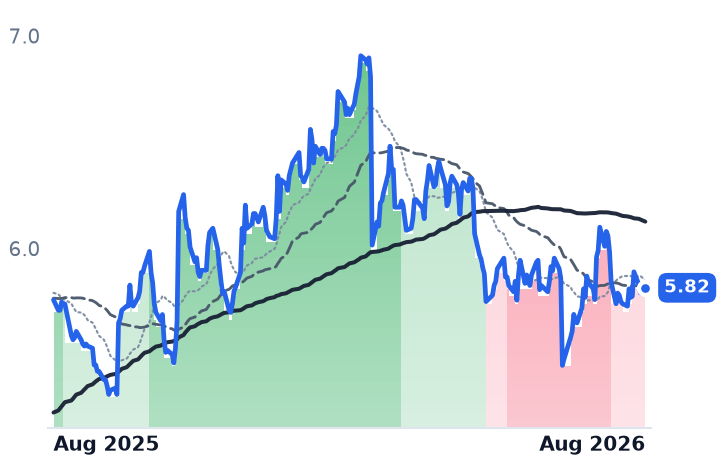
Brookfield Renewable's units are up 29% over twelve months on a story of AI-driven power scarcity. But roughly $175m of the $421m of funds from operations it called a record in the second quarter were gains on asset sales, and its accounting revenue actually fell 1.8%. Clearway Energy is the mirror image: revenue up 22.7% with operating income up 36.5%, three Texas wind contracts reset past 2040 at better prices — and the shares down 16.5% in three months, to 0.72 times book value.
What links them is not demand. It is the long bond. The 30-year Treasury yield touched a 19-year high on 18 August, the day Brookfield had its second-worst session since February and NextEra's uptrend broke. Constellation raised guidance and fell too. The de-rating is a discount-rate event, and neither developer yet has a dated, quantified hyperscaler contract to offset it.
| Ticker | Company | Segment | Trend · 13mo | 30D | 1Y |
|---|---|---|---|---|---|
| The subject · what this brief is about | |||||
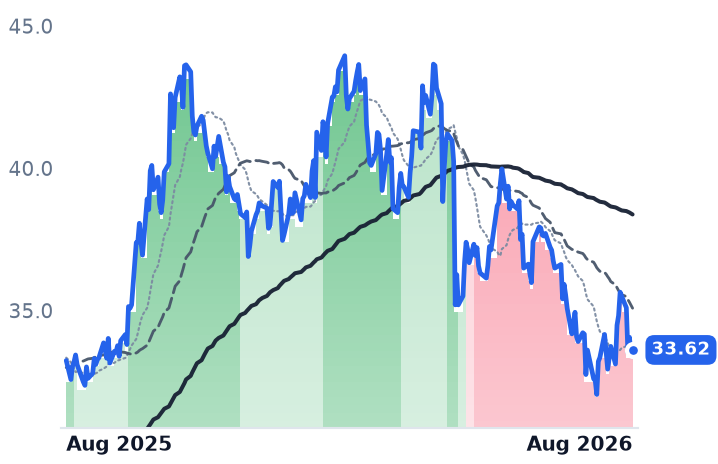
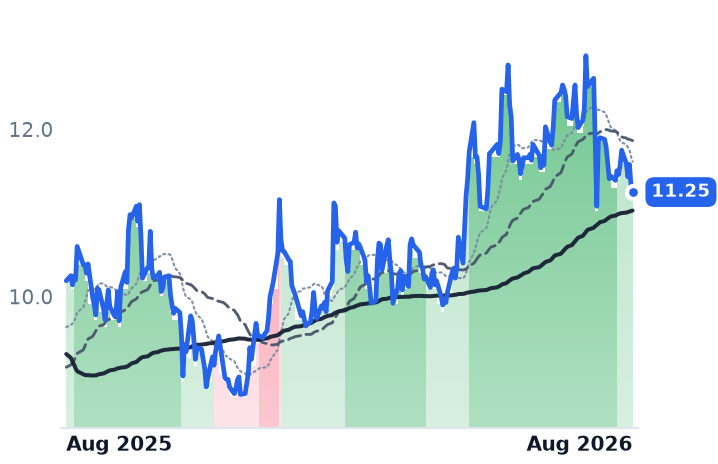
BEP | Brookfield Renewable Partners | Diversified Renewable Generators | 🟢 Cont. Bull | −0.9% | +30.6% |
CWEN | Clearway Energy | Wind & Solar Developers | ⚠️ Emerging Bear | −3.0% | +12.6% |
| Compared against · context, not the story | |||||
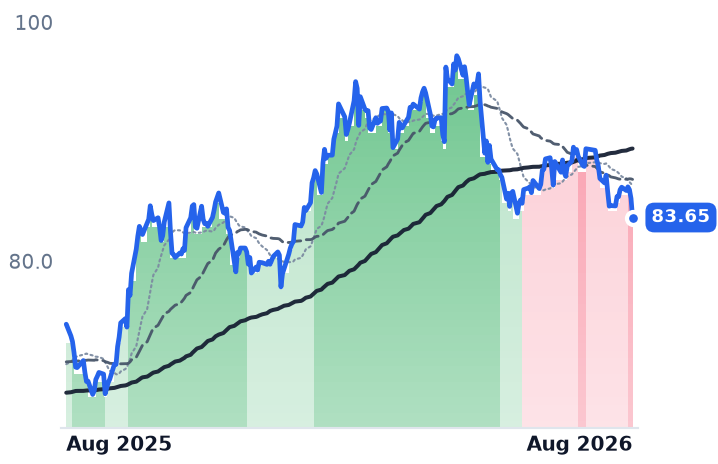
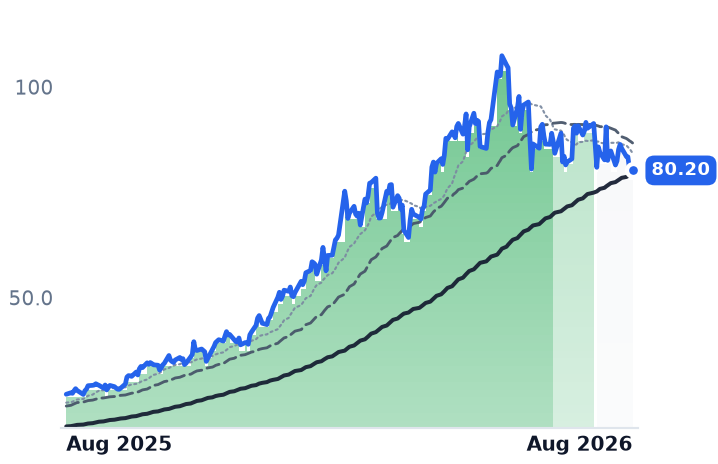
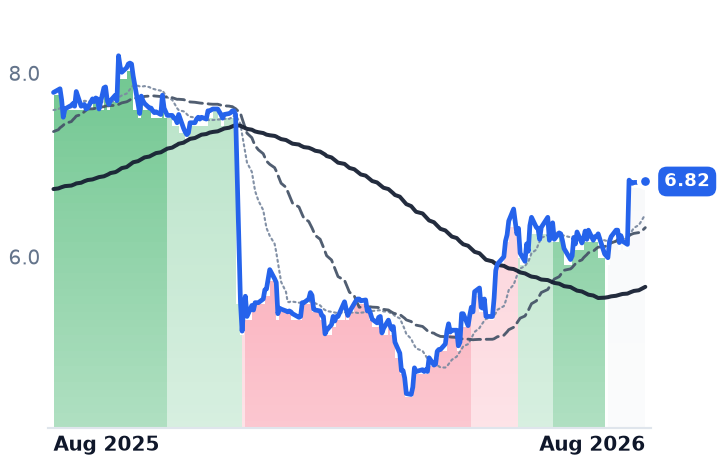
NEE | NextEra Energy | Vertically Integrated Utilities | ⚠️ Emerging Bear | −6.3% | +12.0% |
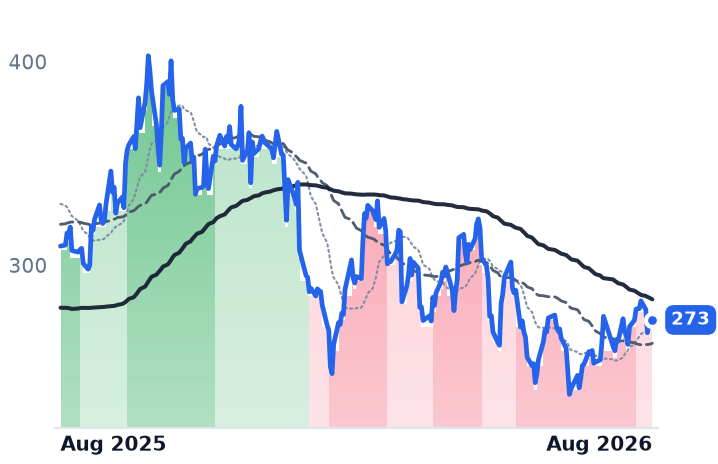
CEG | Constellation Energy | Diversified Renewable Generators | ⚠️ Emerging Bear | +5.1% | −11.7% |
BEPC | Brookfield Renewable | Diversified Renewable Generators | ⚠️ Emerging Bear | +0.0% | +1.1% |
XIFR | XPLR Infrastructure | Renewable & Infrastructure Assets | 🟢 Cont. Bull | −10.1% | +10.4% |
ENLT | Enlight Renewable Energy | Wind & Solar Developers | 🟢 Cont. Bull | −11.1% | +196.3% |
RNW | ReNew Energy Global | Wind & Solar Developers | 🌱 Emerging Bull | +9.1% | −12.5% |
AQN | Algonquin Power & Utilities | Diversified Renewable Generators | ⚠️ Emerging Bear | −2.9% | +1.0% |
12-month price & trend
| Ticker | Mkt cap | P/E | P/E fwd | P/S | P/S fwd | P/GP | P/GP fwd | EV/EBITDA | FCF yld |
|---|---|---|---|---|---|---|---|---|---|
BEP | $10.0B | 71.2x | — | 1.6x | 1.5x | 6.5x | 6.1x | 9.9x | -47.1% |
CWEN | $6.7B | 42.8x | — | 4.3x | 4.1x | 8.0x | 7.7x | 14.6x | 10.0% |
NEE | $174.5B | 18.7x | 20.8x | 6.0x | 5.6x | 8.4x | 7.8x | 15.9x | -5.8% |
| Ticker | Mkt cap | P/E | P/E fwd | P/S | P/S fwd | P/GP | P/GP fwd | EV/EBITDA | FCF yld |
|---|---|---|---|---|---|---|---|---|---|
CEG | $101.4B | 27.5x | 24.1x | 3.2x | 3.1x | 3.4x | 3.2x | 14.7x | 0.3% |
BEPC | $5.2B | n/m | — | 1.3x | 0.9x | 2.7x | 1.9x | n/m | -10.6% |
XIFR | $1.1B | 16.6x | 8.2x | 0.9x | 0.8x | 5.0x | 4.5x | 8.9x | -60.4% |
| Ticker | Mkt cap | P/E | P/E fwd | P/S | P/S fwd | P/GP | P/GP fwd | EV/EBITDA | FCF yld |
|---|---|---|---|---|---|---|---|---|---|
ENLT | $12.0B | 123.3x | 190.8x | 14.6x | 15.2x | 26.7x | 27.8x | 24.3x | -22.3% |
RNW | $1.9B | 15.6x | — | 1.4x | — | 1.8x | — | 9.5x | -7.6% |
AQN | $4.5B | 32.3x | 16.7x | 1.8x | 1.7x | 3.9x | 3.8x | 12.1x | -1.3% |
Consensus projections
| Ticker | FY2026E | FY2027E | FY2028E | |
|---|---|---|---|---|
BEP | Revenue | +3.8% | +9.0% | −3.4% |
| EPS | +14.0% | −11.7% | +9.4% | |
CWEN | Revenue | +14.8% | +10.8% | +13.4% |
| EPS | −133.6% | −152.5% | +132.7% | |
NEE | Revenue | +10.4% | +9.9% | +8.6% |
| EPS | +9.0% | +9.2% | +8.3% | |
CEG | Revenue | +35.3% | +4.1% | +5.2% |
| EPS | +25.2% | +13.1% | +28.6% | |
BEPC | Revenue | +2.4% | +18.4% | +2.5% |
| EPS | +283.7% | −94.0% | +510.2% | |
XIFR | Revenue | +0.1% | +6.2% | +2.2% |
| EPS | −999.6% | −27.2% | −79.4% | |
ENLT | Revenue | +39.1% | +42.6% | — |
| EPS | −47.1% | +66.7% | — | |
RNW | Revenue | +42.1% | +7.6% | +29.3% |
| EPS | +1367.7% | +1.4% | +372.2% | |
AQN | Revenue | +9.3% | +4.3% | +4.1% |
| EPS | +10.6% | +15.1% | +8.6% |
Forward fiscal years only. Blank means no analyst coverage for that year.
Brookfield Renewable Partners — a Toronto-based partnership that owns hydroelectric, wind, solar and storage plants across the Americas and Europe, and controls 51% of the reactor builder Westinghouse — told investors on 31 July it had earned record funds from operations of $421m in the second quarter, up 13% from a year earlier. Management confirmed that about $175m of that figure was "other income" in the hydro segment: gains on developed assets and non-core disposals. Roughly two-fifths of the record, in other words, came from selling plants rather than running them.
The accounting statements tell the plainer version. Revenue fell 1.8% to $1.66bn. Gross margin dropped to 21.3% from 58.7% a year earlier, operating income declined 15%, and the partnership posted a net loss of $101m — its fifth negative quarter in eight. That is why the 71.2x trailing price/earnings ratio is unusable and why unitholders are asked to look at funds from operations instead. At $2.14 per unit over the last twelve months, the units change hands at about 15.3 times a measure that is currently part non-recurring.
The recycling is not hidden or improper — Brookfield's model is to build, sell high and redeploy, and it agreed or closed $2.2bn of disposals in the quarter against $5bn deployed or committed to growth. It commissioned 1.3 gigawatts and signed power purchase agreements on 2.6 GW. But the growth is being funded expensively: the partnership priced C$750m of green bonds on 20 August, the ten-year tranche at 4.949%.
Clearway is the inverse trade
Clearway Energy owns roughly 5,000 net megawatts of installed US wind and solar plus about 2,500 MW of gas-fired capacity, all sold forward under long-term contracts, and is run with 60 employees. Its second-quarter revenue rose 22.7% to $481m, the third straight quarter of accelerating growth, while operating income climbed 36.5% to $116m. In June it restructured the contracts on all three of its Texas wind projects, extending them beyond 2040 at better pricing. The one real deterioration is a weather-driven cut to 2026 cash available for distribution, to $430-470m from $470-510m, which management attributes to a poor first-half wind resource and calls transitory; it reaffirmed a target of $2.70 or better per share for 2027.
The shares are down 16.5% over three months and sit at 0.72 times book value — below the carrying value of a fleet that is mostly contracted, operating generation. Clearway's trend broke on 20 July, a fortnight before the guidance cut, and the 5 August cut session does not rank among its 25 worst days since February. Its five worst sessions of the period contain no earnings date at all.
The variable is the 30-year Treasury
That is the tell. The long bond reached about 5.31% on 17 August, its highest since 2007, and topped 5.33% the next day on deficit issuance and sticky inflation. Clearway's declared quarterly dividend annualizes to $1.8408, a yield near 5.7% — leaving a spread over the 30-year of well under a percentage point. Brookfield's second-worst session since February, a 4.76% drop, was 18 August itself.
The controls confirm this is not a developer problem. NextEra Energy, which pairs the Florida Power & Light utility with the largest US renewables developer, grew second-quarter revenue 12.4%, lifted its backlog to 35.1 GW and is recontracting output at roughly a $20/MWh premium — and its uptrend broke on 18 August. Constellation Energy, the biggest unregulated nuclear operator in the country, raised full-year guidance to $11.50-12.50 a share and is down 11.9% over twelve months. Whatever is repricing these cash flows is not the demand line.
Policy adds a dated cliff. The One Big Beautiful Bill Act terminated the production and investment tax credits for wind and solar projects beginning construction after 4 July 2026 and placed in service after 2027, while a federal court vacated the Treasury guidance narrowing the 5% safe harbor in June — with appellate review likely to outlast the deadline it governs.
And the AI offtake everyone is underwriting remains mostly promissory. Brookfield's Microsoft agreement commits $10bn to more than 10.5 GW between 2026 and 2030, but it is a framework with no disclosed delivery split. Clearway's 17-plus GW of co-located data-center complexes sit at the sponsor, with its own first investment window around 2030. The demand does show up in prices — North American solar contracts hit $64.49/MWh in the first quarter, an index high — just not yet in either company's contracted cash.
On multiples, Brookfield is the cheapest of the four on enterprise value to EBITDA at 9.85x, against Clearway at 14.6x, Constellation at 14.7x and NextEra at 15.9x. The catch is that the support rests on a metric propped up by disposals. Clearway's is the cleaner arithmetic: about 12.1 times its reaffirmed 2027 distributable-cash target, on a trailing free-cash-flow yield of 10.0%.
The setup
Where it stands — Clearway's operations are improving into a falling share price; Brookfield's units hold up on earnings quality that is partly non-recurring. Would confirm — Brookfield's next quarter showing FFO per unit growth with disposal gains below 10% of the total. Would invalidate — A retreat in the 30-year Treasury below 4.75% that leaves both names still falling. Watch next — Brookfield unitholders vote on the one-for-one BEP/BEPC merger on 14 October; NextEra shareholders vote 3 September on the Dominion issuance. Valuation — Brookfield 9.85x trailing EV/EBITDA and ~15.3x last-twelve-month FFO per unit; Clearway 0.72x book, 12.1x its 2027 cash target.