

Private Capital's Slump Diverges From Its Own Earnings
Hypothesis Opus 5 · Research Sonnet 5 · Writing Sonnet 5 · Prompt v1.1
Alternative & Private Capital managers are down ~24% over a year while Diversified Asset Managers are up ~28%, but for Blackstone, KKR, Ares and Blue Owl the price damage has outrun what's visible in core fee earnings — a possible dislocation — while Carlyle's decline matches genuine earnings deterioration. Neither cohort's trend signal has confirmed the past month's bounce.
| Ticker | Company | Segment | Trend | 30D | 1Y |
|---|---|---|---|---|---|
APO | Apollo Global Management | Alternative & Private Capital | 🔴 Cont. Bear | +2.8% | −10.5% |
ARES | Ares Management | Alternative & Private Capital | 🔴 Cont. Bear | +5.1% | −30.3% |
BX | Blackstone | Alternative & Private Capital | 🔴 Cont. Bear | +3.5% | −23.5% |
KKR | KKR | Alternative & Private Capital | 🔴 Cont. Bear | +5.7% | −29.8% |
OWL | Blue Owl Capital | Alternative & Private Capital | 🔴 Cont. Bear | +8.5% | −44.3% |
CG | The Carlyle | Alternative & Private Capital | ⚠️ Emerging Bear | +4.5% | −22.4% |
HLNE | Hamilton Lane Incorporated | Alternative & Private Capital | 🔴 Cont. Bear | +7.8% | −40.3% |
GCMG | GCM Grosvenor | Alternative & Private Capital | 🌱 Emerging Bull | −8.3% | +7.5% |
BLK | BlackRock | Diversified Asset Managers | ⚠️ Emerging Bear | +7.8% | −0.8% |
AMG | Affiliated Managers | Diversified Asset Managers | 🟢 Cont. Bull | +2.8% | +71.0% |
APAM | Artisan Partners Asset Management | Diversified Asset Managers | 🔴 Cont. Bear | +8.5% | −7.5% |
BEN | Franklin Resources | Diversified Asset Managers | 🟢 Cont. Bull | −1.7% | +40.5% |
FHI | Federated Hermes | Diversified Asset Managers | 🟢 Cont. Bull | +3.5% | +20.7% |
IVZ | Invesco | Diversified Asset Managers | 🟢 Cont. Bull | +6.4% | +44.8% |
JHG | Janus Henderson | Diversified Asset Managers | 🟢 Cont. Bull | — | +22.6% |
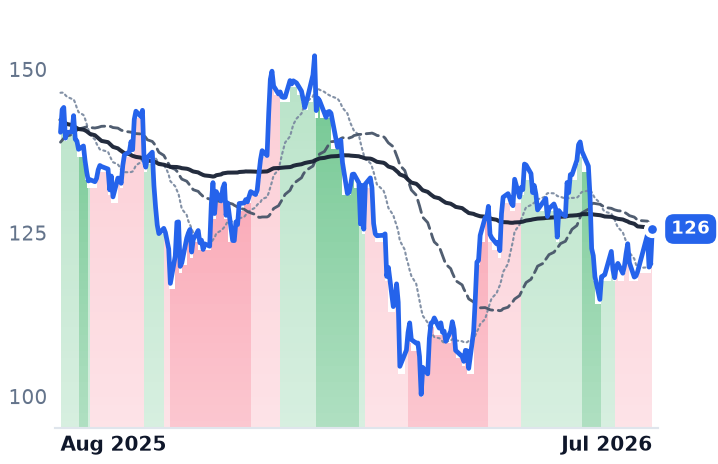
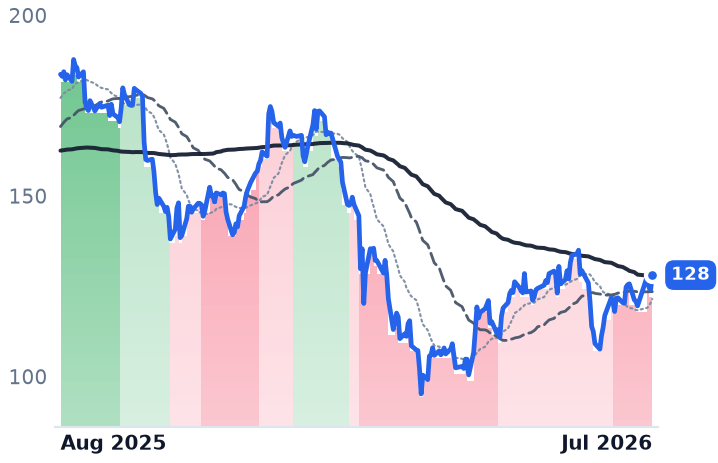
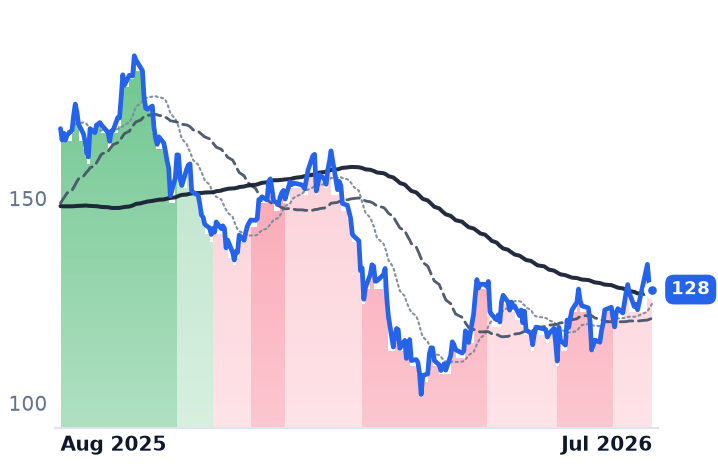
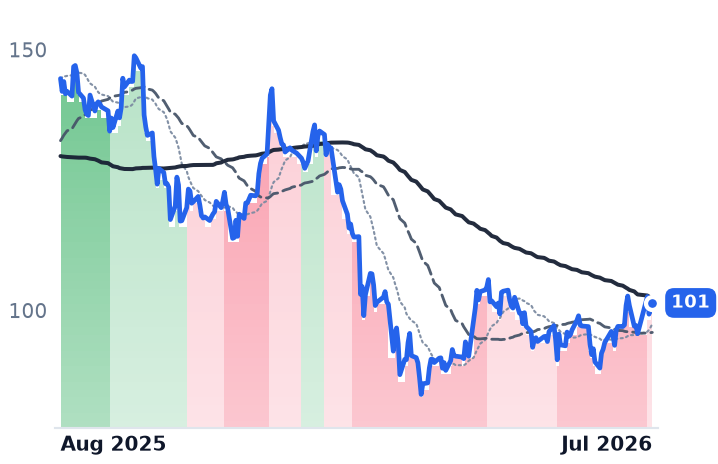
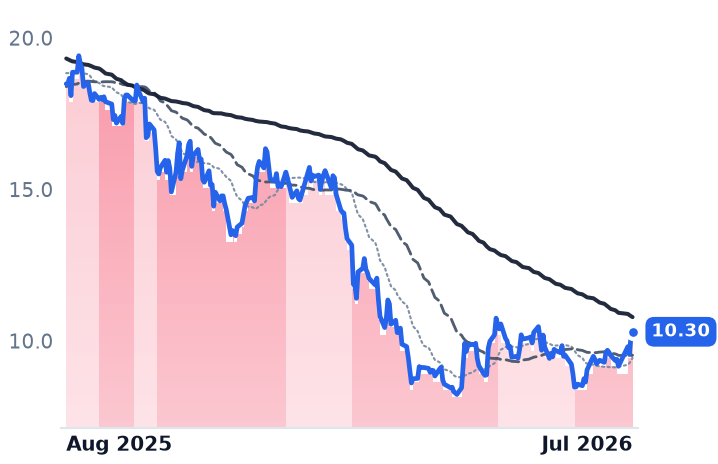
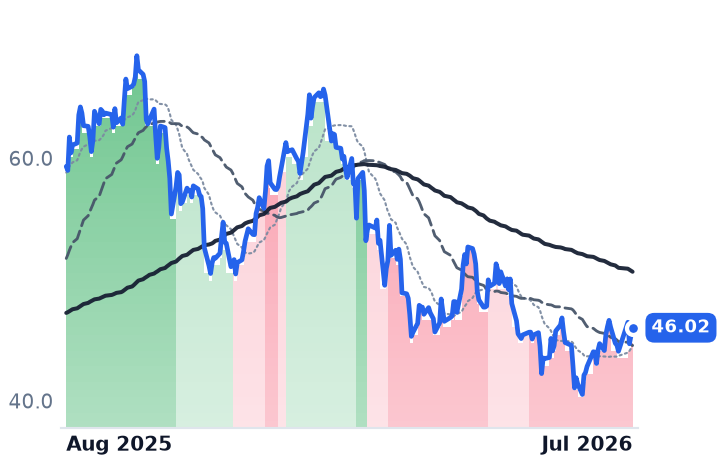
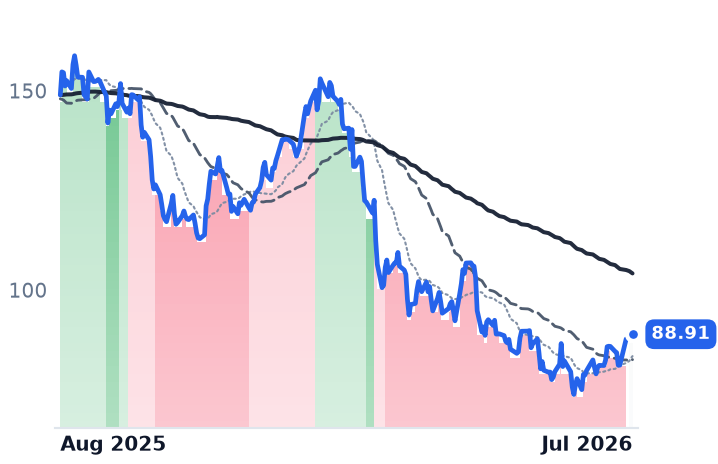
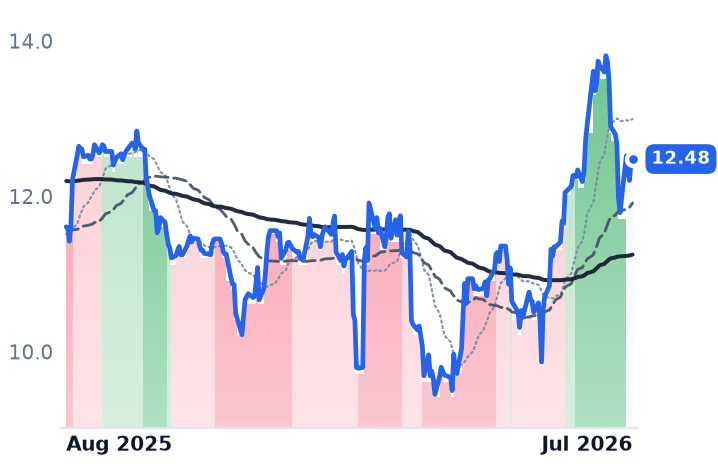
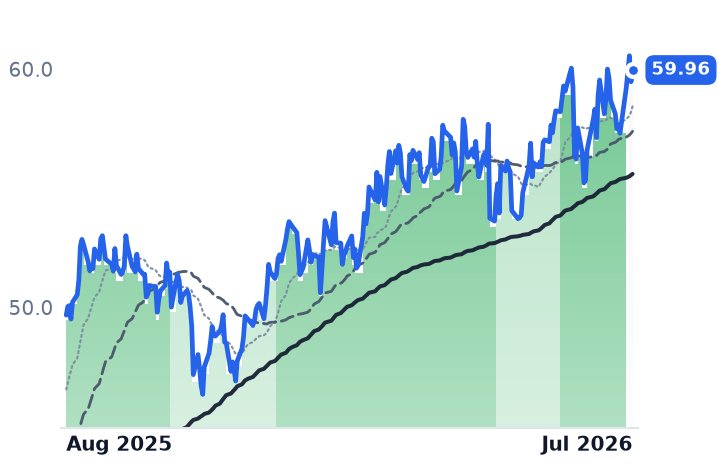
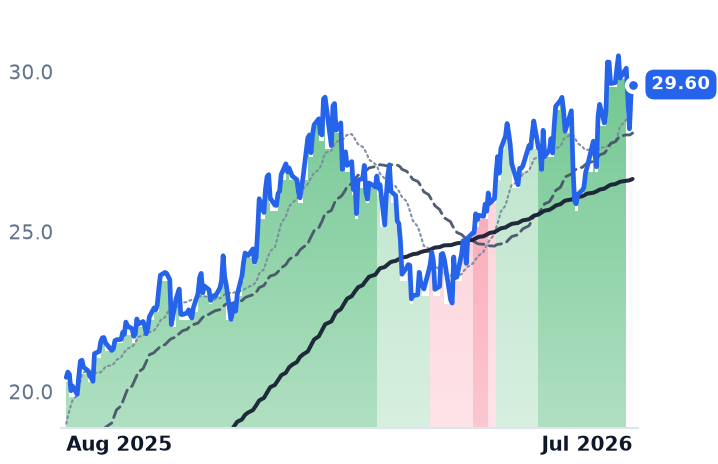
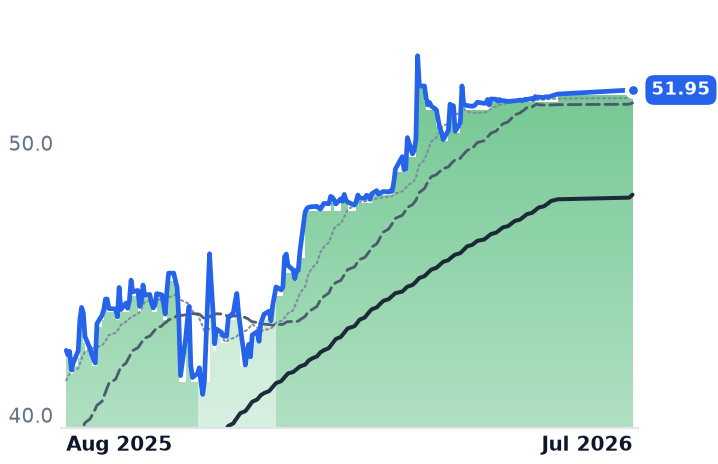
12-month price & trend
| Ticker | Mkt cap | P/E | P/E fwd | P/S | P/S fwd | P/GP | P/GP fwd | EV/EBITDA | FCF yld |
|---|---|---|---|---|---|---|---|---|---|
APO | $72.4B | 37.0x | 14.2x | 2.4x | 3.1x | 2.7x | 3.5x | 6.4x | 8.3% |
ARES | $42.1B | 56.7x | 21.7x | 6.7x | 7.5x | 10.7x | 12.0x | 22.7x | 3.8% |
BX | $154.3B | 28.4x | 21.5x | 9.6x | 10.5x | 10.8x | 11.8x | 19.7x | 1.6% |
| Ticker | Mkt cap | P/E | P/E fwd | P/S | P/S fwd | P/GP | P/GP fwd | EV/EBITDA | FCF yld |
|---|---|---|---|---|---|---|---|---|---|
KKR | $91.1B | 30.2x | 16.3x | 4.3x | 8.6x | 9.2x | 18.5x | 14.5x | 7.6% |
OWL | $16.1B | 83.9x | 11.6x | 5.4x | 5.7x | 8.8x | 9.3x | 19.1x | 8.2% |
CG | $16.6B | 30.2x | 12.6x | 4.2x | 4.6x | 5.9x | 6.5x | 28.1x | -5.5% |
| Ticker | Mkt cap | P/E | P/E fwd | P/S | P/S fwd | P/GP | P/GP fwd | EV/EBITDA | FCF yld |
|---|---|---|---|---|---|---|---|---|---|
HLNE | $4.7B | 13.5x | 14.3x | 6.2x | 5.6x | 9.0x | 8.1x | 10.7x | 7.5% |
GCMG | $2.0B | 12.9x | 12.2x | 3.6x | 3.7x | 4.4x | 4.5x | 11.3x | 9.6% |
BLK | $167.9B | 26.9x | 20.4x | 6.5x | 6.0x | 11.0x | 10.1x | 17.7x | 2.1% |
| Ticker | Mkt cap | P/E | P/E fwd | P/S | P/S fwd | P/GP | P/GP fwd | EV/EBITDA | FCF yld |
|---|---|---|---|---|---|---|---|---|---|
AMG | $7.8B | 10.4x | 8.5x | 3.3x | 3.3x | 4.8x | 4.8x | 6.7x | 13.8% |
APAM | $2.6B | 8.4x | 9.5x | 2.1x | 2.1x | 2.9x | 2.9x | 5.2x | 7.6% |
BEN | $16.5B | 20.3x | 11.6x | 1.8x | 2.4x | 2.4x | 3.3x | 16.0x | 5.6% |
| Ticker | Mkt cap | P/E | P/E fwd | P/S | P/S fwd | P/GP | P/GP fwd | EV/EBITDA | FCF yld |
|---|---|---|---|---|---|---|---|---|---|
FHI | $4.1B | 9.8x | 10.5x | 2.2x | 2.1x | 3.1x | 3.0x | 7.0x | 7.4% |
IVZ | $12.0B | n/m | 10.5x | 1.8x | 2.3x | 3.6x | 4.5x | 16.7x | 13.2% |
JHG | $8.0B | 10.0x | 12.2x | 2.5x | 3.3x | 3.5x | 4.6x | 8.1x | 7.8% |
Valuation & fundamentals
Consensus projections
| Ticker | FY2026E | FY2027E | FY2028E | |
|---|---|---|---|---|
APO | Revenue | +27.5% | +15.7% | +13.6% |
| EPS | +11.4% | +20.6% | +17.2% | |
ARES | Revenue | +23.0% | +19.9% | +9.6% |
| EPS | +17.8% | +23.8% | +17.4% | |
BX | Revenue | +15.0% | +24.4% | +4.9% |
| EPS | +10.7% | +25.2% | +10.8% | |
KKR | Revenue | +33.9% | +17.8% | +32.9% |
| EPS | +26.0% | +18.0% | +15.7% | |
OWL | Revenue | +5.9% | +10.5% | +16.1% |
| EPS | +7.9% | +11.4% | +14.5% | |
CG | Revenue | −4.3% | +41.3% | +7.2% |
| EPS | −8.7% | +39.7% | +15.1% | |
HLNE | Revenue | +12.1% | +11.2% | +17.9% |
| EPS | +20.3% | −1.0% | +19.9% | |
GCMG | Revenue | −0.3% | +15.5% | — |
| EPS | +11.9% | +20.5% | — | |
BLK | Revenue | +16.7% | +10.9% | +13.2% |
| EPS | +12.5% | +14.1% | +15.0% | |
AMG | Revenue | +12.0% | +10.6% | +11.2% |
| EPS | +35.0% | +14.5% | +18.4% | |
APAM | Revenue | +3.1% | +4.5% | +5.9% |
| EPS | +2.1% | +4.6% | +2.9% | |
BEN | Revenue | +6.0% | +6.2% | +6.7% |
| EPS | +28.6% | +6.8% | +7.3% | |
FHI | Revenue | +9.5% | +5.3% | +4.1% |
| EPS | +3.8% | +9.9% | +13.4% | |
IVZ | Revenue | +10.7% | +6.0% | +2.9% |
| EPS | +29.0% | +14.5% | +12.3% | |
JHG | Revenue | −6.5% | +4.8% | +11.0% |
| EPS | +5.3% | +8.9% | +5.7% |
Forward fiscal years only. Blank means no analyst coverage for that year.
What's happening
Two adjacent slices of the asset-management sector have moved in opposite directions over the past year. Alternative & Private Capital firms — private-equity, credit and infrastructure managers including Apollo Global Management (APO), Ares Management (ARES), Blackstone (BX), KKR, Blue Owl Capital (OWL), Carlyle (CG), Hamilton Lane (HLNE) and GCM Grosvenor (GCMG) — are down roughly 24% on average over the trailing year, with seven of eight names in double-digit declines. Diversified Asset Managers — BlackRock (BLK), the roughly $15 trillion-AUM industry leader; Affiliated Managers Group (AMG); Artisan Partners (APAM); Franklin Resources (BEN), which trades as Franklin Templeton; Federated Hermes (FHI); Invesco (IVZ); and Janus Henderson (JHG) — are up roughly 28% on average, though unevenly: AMG has surged 77% while BLK is roughly flat and APAM is down 12.5%.
The alts decline traces to a specific, dated credit event rather than a broad collapse in earnings power. Non-traded BDC redemption requests topped $20 billion in Q1 2026, with Apollo's ADS, Ares' ASIF and Blue Owl's OCIC/OTIC vehicles all capping withdrawals at 5% after requests ran two to four times that level. Non-accruals followed: the BDC-industry weighted-average non-accrual rate rose to 1.99% in Q1 2026 from 1.42% the prior quarter, FS KKR's net asset value per share fell nearly 10%, and Blue Owl's OBDC cut its dividend 16%. As recently as late July, Ares' $29 billion flagship private credit fund reported a fresh uptick in troubled investments tied to AI-disruption-exposed borrowers, and KKR executives said tight spreads and choosy buyers made the first quarter challenging at Global Atlantic, its $150 billion insurance affiliate.
Where the two verdicts diverge
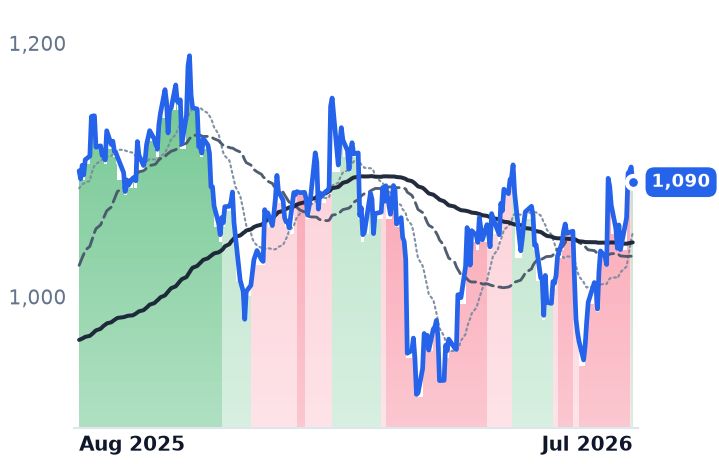
But the price damage has run ahead of core fee earnings for most of the group. Trailing price/earnings multiples for Ares, Blackstone, KKR and Blue Owl have compressed sharply since May even as prices only partly recovered — Ares from roughly 65x to 50x, KKR from roughly 42x to 31x, Blue Owl from roughly 89x to 71x — a pattern that, on flat-to-falling prices, implies earnings grew rather than shrank. Apollo's first-quarter fee-related earnings were $728 million and it crossed $1 trillion in assets under management, with analyst consensus ahead of its August 4 print still pointing to 13-19% year-over-year earnings growth. That gap — business momentum holding up while the share price fell faster — reads as a possible dislocation for Blackstone and KKR, whose trailing multiples in the high-20s/low-30s sit well below Blue Owl's 71x and Ares' 50x, both still stretched even after the crash. Carlyle is the exception: its multiple rose as its price fell, the signature of genuine earnings deterioration, consistent with the weaker fundraising momentum flagged in prior coverage.
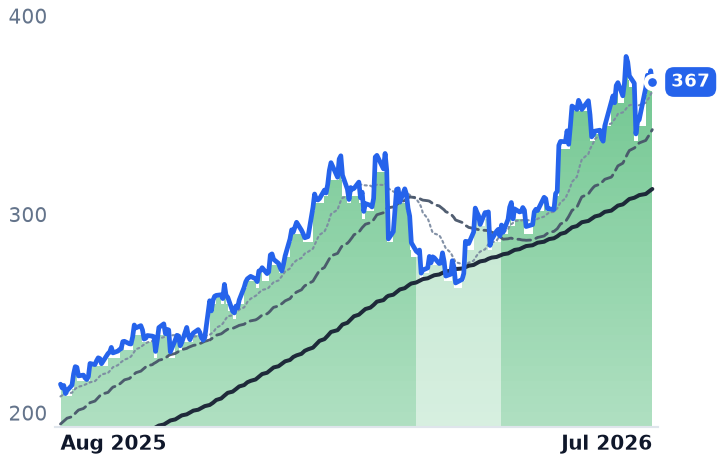
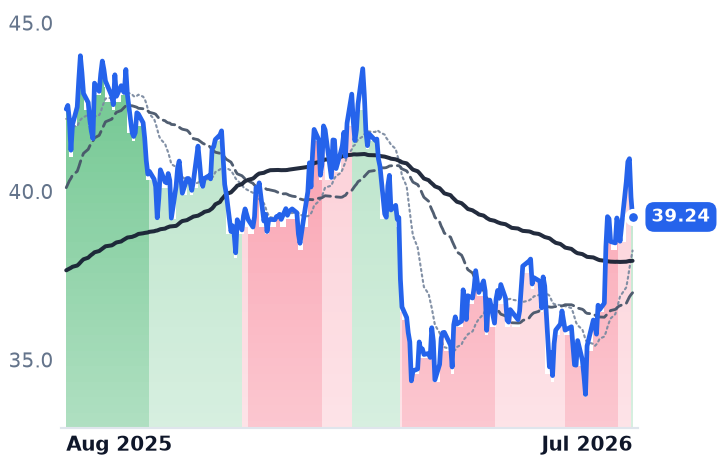
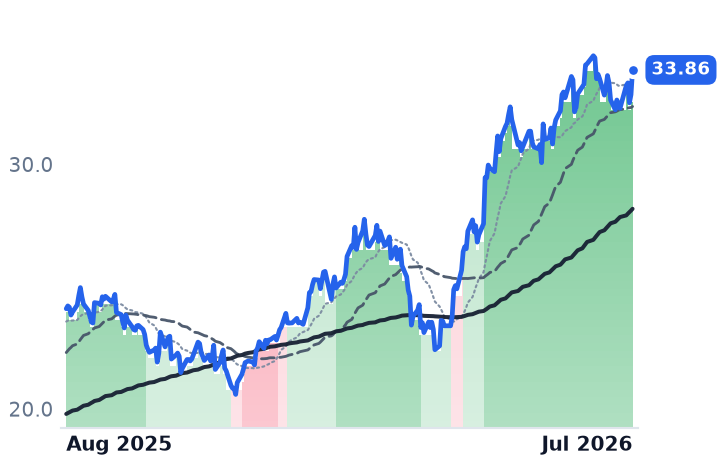
On the diversified side, the gains are not simply beta riding a rising index. AMG's 77% year rests on record inflows — roughly $35 billion in first-half net client cash flows and $942 billion in AUM, with alternative-strategy affiliates driving about $58 billion of that inflow. Franklin Resources' rally reflects a specific product win, with active strategies making up 70% of first-quarter net flows via its active-ETF push. BlackRock's own record — $15.34 trillion in AUM, up 22% year over year, with $192 billion of quarterly inflows — is genuine, but the stock is roughly flat, so growth hasn't yet reached the share price. Invesco's 44% year carries a competitive threat: BlackRock has filed for a Nasdaq-100 ETF that would directly challenge Invesco's QQQ franchise. Artisan Partners looks like the diversified group's own possible dislocation: $295.4 million in quarterly revenue and a 19.6% net margin against a trailing price/earnings ratio near 8.4x and a stock still down 12.5% on the year.
Neither cohort's trend signal has confirmed the past month's move. Trend bands for Ares, Blue Owl, Apollo, Blackstone, Carlyle and KKR remained in bear territory through the end of July even as the group rallied roughly 7% on average over 30 days, outpacing the diversified cohort's roughly 6% bounce — price moving before the underlying trend measure has turned, on both sides of the divide.
The setup
Where it stands — Alts names trade well below where price/earnings compression suggests fee earnings sit; Carlyle alone shows matching earnings deterioration. Would confirm — BDC non-accrual rates and NAV cuts continue rising through Q2/Q3 2026 prints across Apollo, Ares, KKR, Blue Owl. Would invalidate — Trend bands flip from bear to neutral/bull for Blackstone or KKR alongside stabilizing redemption and non-accrual data. Watch next — Apollo reports Q2 2026 results on August 4, with consensus EPS growth of 13-19% year over year. Valuation — Blue Owl (~71x) and Ares (~50x) trailing price/earnings remain stretched; Blackstone (~29x) and KKR (~31x) sit far below their May levels of 31x and 42x.