

Venture Global's +32% dates to Hormuz, not a bear-band exit
Prompt v1.0
VG's gap-free +31.6% month is real, but the "early leg out of a downtrend" thesis fails — six of seven US LNG names have been in bull bands continuously since April. The move dates almost exactly to JKM's +32.6% spike after the 7 July strike on a Qatari carrier, and VG now sits only 8-10% below consensus targets.
| Ticker | Company | Segment | Trend · 13mo | 30D | 1Y |
|---|---|---|---|---|---|
VG | Venture Global | LNG Export & Infrastructure | 🌱 Emerging Bull | +9.1% | −19.3% |
LNG | Cheniere Energy | LNG Export & Infrastructure | 🟢 Cont. Bull | +3.4% | +11.2% |
NEXT | Nextdecade | LNG & Energy Transition | 🌱 Emerging Bull | −16.6% | −46.1% |
EE | Excelerate Energy | LNG Infrastructure | 🟢 Cont. Bull | +0.8% | +58.1% |
GLNG | Golar LNG | Marine LNG & LPG Transportation | 🟢 Cont. Bull | −2.0% | +22.7% |
FLNG | FLEX LNG | Marine LNG & LPG Transportation | 🟢 Cont. Bull | +5.5% | +39.1% |
NFE | New Fortress Energy | Regulated Gas | 🔴 Cont. Bear | −2.9% | −91.7% |
CQP | Cheniere Energy Partners | LNG Export & Infrastructure | 🌱 Emerging Bull | +5.8% | +20.3% |
BKR | Baker Hughes | Well Services & Stimulation | 🟢 Cont. Bull | +3.8% | +27.3% |
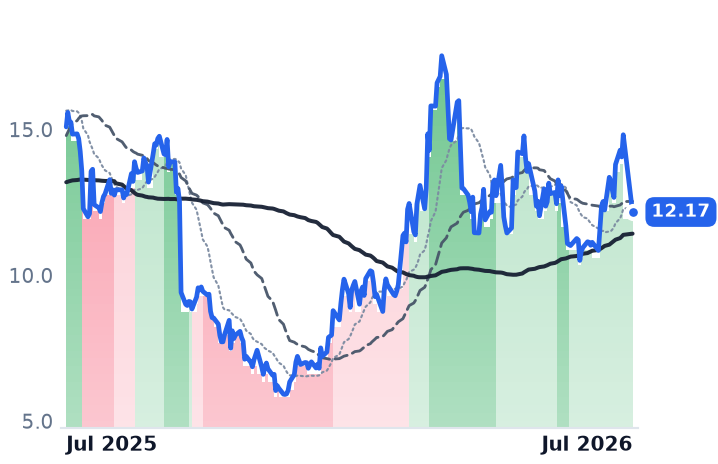
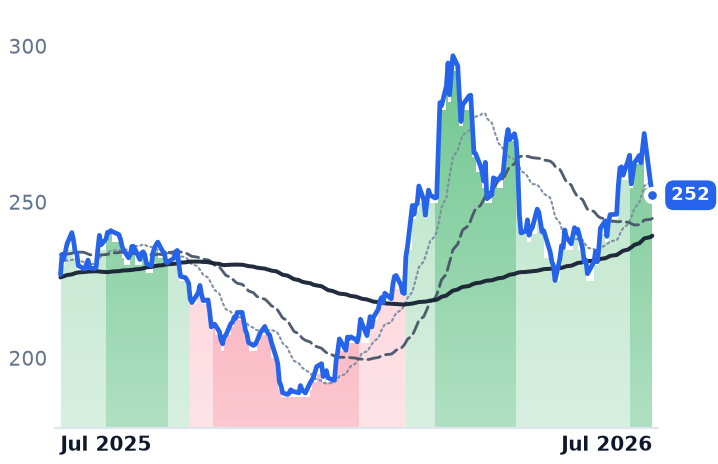
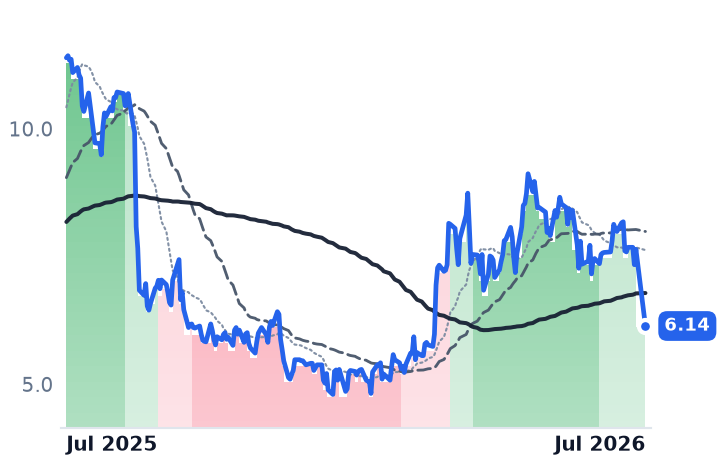
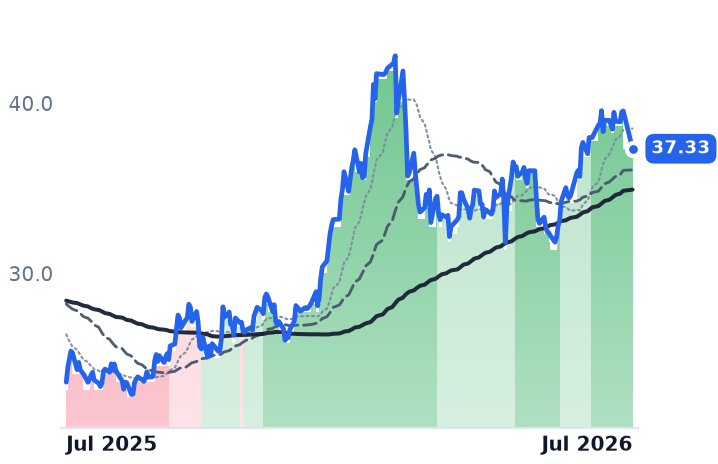
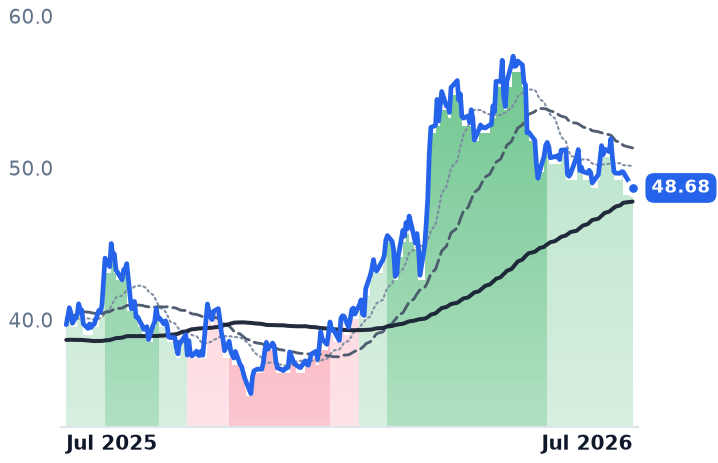
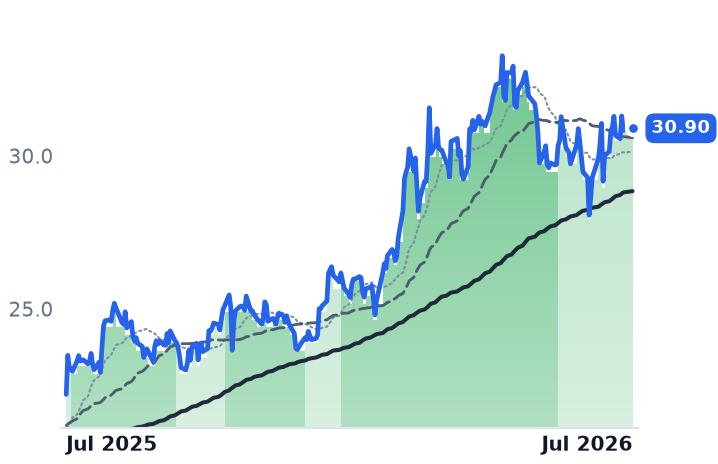
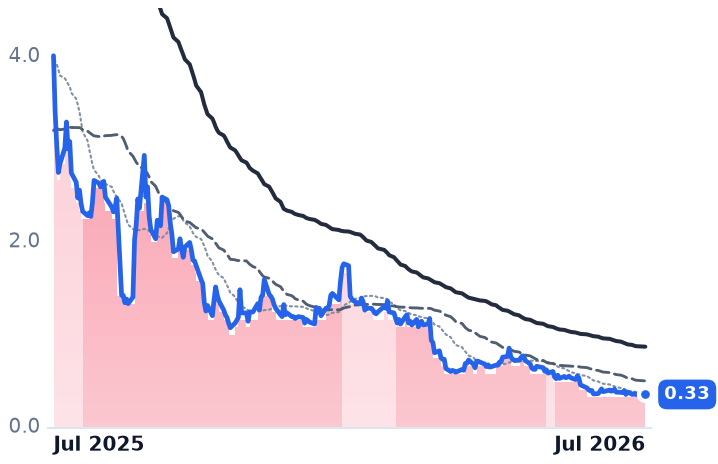
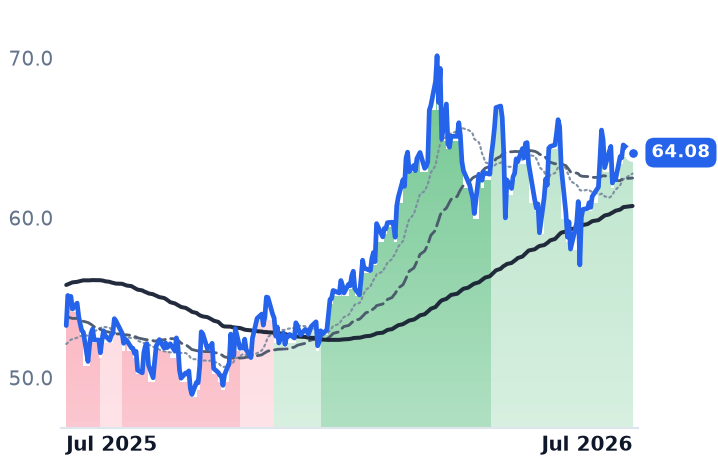
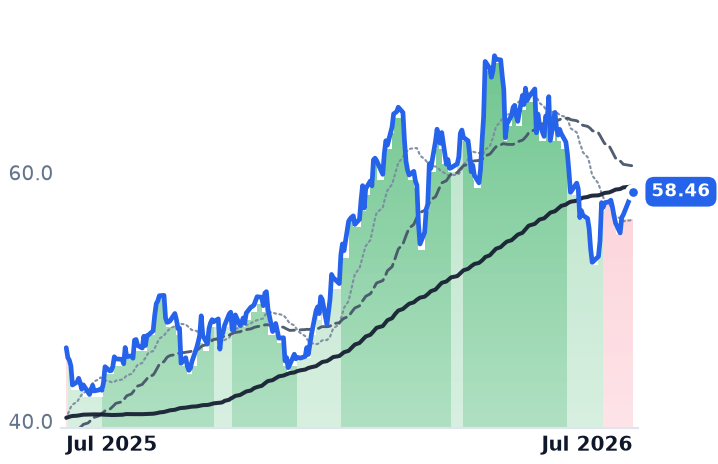
12-month price & trend
| Ticker | Mkt cap | P/E | P/E fwd | P/S | P/S fwd | P/GP | P/GP fwd | EV/EBITDA | FCF yld |
|---|---|---|---|---|---|---|---|---|---|
VG | $34.2B | 10.3x | 9.2x | 2.0x | 1.9x | 4.2x | 3.9x | 4.4x | -27.5% |
LNG | $56.9B | 20.1x | — | 2.6x | 2.6x | 4.8x | 4.8x | 10.0x | 12.4% |
NEXT | $1.9B | n/m | — | n/m | 6.1x | — | — | n/m | -201.3% |
| Ticker | Mkt cap | P/E | P/E fwd | P/S | P/S fwd | P/GP | P/GP fwd | EV/EBITDA | FCF yld |
|---|---|---|---|---|---|---|---|---|---|
EE | $4.1B | 28.5x | 22.9x | 3.1x | 2.7x | 9.3x | 8.1x | 11.6x | 820.6% |
GLNG | $5.8B | 88.0x | 70.1x | 14.8x | 14.5x | 31.5x | 31.0x | 39.0x | -7.4% |
FLNG | $1.7B | 23.0x | 15.7x | 5.1x | 5.0x | 10.2x | 9.9x | 13.3x | 5.9% |
| Ticker | Mkt cap | P/E | P/E fwd | P/S | P/S fwd | P/GP | P/GP fwd | EV/EBITDA | FCF yld |
|---|---|---|---|---|---|---|---|---|---|
NFE | $197.4M | n/m | — | 0.2x | 0.1x | 1.0x | 0.4x | n/m | -519.1% |
CQP | $33.4B | 11.5x | 17.6x | 2.9x | 2.8x | 7.8x | 7.5x | 11.3x | 9.8% |
BKR | $63.6B | 20.4x | 26.8x | 2.3x | 2.3x | 9.7x | 9.8x | 14.3x | 3.6% |
Consensus projections
| Ticker | FY2026E | FY2027E | FY2028E | |
|---|---|---|---|---|
VG | Revenue | +33.3% | −12.6% | +29.6% |
| EPS | +83.8% | −52.8% | +75.1% | |
LNG | Revenue | +11.9% | +6.0% | +3.4% |
| EPS | −141.4% | −345.2% | −8.0% | |
NEXT | Revenue | — | +267.6% | +129.4% |
| EPS | +25.3% | −62.3% | −17.3% | |
EE | Revenue | +30.6% | +19.1% | +11.6% |
| EPS | +13.2% | +28.6% | +40.2% | |
GLNG | Revenue | +0.8% | +7.2% | +103.0% |
| EPS | −41.4% | −4.2% | +409.1% | |
FLNG | Revenue | +4.1% | +0.8% | +2.1% |
| EPS | +13.6% | +3.8% | +10.2% | |
NFE | Revenue | +89.1% | +3.5% | −36.7% |
| EPS | −71.2% | −105.6% | −185.7% | |
CQP | Revenue | +12.8% | −3.2% | +4.3% |
| EPS | −4.9% | +9.5% | +1.7% | |
BKR | Revenue | +0.4% | +7.9% | +3.5% |
| EPS | −2.8% | +19.8% | +13.6% |
Forward fiscal years only. Blank means no analyst coverage for that year.
The move is real; the framing isn't
VG closed at $14.82 on 22 July, up 31.6% in 30 days, 20.1% in 90 and 55.5% in 180. It was a grind, not a pop: a 20-session stair-step off a $10.51 low on 24 June, largest single day +9.2% on 13 July, no overnight gap wider than ~4.7%, with volume expanding from ~6.7M shares in early July to 21.7M, 23.6M and 20.9M in the 17-22 July window.
The cohort test fails, though. None of the seven names exited a bear band in the trailing 90 days. VG, LNG, EE, GLNG, FLNG and NEXT have all been in mild or strong bull bands continuously since at least 1 April, and all six trade above their 200-day averages — VG +38.9%, EE +20.1%, NEXT +15.6%, LNG +10.2%, FLNG and GLNG +9.4%. Only NFE is in strongly bearish, 67.6% below its 200-day. Cheniere did not fall over the window either: LNG rose 15.8% to $267.40 before easing to $255.88 on 27 July.
What actually dated it
The arbitrage leg confirms precisely. JKM reached $21.03/MMBtu on 20 July, up 32.57% in a month — near-identical to VG's +31.6% — while Henry Hub slid to a three-month low near $2.72-2.80, after a $2.94 prompt-month settlement on 10 July on strong production and ample storage. That is a roughly $18 gross spread.
The trigger was geopolitical, not feedgas. On 7 July the Qatari carrier Al Rekayyat was struck near Limah, Oman, after which QatarEnergy paused its Ras Laffan ramp-up. JKM jumped from the mid-$16s to the mid-$18s that week and TTF from $14.8 to $16.8, with EU storage just 51.5% full on 10 July — 22.9 points below the five-year average. EIA still forecasts 9% US LNG export growth in 2026, but that is structural, not the July catalyst.
Company news layered on: a binding EnBW 820kt/yr five-year SPA, Mizuho's target lift to $15 at Neutral, and a Baker Hughes order for six CP2 liquefaction blocks following March's CP2 Phase 2 FID and $8.6B financing.
What's left
Runway is thin. Consensus on VG sits near $16.06-16.32, 8-10% above the close, versus ~18% for Cheniere against a ~$302 average. VG is the cheaper trailing multiple (P/E 11.4 vs 40.8) on $8.2-8.5B FY26 EBITDA guidance and a $3.82/MMBtu implied Q1 liquefaction fee. Offsetting: an October 2025 BP arbitration loss exposing over $1B, 225 MTPA under construction globally, and a US-EU $750B energy purchase target analysts call unrealistic. Next checkpoint: Q2 results on 11 August.