

AI Financiers Split: Buyout Firms' Stocks Sink as Fees Grow; Banks and Toll-Road Infrastructure Rally
Hypothesis Opus 5 · Research Sonnet 5 · Writing Sonnet 5 · Prompt v1.1
The 17-name group financing the AI data-center boom looks flat for the year, but that average hides a real split: six private-equity and credit managers fell 20-30% even as their fee earnings grew double digits, while Goldman Sachs, Morgan Stanley, Brookfield Infrastructure and HASI rallied 34-51% on record financing pipelines and contracted cash flow growth.
| Ticker | Company | Segment | Trend | 30D | 1Y |
|---|---|---|---|---|---|
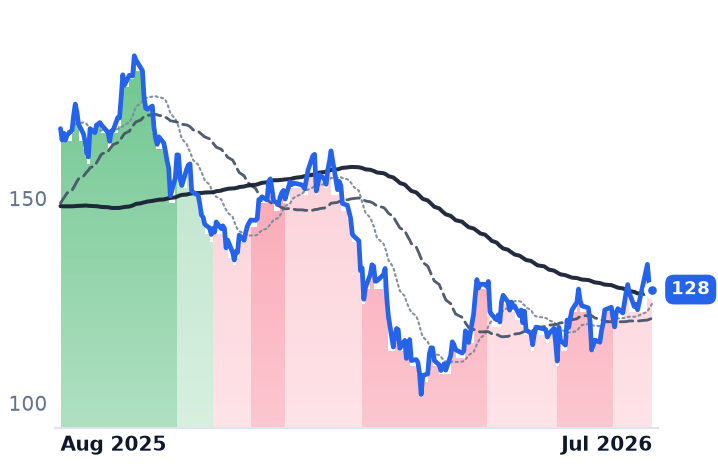
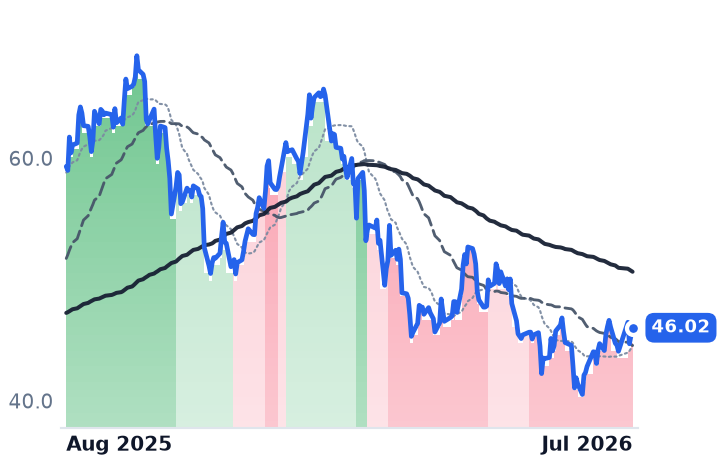
BX | Blackstone | Alternative & Private Capital | 🔴 Cont. Bear | +3.5% | −23.5% |
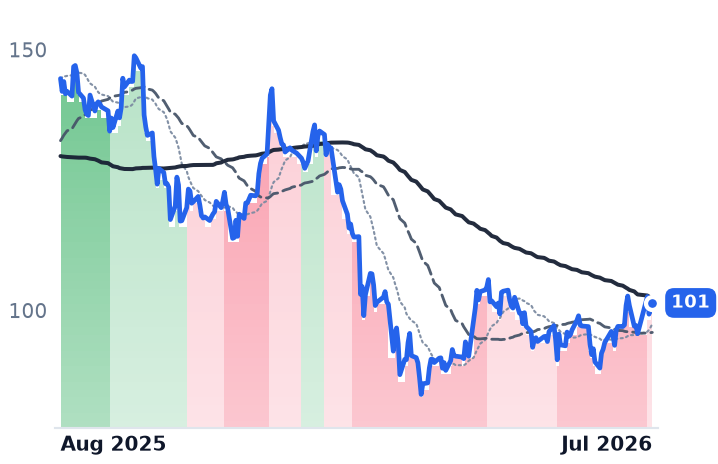
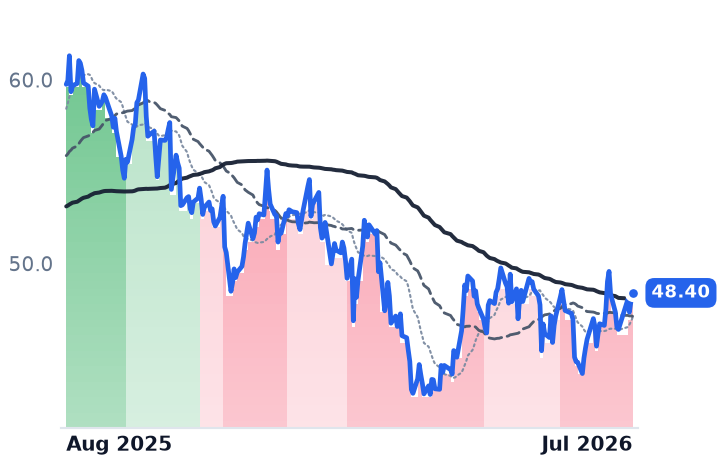
KKR | KKR | Alternative & Private Capital | 🔴 Cont. Bear | +5.7% | −29.8% |
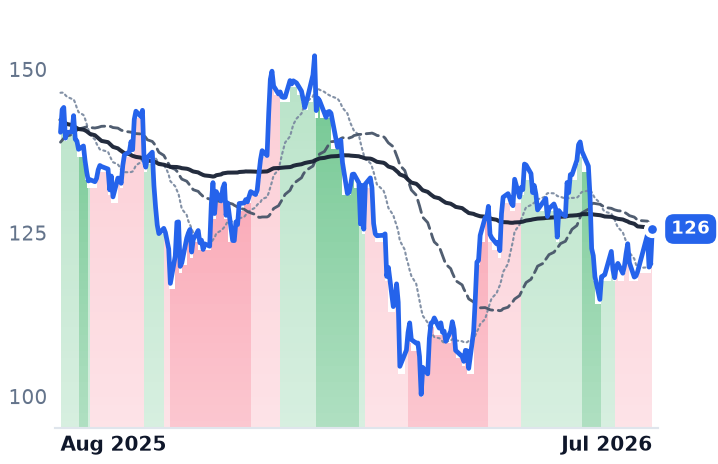
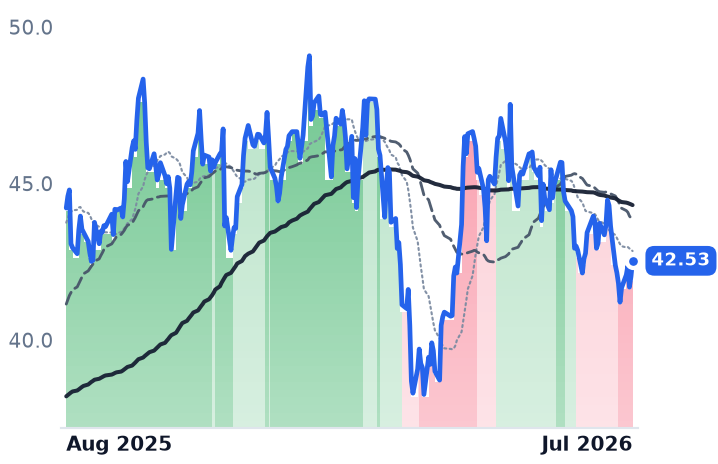
APO | Apollo Global Management | Alternative & Private Capital | 🔴 Cont. Bear | +2.8% | −10.5% |
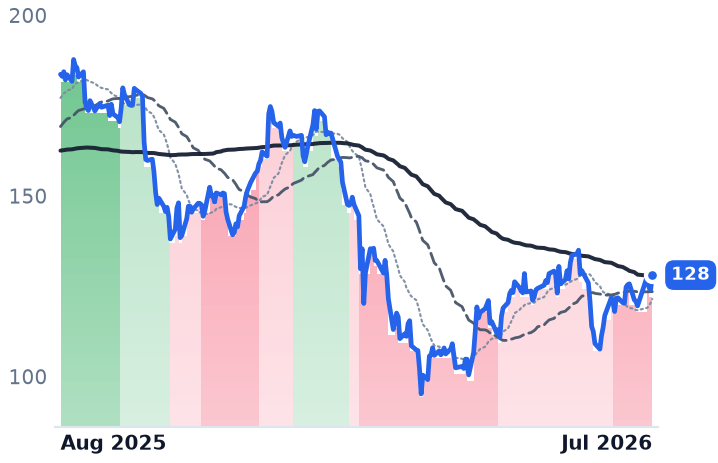
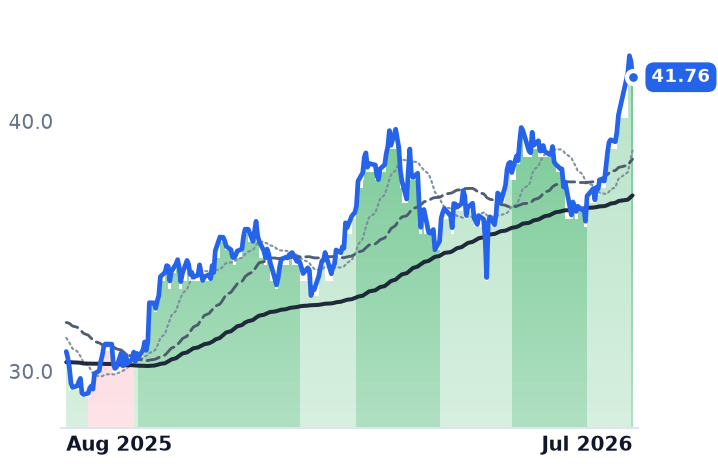
ARES | Ares Management | Alternative & Private Capital | 🔴 Cont. Bear | +5.1% | −30.3% |
CG | The Carlyle | Alternative & Private Capital | ⚠️ Emerging Bear | +4.5% | −22.4% |
BAM | Brookfield Asset Management | Real Estate & Infrastructure | 🔴 Cont. Bear | +3.0% | −19.0% |
BN | Brookfield | Real Estate & Infrastructure | ⚠️ Emerging Bear | −3.3% | −3.8% |
BIP | Brookfield Infrastructure Partners | Infrastructure & Transport Conglomerates | 🟢 Cont. Bull | +11.9% | +35.6% |
GS | The Goldman Sachs | Bulge Bracket Investment Banks | 🟢 Cont. Bull | −3.5% | +42.5% |
MS | Morgan Stanley | Bulge Bracket Investment Banks | 🟢 Cont. Bull | −5.3% | +51.4% |
HASI | HA Sustainable Infrastructure Capital | Financial - Diversified | 🟢 Cont. Bull | −1.1% | +53.3% |
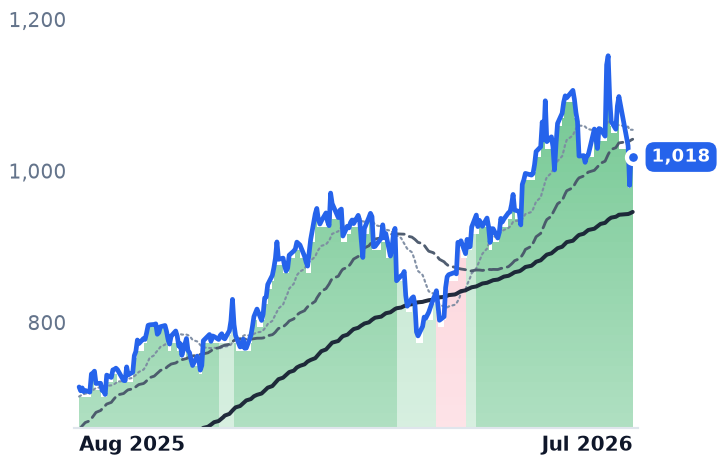
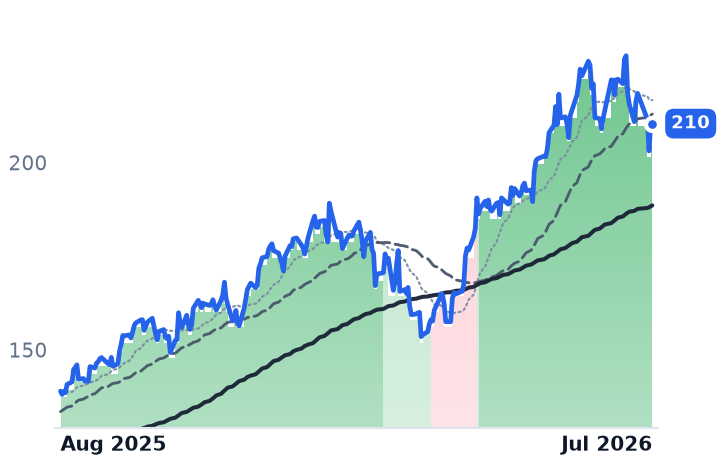
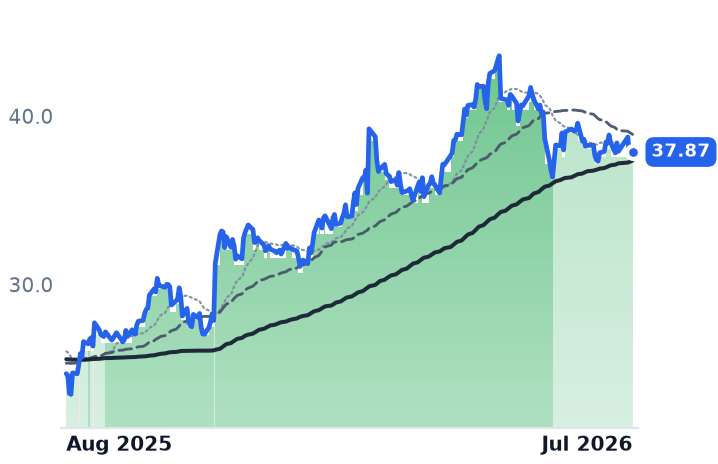
12-month price & trend
| Ticker | Mkt cap | P/E | P/E fwd | P/S | P/S fwd | P/GP | P/GP fwd | EV/EBITDA | FCF yld |
|---|---|---|---|---|---|---|---|---|---|
BX | $154.3B | 28.4x | 21.5x | 9.6x | 10.5x | 10.8x | 11.8x | 19.7x | 1.6% |
KKR | $91.1B | 30.2x | 16.3x | 4.3x | 8.6x | 9.2x | 18.5x | 14.5x | 7.6% |
APO | $72.4B | 37.0x | 14.2x | 2.4x | 3.1x | 2.7x | 3.5x | 6.4x | 8.3% |
| Ticker | Mkt cap | P/E | P/E fwd | P/S | P/S fwd | P/GP | P/GP fwd | EV/EBITDA | FCF yld |
|---|---|---|---|---|---|---|---|---|---|
ARES | $42.1B | 56.7x | 21.7x | 6.7x | 7.5x | 10.7x | 12.0x | 22.7x | 3.8% |
CG | $16.6B | 30.2x | 12.6x | 4.2x | 4.6x | 5.9x | 6.5x | 28.1x | -5.5% |
BAM | $77.3B | 31.0x | 26.4x | 16.1x | 12.6x | 20.1x | 15.7x | 25.9x | 3.0% |
| Ticker | Mkt cap | P/E | P/E fwd | P/S | P/S fwd | P/GP | P/GP fwd | EV/EBITDA | FCF yld |
|---|---|---|---|---|---|---|---|---|---|
BN | $101.9B | 85.4x | 16.2x | 1.3x | 13.4x | 3.7x | 38.0x | 2.8x | -2.7% |
BIP | $19.2B | 59.7x | 38.5x | 0.8x | 1.5x | 3.0x | 5.7x | 6.9x | -3.0% |
GS | $300.4B | 15.5x | 14.6x | 2.5x | 4.2x | 4.4x | 7.3x | 29.0x | -15.7% |
| Ticker | Mkt cap | P/E | P/E fwd | P/S | P/S fwd | P/GP | P/GP fwd | EV/EBITDA | FCF yld |
|---|---|---|---|---|---|---|---|---|---|
MS | $332.0B | 16.9x | 16.4x | 2.6x | 4.1x | 4.4x | 6.9x | 20.2x | -0.3% |
HASI | $4.8B | 82.3x | 12.7x | 6.8x | 10.4x | 24.6x | 37.6x | 40.8x | 4.8% |
Valuation & fundamentals
Consensus projections
| Ticker | FY2026E | FY2027E | FY2028E | |
|---|---|---|---|---|
BX | Revenue | +15.0% | +24.4% | +4.9% |
| EPS | +10.7% | +25.2% | +10.8% | |
KKR | Revenue | +33.9% | +17.8% | +32.9% |
| EPS | +26.0% | +18.0% | +15.7% | |
APO | Revenue | +27.5% | +15.7% | +13.6% |
| EPS | +11.4% | +20.6% | +17.2% | |
ARES | Revenue | +23.0% | +19.9% | +9.6% |
| EPS | +17.8% | +23.8% | +17.4% | |
CG | Revenue | −4.3% | +41.3% | +7.2% |
| EPS | −8.7% | +39.7% | +15.1% | |
BAM | Revenue | +12.7% | +16.1% | +12.5% |
| EPS | +12.7% | +17.9% | +17.4% | |
BN | Revenue | −7.5% | +22.7% | +22.2% |
| EPS | +15.5% | +23.5% | +22.4% | |
BIP | Revenue | +61.2% | −25.6% | +8.1% |
| EPS | +2.1% | +38.8% | −2.9% | |
GS | Revenue | +20.6% | +2.7% | +1.8% |
| EPS | +42.8% | +4.7% | +5.3% | |
MS | Revenue | +16.4% | +5.5% | +5.3% |
| EPS | +30.1% | +6.1% | +7.8% | |
HASI | Revenue | +18.8% | +11.2% | +14.0% |
| EPS | +10.5% | +10.9% | +8.9% |
Forward fiscal years only. Blank means no analyst coverage for that year.
A flat average, a real split
The group of firms that supply the money behind the AI data-center build — private-equity giants, Wall Street banks, and specialty infrastructure lenders — looks like it went nowhere over the past year, up roughly 2%. That average is misleading. Six of the largest private-capital managers fell 20% to 30% even as their underlying fee businesses kept growing at double-digit rates, while banks and contracted-infrastructure owners in the same group rallied 34% to 51%. The split shows two different parts of the AI financing chain being priced very differently by the market, and in at least one case the pricing looks disconnected from the business results underneath it.
The managers: fees up, stocks down
Blackstone (BX), the world's largest alternative-asset manager and a major direct owner of data-center real estate through its QTS platform, fell 25% over the year even as its fee-related earnings rose 22% and assets under management hit $1.35 trillion, up 11%. Ares Management (ARES), a private-credit and direct-lending manager, fell 30% while posting record quarterly fundraising of $36.4 billion and 20% fee-earnings growth. KKR fell 29%, Carlyle (CG) 22%, Brookfield Asset Management (BAM, the fee-earning manager spun out of its parent) 19%, and Apollo (APO), whose Athene insurance arm funds much of its private-credit book, fell a smaller 9% as Athene helped it grow earnings through a broader dealmaking slowdown. Forward multiples tell the same story: Ares's price-to-earnings ratio compressed from 64.8x to 50.3x and KKR's from 42.4x to 30.7x between May and June even as both firms' fee earnings grew — a genuine gap between business momentum and share price, not a fundamentals-driven de-rating.
The banks and toll roads: pipelines and cash flow, both up
Goldman Sachs (GS) and Morgan Stanley (MS), which underwrite and arrange the debt behind data-center construction, rallied 44% and 51% respectively and never broke their uptrends. Morgan Stanley has overtaken Goldman in AI-infrastructure debt volume and projects an additional $800 billion of private-credit data-center financing over the next two years. Both trade at 18-19x trailing earnings, cheaper than any of the alt managers. HA Sustainable Infrastructure Capital (HASI), which lends against renewable-energy and efficiency projects, rallied 47% on a widening spread between its ~6.8% cost of new debt and ~10.8% yield on new assets, helped by lower-cost green bond issuance in February.
The Brookfield split, inside one family
Brookfield Infrastructure (BIP), which owns contracted, toll-road-like infrastructure assets including data centers, rallied 34% and was upgraded back to a strong uptrend in the final week of July after funds from operations rose 10% and its data segment's FFO grew 46%, capped by a $1.2 billion IPO of its US colocation unit, Csquare. Its parent, Brookfield Corporation (BN), the holding company that owns stakes in Brookfield's asset manager and a growing insurance arm, was roughly flat for the year but broke repeatedly from an uptrend into a downtrend across three-, six- and twelve-month windows, most recently in late July. That break coincided with a broad macro selloff, concerns over holding-company leverage, and a roughly 50% haircut to real-estate carrying values, even as the firm reported insurance-driven earnings up 24%. BN's GAAP accounting is distorted by insurance and real-estate marks, making the business-versus-tape verdict for BN INCONCLUSIVE; for BIP, contracted cash flow growth and the price move agree — CONFIRMS.
Where the real stress is
The genuine credit-cycle warning isn't in the manager stocks or in data-center securitization, which is expanding, not stalling — asset-backed and commercial mortgage issuance for data centers has grown to roughly $61 billion year-to-date in 2026 from $27 billion in all of 2025, with spreads holding near 150-200 basis points. It shows up one layer down, in the business development companies that hold the actual loans: non-accruals and PIK (payment-in-kind, non-cash) income are rising across the sector, and Ares's flagship private-credit fund saw 14% of investors request redemption against a 5% cap. That's a real, if partial, repricing signal in the credit book — distinct from, and smaller than, the equity de-rating in the manager stocks themselves.
The setup
Where it stands — Alt-manager stocks (BX, KKR, ARES, CG, BAM) trade well below their own five-month multiples despite fee-earnings growth of 20%+; banks and BIP hold uptrends on growing pipelines. Would confirm — Fee-related earnings growth decelerating below double digits at BX, KKR or ARES over the next two quarterly reports. Would invalidate — Alt-manager forward P/E multiples re-expanding toward their prior 2025 levels while fee-earnings growth holds steady. Watch next — Q3 2026 earnings (October) for BX, KKR, ARES fee-related earnings and Ares Capital's non-accrual and redemption figures. Valuation — ARES trades at 50.3x trailing earnings, down from 64.8x in May; GS and MS trade at 18-19x, both below the alt managers' current multiple.