

AI2 Laggard Scan: DY and HUBB Stand Out as Category Catch-Up Candidates
Prompt v1.0
While AI2 Construction and Power leaders (STRL, PWR, AGX) have already re-rated violently, two names — Dycom Industries (DY) and Hubbell (HUBB) — show genuine hyperscaler exposure with gradual price moves, favorable technicals, and fundamental catalysts that have not yet been fully priced. GTLS and PRIM are flagged as structural laggards, not pre-catalyst setups.
| Ticker | Company | Segment | Trend · 13mo | 30D | 1Y |
|---|---|---|---|---|---|
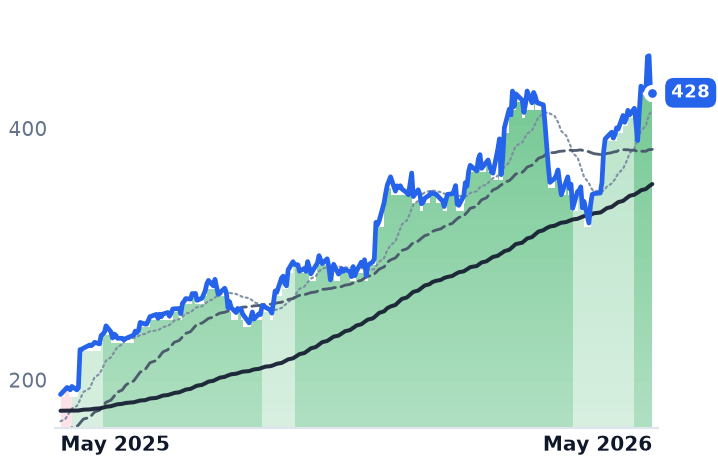
DY | Dycom Industries | Electrical & Power Infrastructure | 🟢 Cont. Bull | +9.4% | +127.3% |
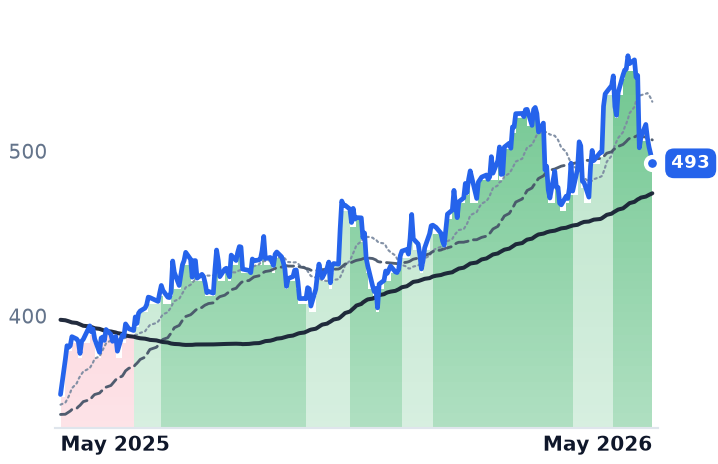
HUBB | Hubbell Incorporated | Electrical Distribution & Switchgear | 🟢 Cont. Bull | −7.9% | +39.8% |
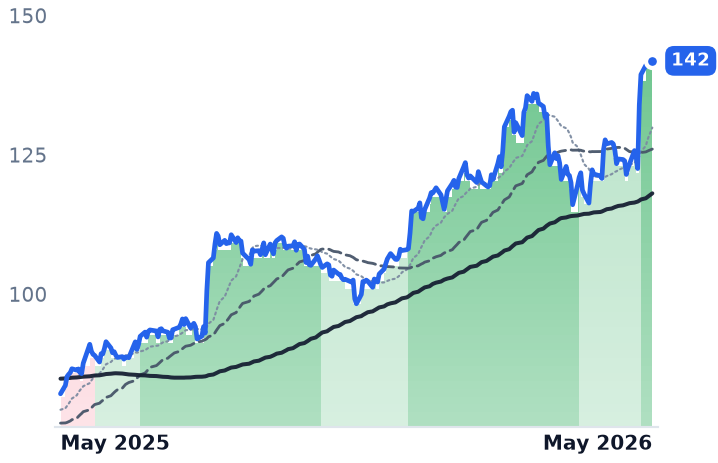
GVA | Granite Construction Incorporated | Infrastructure & Civil Construction | 🟢 Cont. Bull | +11.1% | +72.8% |
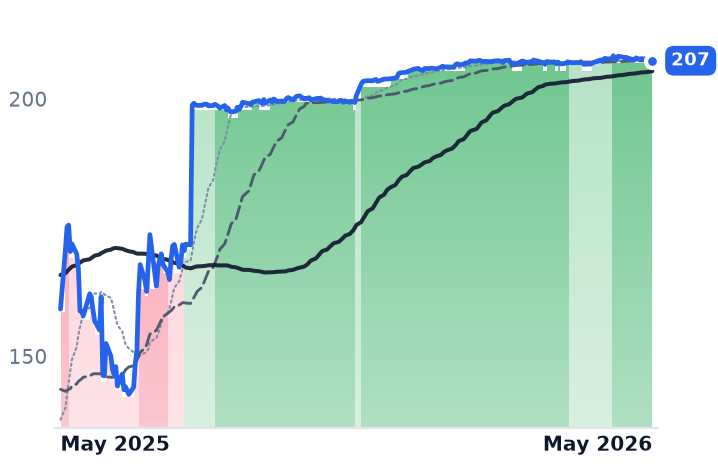
GTLS | Chart Industries | Filtration & Separation | 🟢 Cont. Bull | −0.2% | +30.3% |
TT | Trane Technologies | HVAC Systems | 🟢 Cont. Bull | +1.3% | +16.0% |
PRIM | Primoris Services | Energy & Power Project Solutions | 🟢 Cont. Bull | −36.0% | +53.9% |
PWR | Quanta Services | Electrical & Power Infrastructure | 🟢 Cont. Bull | +28.0% | +128.8% |
MTZ | MasTec | Electrical & Power Infrastructure | 🟢 Cont. Bull | +15.9% | +179.5% |
AGX | Argan | Energy & Power Project Solutions | 🟢 Cont. Bull | +11.7% | +301.8% |
VRT | Vertiv | Data Center Power & Thermal | 🟢 Cont. Bull | +18.2% | +261.9% |
MOD | Modine Manufacturing | Thermal & Powertrain Components | 🟢 Cont. Bull | +13.0% | +188.2% |
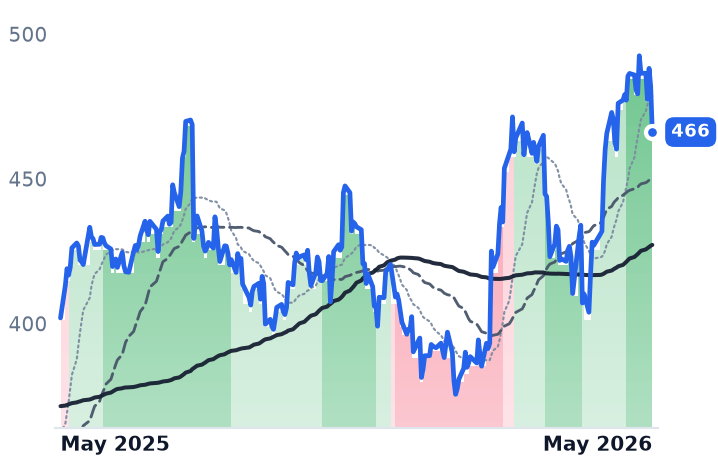
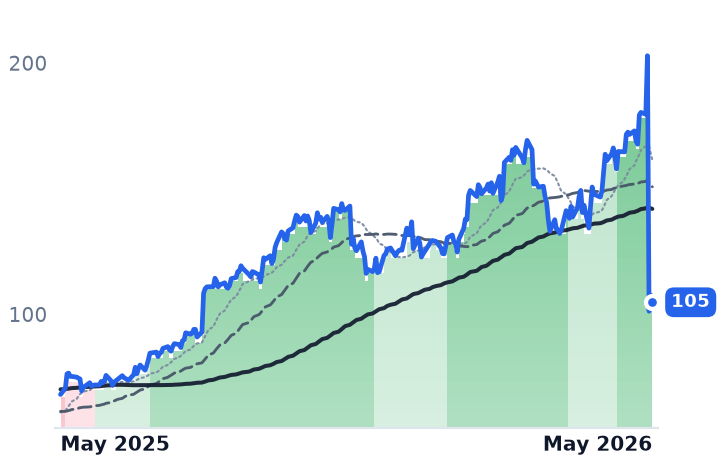
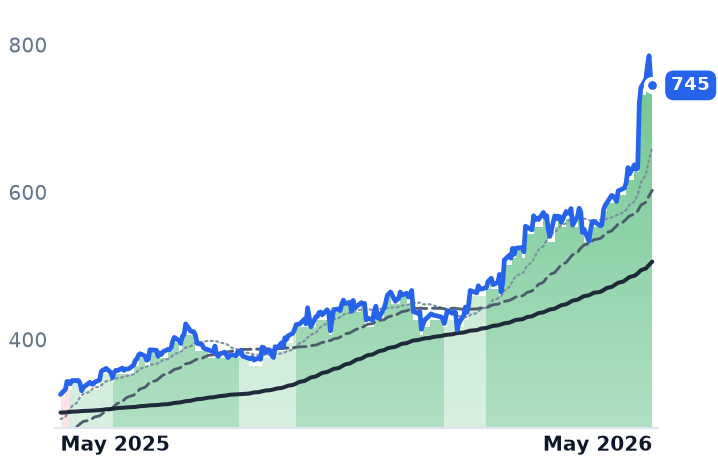
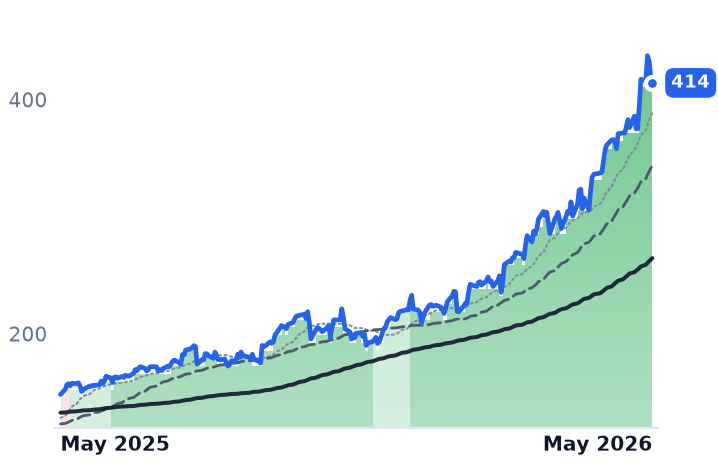
12-month price & trend
| Ticker | Mkt cap | P/E | P/E fwd | P/S | P/S fwd | P/GP | P/GP fwd | EV/EBITDA | FCF yld |
|---|---|---|---|---|---|---|---|---|---|
DY | $12.0B | 37.8x | 24.2x | 1.9x | 1.6x | 9.8x | 8.1x | 13.6x | 3.7% |
HUBB | $27.4B | 30.6x | 25.5x | 4.4x | 4.0x | 12.5x | 11.4x | 22.0x | 3.3% |
GVA | $6.1B | 32.6x | 23.2x | 1.3x | 1.2x | 8.2x | 7.2x | 14.9x | 5.0% |
| Ticker | Mkt cap | P/E | P/E fwd | P/S | P/S fwd | P/GP | P/GP fwd | EV/EBITDA | FCF yld |
|---|---|---|---|---|---|---|---|---|---|
GTLS | $9.9B | n/m | 20.8x | 2.4x | 2.3x | 7.6x | 7.3x | 29.4x | 0.1% |
TT | $103.1B | 35.9x | 31.3x | 4.8x | 4.4x | 13.3x | 12.3x | 25.1x | 3.1% |
PRIM | $6.1B | 24.7x | 23.4x | 0.8x | 0.8x | 7.9x | 7.7x | 14.4x | 2.7% |
| Ticker | Mkt cap | P/E | P/E fwd | P/S | P/S fwd | P/GP | P/GP fwd | EV/EBITDA | FCF yld |
|---|---|---|---|---|---|---|---|---|---|
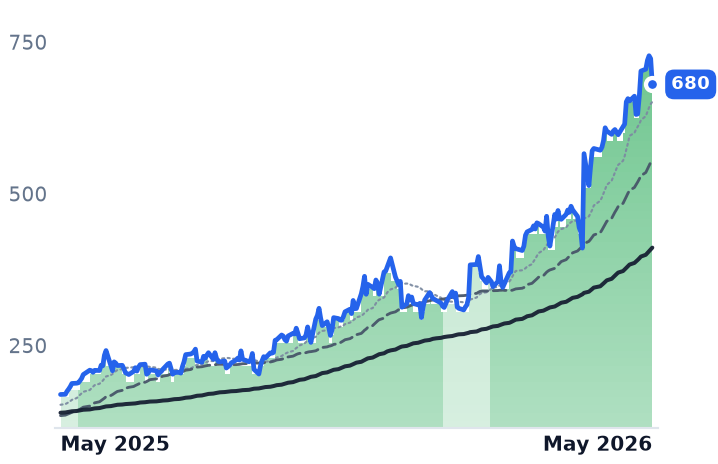
PWR | $100.3B | 75.5x | 42.9x | 3.1x | 2.7x | 21.2x | 18.5x | 35.1x | 2.4% |
MTZ | $21.1B | 41.4x | 28.6x | 1.3x | 1.2x | 11.4x | 10.0x | 21.9x | 1.2% |
AGX | $8.0B | 49.0x | 47.2x | 7.7x | 6.2x | 36.7x | 29.8x | 40.7x | 6.1% |
| Ticker | Mkt cap | P/E | P/E fwd | P/S | P/S fwd | P/GP | P/GP fwd | EV/EBITDA | FCF yld |
|---|---|---|---|---|---|---|---|---|---|
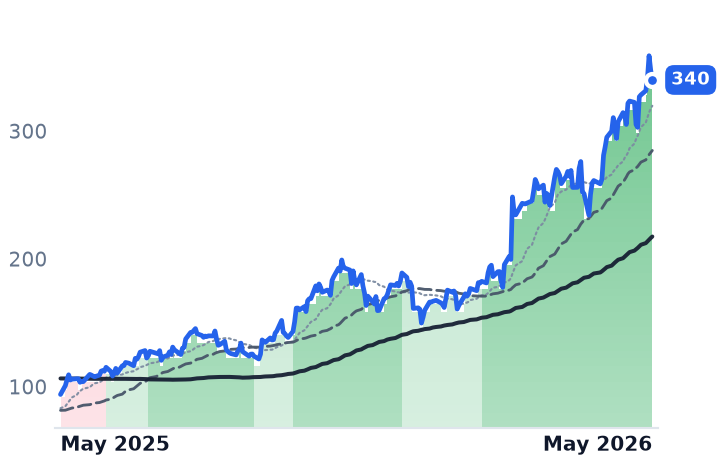
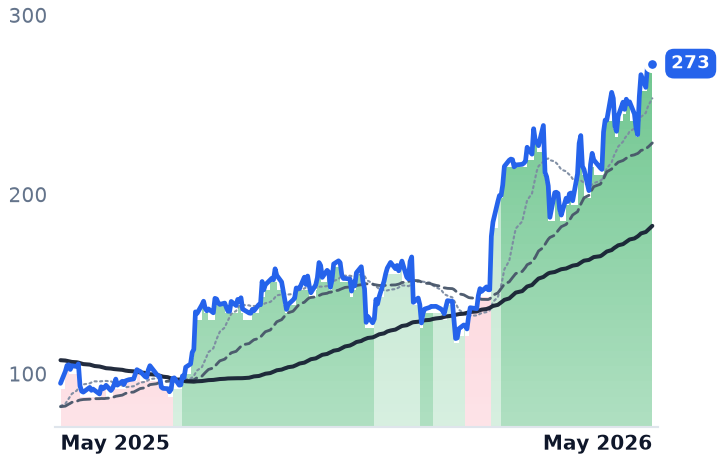
VRT | $142.5B | 91.1x | 57.7x | 13.1x | 10.3x | 36.3x | 28.5x | 61.1x | 1.6% |
MOD | $14.3B | 146.4x | 34.3x | 5.0x | 3.7x | 20.9x | 15.7x | 57.0x | 0.1% |
Consensus projections
| Ticker | FY2026E | FY2027E | FY2028E | |
|---|---|---|---|---|
DY | Revenue | +17.1% | +40.1% | +11.3% |
| EPS | +39.5% | +47.1% | +20.3% | |
HUBB | Revenue | +16.4% | +9.3% | +6.3% |
| EPS | +11.9% | +11.5% | +11.1% | |
GVA | Revenue | +19.3% | +6.7% | +5.7% |
| EPS | +40.3% | +20.4% | +12.6% | |
GTLS | Revenue | −0.4% | +4.5% | +2.5% |
| EPS | −10.1% | +13.4% | +7.3% | |
TT | Revenue | +9.9% | +8.3% | +8.2% |
| EPS | +14.5% | +14.1% | +14.0% | |
PRIM | Revenue | +2.8% | +11.4% | +7.6% |
| EPS | −12.3% | +24.1% | +10.2% | |
PWR | Revenue | +34.0% | +15.2% | +13.1% |
| EPS | +46.4% | +16.9% | +17.3% | |
MTZ | Revenue | +30.5% | +20.3% | +14.5% |
| EPS | +43.0% | +34.8% | +28.0% | |
AGX | Revenue | +12.1% | +36.2% | +25.4% |
| EPS | +65.8% | +44.2% | +29.3% | |
VRT | Revenue | +35.2% | +25.8% | +19.4% |
| EPS | +55.6% | +33.8% | +25.8% | |
MOD | Revenue | +22.6% | +21.8% | +19.1% |
| EPS | +33.4% | +52.5% | +31.7% |
Forward fiscal years only. Blank means no analyst coverage for that year.
What's Happening
Across the AI2-labeled buildout categories — Construction/MEP, Power & Grid, Cooling & Thermal — a bifurcation has opened between leaders that have already re-rated on post-earnings gaps and a second tier still trading in "gradual intensity" territory. The comparison is stark: within AI2: Construction, PWR is up +34.4% in 30 days, MTZ +22.8%, and AGX +18.9% (with a 90-day run of +92.1%). Against that backdrop, DY and GVA have seen more measured moves, and HUBB has barely moved at all.
The five largest hyperscalers (Amazon, Alphabet, Meta, Microsoft, Oracle) collectively raised their 2026 CapEx budgets to nearly $718 billion, a ~70% YoY increase — the macro demand floor for every name in this scan.
DY — The Most Structurally De-Risked Laggard
Dycom Industries is up roughly +22.9% in 30 days and +17.9% in 90 days, sitting 7.9% below its 52-week high — "gradual" relative to the magnitude of its catalyst set. Its technical posture is confirmed strongly bullish (SMA crossover score 3/3).
The fundamental case is unusually well-documented. Dycom's record total backlog of $9.54B — growing 20%+ YoY in the 12-month tranche — spans fiber-to-home buildouts and direct hyperscaler inside-the-fence programs. The Q2 FY2026 earnings call confirmed new awards for inside-the-fence data center fiber and electrical work with hyperscalers directly, a scope described by management as "an entirely new service line."
The $1.95B acquisition of Power Solutions — a premier data center electrical contractor based in Northern Virginia, generating ~$1B in annual revenue at 15% growth and mid-to-high teen EBITDA margins — immediately expands DY's addressable scope inside the largest US data center hub. DY's CEO has stated the TAM for data center outside-plant fiber infrastructure exceeds $20B over the next five years, with spend backloaded and increasing. FY2026 revenue guidance sits at $5.29B–$5.425B; analyst consensus for FY2027 is $7.04B (+29% YoY), with BEAD federal broadband upside excluded from guidance. Forward P/S of 1.82x looks modest against that pipeline.
HUBB — Flattest Performer, Clearest Fundamental Mismatch
Hubbell is the most extreme divergence in the pack: -1.3% in 30 days, 12.9% below its 52-week high of $565.50 (current: ~$492.58), yet its Q1 2026 operating results were arguably its strongest in years. Hubbell reported Q1 2026 data-center revenue +40% YoY in Electrical Solutions and grid infrastructure organic growth of +18% in Utility Solutions, and raised full-year organic growth guidance to 6–9% with adjusted EPS guidance lifted to $19.30–$19.85. Q4 2025 data center revenue exceeded 60% YoY growth; the PowerGain modular power distribution skid line is fully booked through 2026 with backlog still accumulating. HUBB's Burndy-branded connectors are specified directly into hyperscaler reference designs.
The drag is identifiable and arguably transient: the Grid Automation segment (Aclara AMI meters) contracted -7% organically in Q1 2026, depressing blended reported growth and muddying the narrative. That masks underlying acceleration in Grid Infrastructure and Electrical Solutions. Management also flagged a new $1.5B TAM in 765kV high-voltage transmission as an incremental runway over the next decade, with early project wins. HUBB's forward PE of ~25x and forward EV/EBITDA of ~19.6x sit at a meaningful discount to ETN (~27x PE) and well below VRT (~70x trailing) — the widest valuation gap within the Power & Grid AI2 tier. Technical band: strongly bullish, score 3/3.
GVA — Post-Earnings Re-Rating, Still Close to Highs
Granite Construction reported Q1 2026 revenue +30% YoY to $912M, raised 2026 revenue guidance to $5.2B–$5.4B, and holds a record $7.2B CAP backlog (+24% YoY). GVA has formed a dedicated data center site development team targeting work in Washington, Oregon, Nevada, Arizona, Louisiana, and Mississippi, with data center expected to grow toward ~10% of total revenues. Analyst price targets of $132–$161 imply up to 31% upside from recent levels, supported by a dual-driver backlog (federal border/infrastructure + private data center). At +17% in 30 days and only 2.2% off its 52-week high, GVA has partially re-rated — less gradual than DY or HUBB, but not violent either. Strongly bullish band confirmed.
Structural Exclusions: GTLS and PRIM
GTLS (Chart Industries) looks flat on price (-0.1% in 30 days, 0.0% in 90 days) but that flatness is not pre-catalyst consolidation — it is a function of a balance-sheet restructuring overhang. Trailing PE is 234x due to a Q3 2025 operating loss of -$88.5M, full-year 2025 net income collapsed to $42M on $4.26B revenue (net margin ~1%), and net debt exceeds $3B from the Howden acquisition. GTLS has built a dedicated data center commercial team with 50+ potential customers, and its data center commercial pipeline is ~$400M for the next 12–18 months — the exposure is real, but execution drag is the story, not hyperscaler exclusion.
PRIM (Primoris Services) is a structural outlier in the other direction — -28.6% in 30 days, -27.9% in 90 days, and 49% below its 52-week high. This is a severe drawdown, not a laggard setup.
Cooling Sector Context
The global AI data center liquid cooling market is projected to approach $7B by 2029, growing from ~$3B in 2025 as GPU thermal design power exceeds 4,000W. Longer-term estimates put the market at $15.3B+ by 2035 at a ~17% CAGR, with direct-to-chip cooling at 47% share — structural tailwind for VRT, TT, MOD, and, contingently, GTLS. TT (Trane Technologies) is up +8.2% in 30 days with Q1 2026 Americas Commercial HVAC bookings +40% YoY and Applied Solutions bookings +160% YoY — but at 31.5x forward PE it is already substantially re-rated, trading near 52-week highs.
Summary Matrix
| Ticker | 30d Return | Off 52w High | Band | Verdict |
|---|---|---|---|---|
| DY | +22.9% | -7.9% | strongly bullish | Gradual — runway remains |
| HUBB | -1.3% | -12.9% | strongly bullish | Flattest in category — mismatch vs. fundamentals |
| GVA | +17.0% | -2.2% | strongly bullish | Partially re-rated, still constructive |
| TT | +8.2% | -7.4% | strongly bullish | Already re-rated at premium multiple |
| GTLS | -0.1% | n/a | strongly bullish | Structural drag — execution, not exclusion |
| PRIM | -28.6% | -49.0% | — | Severe drawdown — structural issue |