

Ichor Costs Twice What Ultra Clean Does for the Same Gas Panels and Same Customers
Hypothesis Opus 5 · Research Opus 5 · Writing Opus 5 · Prompt v1.5
Two companies build the same product — precision gas and chemical delivery panels, made to other firms' blueprints — and ship it to the same two buyers, Lam Research and Applied Materials. One of them trades at more than double the other's multiple, and the cheaper one is growing faster at a better margin.
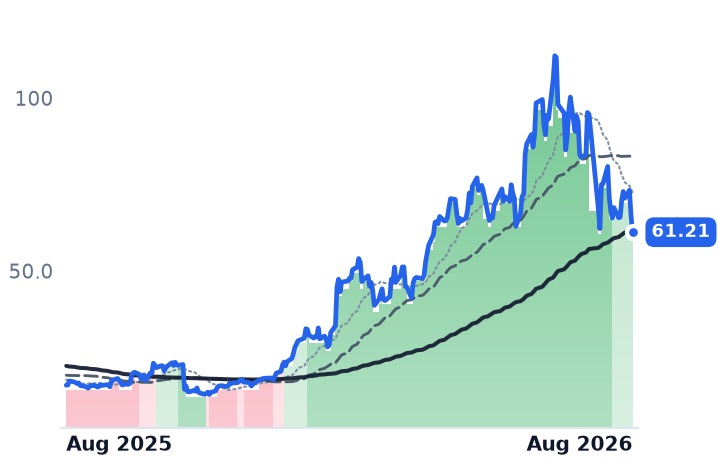
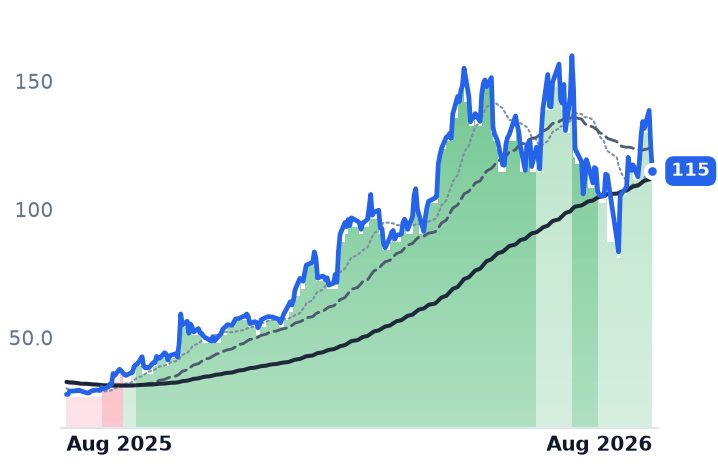
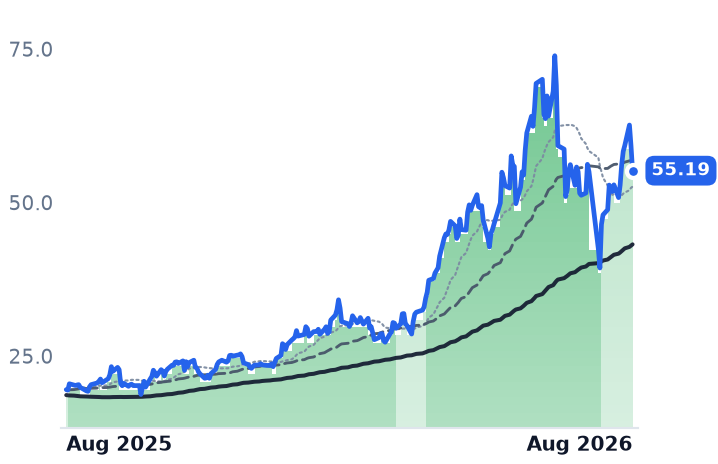
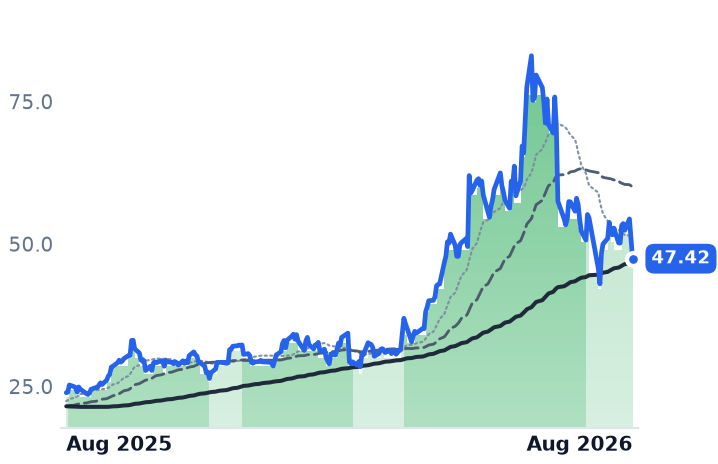
Ichor Holdings raised full-year guidance to at least 30% growth on 3 August and has lost roughly a quarter of its value since. Yet at 20.8x trailing gross profit it still sits at 2.2x Ultra Clean Holdings' 9.7x, despite a 13.9% gross margin against Ultra Clean's 16.1%. The de-rating in Ichor is real and unfinished. MKS, which cut net leverage to 3.0x from 4.0x while revenue accelerated, has fallen furthest against its own business. Axcelis is the one where consensus expects gross profit to shrink.
| Ticker | Company | Segment | Trend · 13mo | 30D | 1Y |
|---|---|---|---|---|---|
| The subject · what this brief is about | |||||
ICHR | Ichor | Other | 🟢 Cont. Bull | −36.1% | +261.5% |
MKSI | MKS | Instrumentation & Test Equipment | 🟢 Cont. Bull | −18.5% | +184.7% |
ACLS | Axcelis Technologies | Semiconduct Equipment | 🟢 Cont. Bull | −11.7% | +59.9% |
| Compared against · context, not the story | |||||
UCTT | Ultra Clean | Semiconductor Subsystems | 🟢 Cont. Bull | −28.7% | +235.8% |
FORM | FormFactor | Process Control & Metrology | 🟢 Cont. Bull | +1.1% | +312.0% |
COHU | Cohu | Semiconduct Equipment | 🟢 Cont. Bull | −1.8% | +182.6% |
VECO | Veeco Instruments | Semiconduct Equipment | 🟢 Cont. Bull | −14.0% | +98.4% |
LRCX | Lam Research | Semiconduct Equipment | 🟢 Cont. Bull | −4.6% | +211.3% |
AMAT | Applied Materials | Semiconduct Equipment | 🟢 Cont. Bull | −12.1% | +210.1% |
ENTG | Entegris | Semiconductor Subsystems | 🟢 Cont. Bull | +2.9% | +82.2% |
ONTO | Onto Innovation | Semiconduct Equipment | 🟢 Cont. Bull | +0.2% | +182.7% |
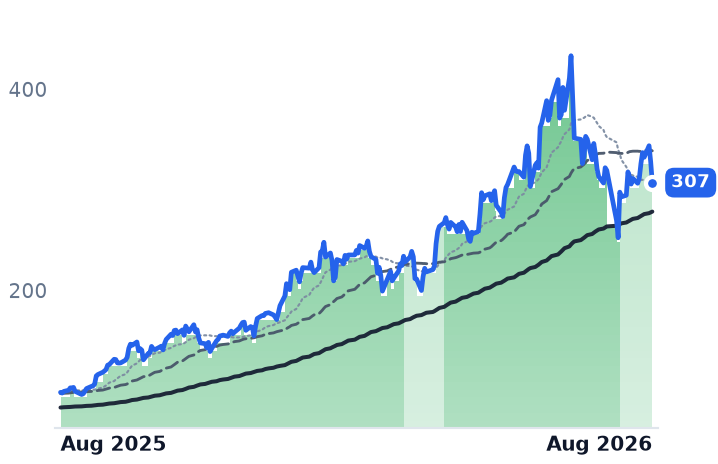
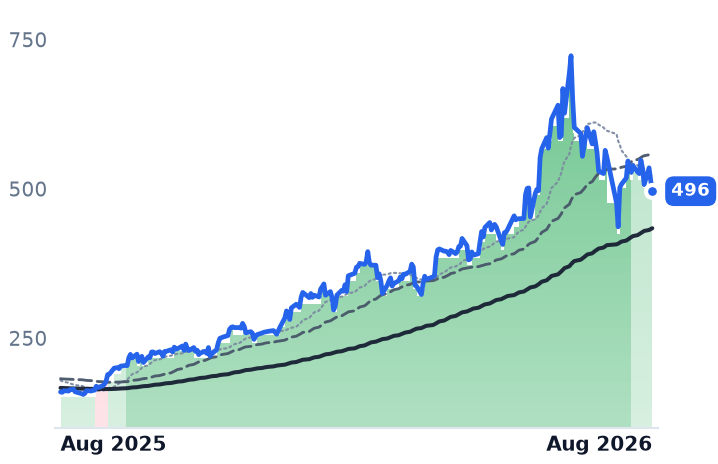
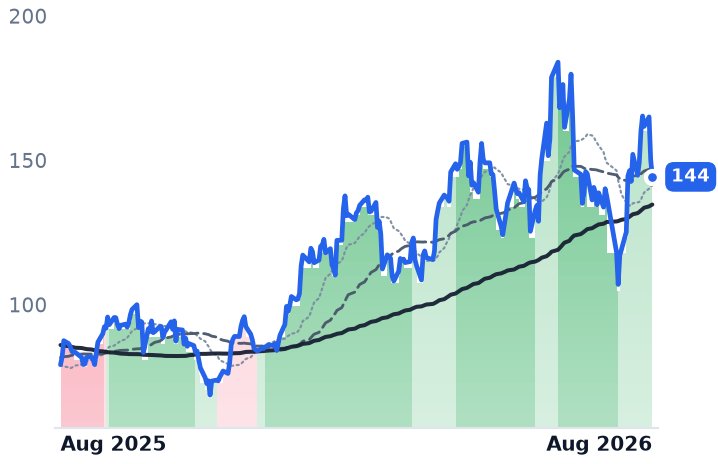
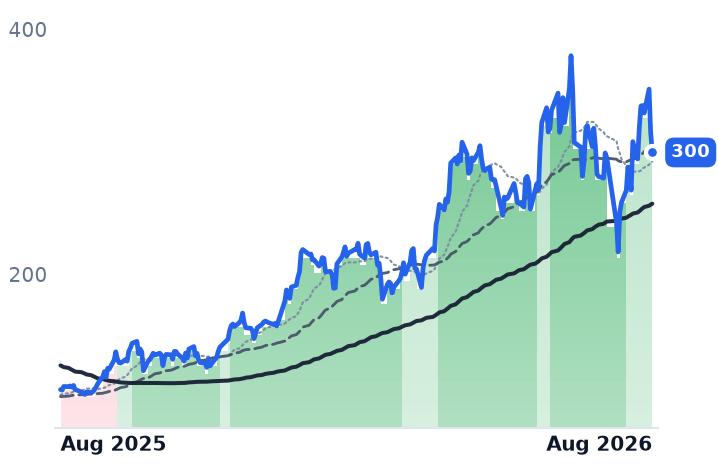
12-month price & trend
| Ticker | Mkt cap | P/E | P/E fwd | P/S | P/S fwd | P/GP | P/GP fwd | EV/EBITDA | FCF yld |
|---|---|---|---|---|---|---|---|---|---|
ICHR | $2.1B | n/m | 39.0x | 2.1x | 1.7x | 20.8x | 17.0x | 324.1x | -1.2% |
UCTT | $3.4B | n/m | 23.7x | 1.5x | 1.2x | 9.7x | 7.8x | 32.1x | -3.4% |
MKSI | $19.0B | 43.1x | 21.4x | 4.4x | 3.7x | 9.9x | 8.5x | 24.1x | 2.4% |
| Ticker | Mkt cap | P/E | P/E fwd | P/S | P/S fwd | P/GP | P/GP fwd | EV/EBITDA | FCF yld |
|---|---|---|---|---|---|---|---|---|---|
ACLS | $3.9B | 42.1x | 33.0x | 4.5x | 4.6x | 10.4x | 10.7x | 29.5x | 1.7% |
FORM | $9.0B | 77.7x | 37.7x | 9.9x | 8.7x | 21.8x | 19.0x | 51.8x | 1.5% |
COHU | $3.0B | n/m | 65.9x | 5.7x | 4.8x | 14.4x | 12.3x | 134.7x | 1.2% |
| Ticker | Mkt cap | P/E | P/E fwd | P/S | P/S fwd | P/GP | P/GP fwd | EV/EBITDA | FCF yld |
|---|---|---|---|---|---|---|---|---|---|
VECO | $3.3B | 142.0x | 34.9x | 4.9x | 4.2x | 12.9x | 11.1x | 62.8x | 2.6% |
LRCX | $430.0B | 59.4x | 36.7x | 18.5x | 12.4x | 36.7x | 24.6x | 49.2x | 1.1% |
AMAT | $425.0B | 45.9x | 43.6x | 13.8x | 12.7x | 27.9x | 25.7x | 37.3x | 1.5% |
| Ticker | Mkt cap | P/E | P/E fwd | P/S | P/S fwd | P/GP | P/GP fwd | EV/EBITDA | FCF yld |
|---|---|---|---|---|---|---|---|---|---|
ENTG | $20.3B | 76.6x | 36.6x | 6.3x | 5.9x | 14.5x | 13.6x | 27.9x | 3.4% |
ONTO | $17.5B | 130.5x | 48.8x | 15.6x | 13.0x | 31.0x | 25.8x | 66.8x | 1.4% |
Consensus projections
| Ticker | FY2026E | FY2027E | FY2028E | |
|---|---|---|---|---|
ICHR | Revenue | +31.2% | +31.5% | +9.9% |
| EPS | +821.7% | +108.2% | +12.8% | |
UCTT | Revenue | +32.8% | +42.0% | +11.6% |
| EPS | +200.0% | +106.9% | +17.9% | |
MKSI | Revenue | +29.6% | +20.1% | +8.8% |
| EPS | +67.0% | +33.3% | +13.8% | |
ACLS | Revenue | +3.5% | +9.6% | +20.0% |
| EPS | −14.8% | +26.4% | +41.7% | |
FORM | Revenue | +32.4% | +15.9% | +2.5% |
| EPS | +170.0% | +23.0% | +16.9% | |
COHU | Revenue | +35.3% | +25.7% | +15.3% |
| EPS | +131844.4% | +94.3% | +38.4% | |
VECO | Revenue | +18.6% | +35.6% | — |
| EPS | +17.4% | +101.8% | — | |
LRCX | Revenue | +27.0% | +49.0% | +18.6% |
| EPS | +41.9% | +64.7% | +25.5% | |
AMAT | Revenue | +18.3% | +28.9% | +20.8% |
| EPS | +31.2% | +38.7% | +28.8% | |
ENTG | Revenue | +8.4% | +11.6% | +7.4% |
| EPS | +33.5% | +27.8% | +13.9% | |
ONTO | Revenue | +2.2% | +33.5% | +23.2% |
| EPS | −5.1% | +44.8% | +35.6% |
Forward fiscal years only. Blank means no analyst coverage for that year.
Ichor Holdings assembles precision gas and chemical delivery panels — welded fluid modules, machined blocks, finished subsystems — to other companies' engineering drawings, then ships them into the wafer-processing tools that Lam Research and Applied Materials sell to chipmakers. Those two customers were 76% of Ichor's 2025 revenue. Its order book is therefore those two firms' build plans, one quarter early — not an independent read on artificial-intelligence demand.
On 3 August Ichor raised full-year revenue growth guidance to at least 30%, guided the September quarter to $315-345m, and said customers were placing orders six months out — a pattern management called abnormal. June-quarter revenue rose 22.7% to $294.8m, and gross margin recovered to 13.9% from a 4.6% trough last autumn. The shares fell 12.8% on a revenue miss management traced to a flow-controller shortage that pushed shipments into July.
The comparison that matters
Ultra Clean Holdings does the identical thing. It contests the same gas-delivery, frame and subsystem-integration content, and Applied and Lam are the largest customers of both firms. In the June quarter Ultra Clean grew revenue 24.3% to $644.9m at a 16.1% gross margin — faster growth, fatter margin, same demand signal.
Ichor trades at 20.8x trailing and 17.0x forward gross profit. Ultra Clean trades at 9.7x and 7.8x. Gross profit is the honest lens here because Ichor lost money over the past twelve months, leaving its trailing price-to-earnings ratio meaningless. Ichor's own multiple has already come down hard: 43.6x at the 30 June peak, 28.5x in mid-May, 20.8x now. It was about 5.5x a year ago. The de-rating is genuine and it is not obviously finished.
MKS: the business improved, the multiple halved
MKS supplies vacuum and pressure control, radio-frequency power delivery, plasma and reactive-gas products and lasers — and, through its 2022 purchase of Atotech, electroplating chemistry for printed circuit boards and advanced packaging. Semiconductor was $554m of June-quarter revenue, or 44%; Electronics & Packaging contributed $381m, up 44%. Group revenue rose 28.3% to $1.248bn and operating margin reached 20.1% against 13.9% a year earlier.
The leveraged balance sheet from Atotech is shrinking rather than compounding. Net leverage fell to 3.0x adjusted EBITDA from 4.0x, helped by a $100m voluntary term-loan prepayment, and non-GAAP interest expense dropped to $33m from $46m. Management says chemistry demand is the strongest it has ever seen, with AI-grade chemistry now 15-20% of chemistry revenue against roughly 5% in 2024.
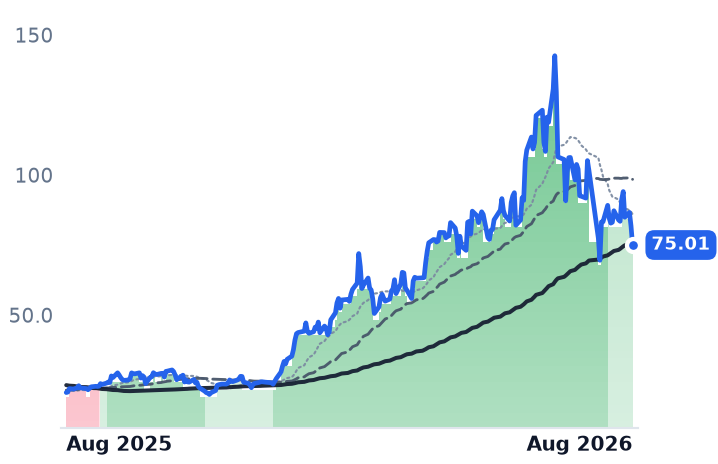
MKS now trades at 9.9x trailing gross profit, below the 12.1x of mid-May and far under 17.8x at the June peak. Its forward price-to-earnings ratio of 21.4x is half the 43.1x trailing figure — consensus has 2026 earnings of $13.13 a share rising to $17.50 in 2027.
Axcelis: the one where the numbers agree with the price
Axcelis builds ion implanters, which drive dopant atoms into wafers, sold largely into mature-node automotive, industrial and silicon-carbide power customers. Revenue rose 10.6% to $215.2m, but gross margin slipped to 42.4% from 47.0% in the December quarter and operating income fell 30%. Backlog was $452m on a book-to-bill of roughly 1x. China rose to 46% of revenue from 40%.
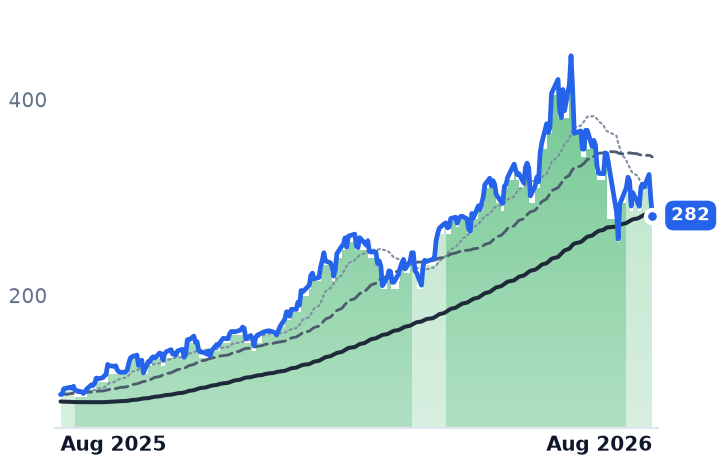
Its forward price-to-gross-profit of 10.7x sits above its trailing 10.4x — consensus expects gross profit to shrink. Axcelis is also the only one of the three with a binary event pending: its $4.4bn all-stock merger with Veeco has cleared US and European review and both shareholder votes, but China's competition regulator moved the case into an in-depth review.
What actually moved the shares
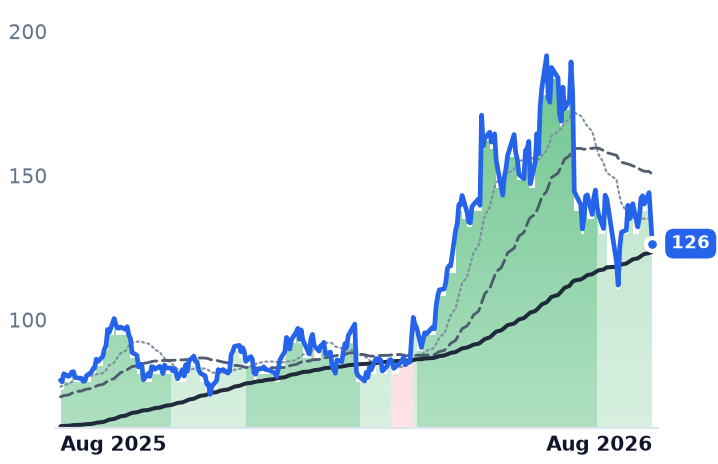
Nothing sub-fab-specific. On 28 July a Chinese state-backed firm began mass-producing immersion lithography machines and worries spread that AI infrastructure spending was peaking; chip stocks lost more than $1trn. On 18-19 August the 30-year Treasury yield hit a 19-year high of 5.33%, taking the sector down again. Remove each name's two best and two worst sessions from the past month and Ichor's 27% decline becomes 16%, MKS's becomes 4%, and Axcelis is flat. FormFactor, which sells probe cards for testing high-bandwidth memory, rose over the same stretch on record DRAM probe-card volumes.
The spending backdrop went the other way too: Lam raised its 2026 wafer-fab-equipment forecast to the low-$150bn range from $140bn. All three peaked in late June; Ichor is 45.5% below its $112.28 high, MKS 36.7% below, Axcelis 34.0%.
The setup
Where it stands — Two near-identical subsystem builders serve the same two customers, and Ichor's multiple is more than double Ultra Clean's. Would confirm — Ichor's gross margin rising roughly 100 basis points a quarter through Q4, as guided, while the discount to Ultra Clean persists. Would invalidate — Ichor's September quarter landing below the $315m guidance floor, or Lam and Applied cutting 2027 build plans. Watch next — Ichor's September-quarter report; China's competition ruling on the Axcelis-Veeco merger, targeted to close in 2026. Valuation — Ichor 20.8x trailing and 17.0x forward gross profit; Ultra Clean 9.7x and 7.8x; MKS 9.9x and 8.5x.