

Cadence's Best Quarter Ever Cost It 14% After One Open-Source Chip
Hypothesis Opus 5 · Research Opus 5 · Writing Opus 5 · Prompt v1.3
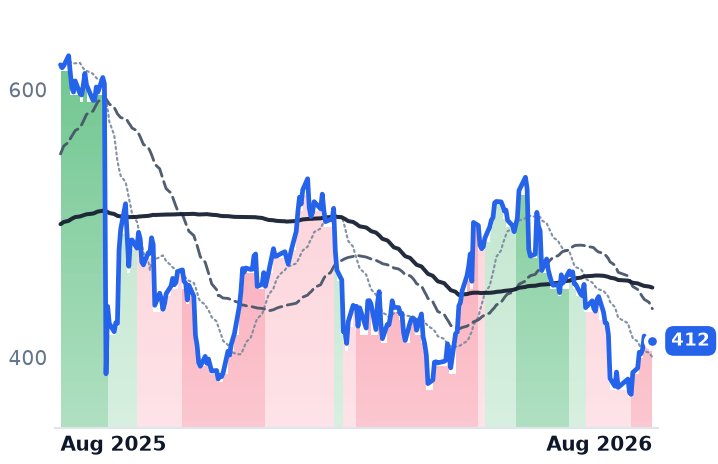
On 17 July an open-weight model from Chinese lab Moonshot AI completed a full semiconductor design flow in 48 hours using only free, open-source tools — no software from Cadence Design Systems or Synopsys, the two companies whose licences the chip industry has treated as unavoidable. Both stocks fell about 9% that session, and Cadence has since given back 14.5% over six days.
The businesses say the opposite. Cadence grew revenue 24.2% last quarter to $1.584bn, booked a record $8.1bn backlog and raised annual guidance by the largest amount in its history; it still trades at 39.7x forward earnings, the richest of the eight design- and developer-software names here. Synopsys is the one where the numbers agree with the tape: operating margin fell from 23.5% to 10.4% as its Ansys acquisition landed.
Meanwhile Atlassian, Adobe, Autodesk and PTC rallied. Synopsys reports 26 August.
| Ticker | Company | Segment | Trend | 30D | 1Y |
|---|---|---|---|---|---|
| The subject · what this brief is about | |||||
TEAM | Atlassian | Developer Tools & DevOps | 🔴 Cont. Bear | +74.3% | −5.3% |
GTLB | GitLab | Developer Tools & DevOps | 🌱 Emerging Bull | +23.7% | −1.7% |
FIG | Figma | Design & Content Creation | 🔴 Cont. Bear | −0.5% | −71.0% |
CDNS | Cadence Design Systems | Developer Tools & DevOps | 🌱 Emerging Bull | −14.2% | −7.4% |
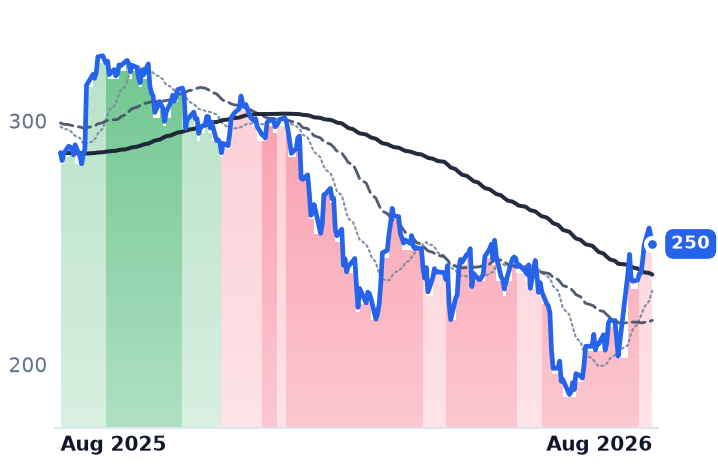
SNPS | Synopsys | EDA & Design Tools | 🔴 Cont. Bear | −3.2% | −33.3% |
ADSK | Autodesk | Design & Content Creation | 🔴 Cont. Bear | +21.2% | −13.1% |
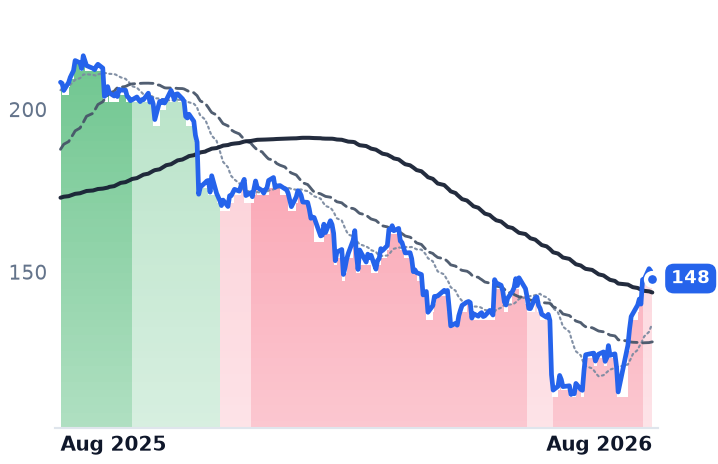
PTC | PTC | Specialized Enterprise Solutions | 🔴 Cont. Bear | +20.8% | −29.0% |
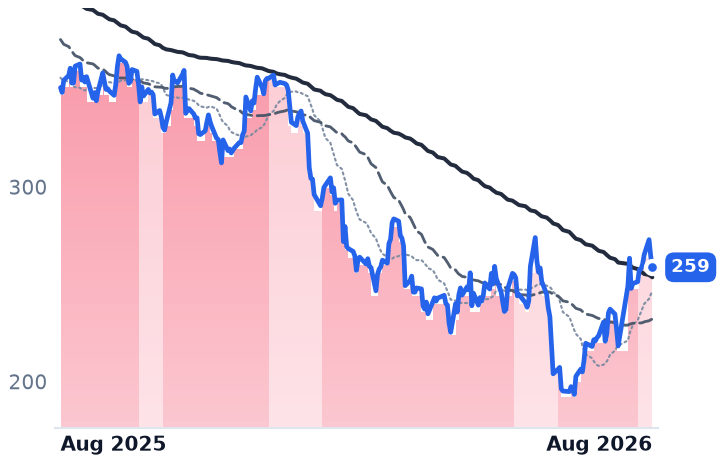
ADBE | Adobe | Design & Content Creation | 🔴 Cont. Bear | +17.2% | −26.3% |
| Compared against · context, not the story | |||||
DDOG | Datadog | Data & Analytics Platforms | 🟢 Cont. Bull | −10.3% | +88.6% |
MSFT | Microsoft | Cloud Infrastructure & Platforms | 🔴 Cont. Bear | +28.1% | −4.7% |
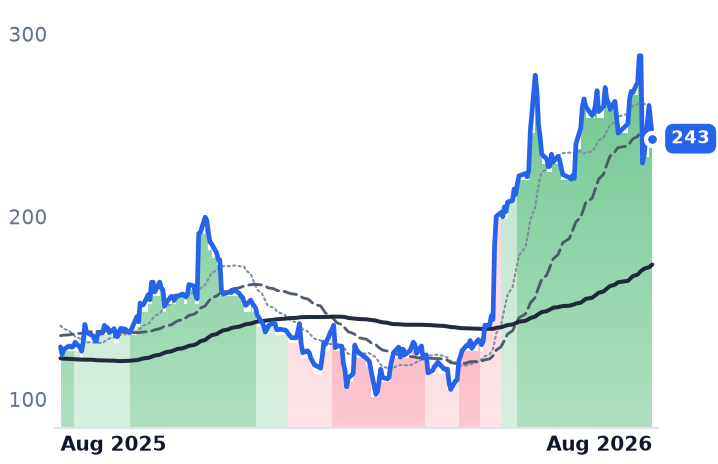
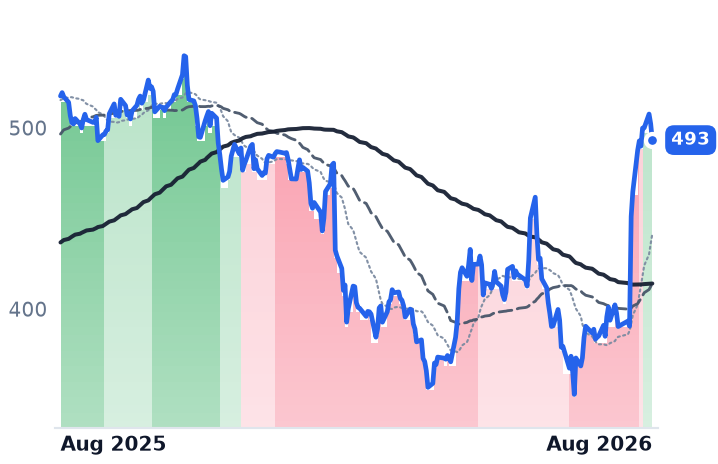
12-month price & trend
| Ticker | Mkt cap | P/E | P/E fwd | P/S | P/S fwd | P/GP | P/GP fwd | EV/EBITDA | FCF yld |
|---|---|---|---|---|---|---|---|---|---|
TEAM | $40.8B | n/m | 25.5x | 6.2x | 5.6x | 7.3x | 6.6x | 270.0x | 3.2% |
GTLB | $6.9B | n/m | 50.2x | 6.9x | 6.2x | 7.9x | 7.1x | n/m | 3.8% |
FIG | $11.6B | n/m | 83.0x | 9.0x | 7.9x | 11.4x | 10.0x | n/m | 2.0% |
| Ticker | Mkt cap | P/E | P/E fwd | P/S | P/S fwd | P/GP | P/GP fwd | EV/EBITDA | FCF yld |
|---|---|---|---|---|---|---|---|---|---|
CDNS | $89.0B | 63.9x | 39.7x | 15.2x | 14.1x | 17.2x | 15.9x | 41.2x | 1.9% |
SNPS | $79.0B | 93.3x | 27.9x | 9.1x | 8.2x | 12.4x | 11.1x | 32.2x | 3.4% |
ADSK | $52.7B | 36.2x | 19.8x | 7.0x | 6.4x | 7.7x | 7.1x | 24.3x | 5.2% |
| Ticker | Mkt cap | P/E | P/E fwd | P/S | P/S fwd | P/GP | P/GP fwd | EV/EBITDA | FCF yld |
|---|---|---|---|---|---|---|---|---|---|
PTC | $17.1B | 14.3x | 18.1x | 5.8x | 6.3x | 6.9x | 7.5x | 11.0x | 5.5% |
ADBE | $102.9B | 14.8x | 10.6x | 4.1x | 3.9x | 4.6x | 4.4x | 10.6x | 10.3% |
DDOG | $92.8B | 524.5x | 106.8x | 23.4x | 21.2x | 29.4x | 26.7x | 355.8x | 1.2% |
| Ticker | Mkt cap | P/E | P/E fwd | P/S | P/S fwd | P/GP | P/GP fwd | EV/EBITDA | FCF yld |
|---|---|---|---|---|---|---|---|---|---|
MSFT | $3.8T | 28.2x | 25.8x | 11.3x | 9.7x | 16.7x | 14.2x | 18.7x | 1.8% |
Consensus projections
| Ticker | FY2026E | FY2027E | FY2028E | |
|---|---|---|---|---|
TEAM | Revenue | +24.7% | +13.4% | +15.9% |
| EPS | +55.5% | +10.5% | +18.0% | |
GTLB | Revenue | +25.6% | +17.8% | +15.3% |
| EPS | +40.9% | −8.9% | +25.2% | |
FIG | Revenue | +40.5% | +23.8% | +24.2% |
| EPS | −24.5% | +26.7% | +34.4% | |
CDNS | Revenue | +19.7% | +13.6% | +11.7% |
| EPS | +15.3% | +17.0% | +14.3% | |
SNPS | Revenue | +37.4% | +10.9% | +11.9% |
| EPS | +15.3% | +17.2% | +18.6% | |
ADSK | Revenue | +17.0% | +14.4% | +10.2% |
| EPS | +23.0% | +23.1% | +12.7% | |
PTC | Revenue | +4.9% | +6.2% | +7.5% |
| EPS | +20.1% | +8.5% | +10.5% | |
ADBE | Revenue | +12.0% | +9.1% | +8.8% |
| EPS | +17.2% | +12.7% | +14.2% | |
DDOG | Revenue | +28.9% | +21.5% | +23.5% |
| EPS | +20.9% | +17.3% | +23.1% | |
MSFT | Revenue | +18.0% | +18.2% | +19.6% |
| EPS | +26.7% | +15.4% | +18.5% |
Forward fiscal years only. Blank means no analyst coverage for that year.
An open-source chip, and the bill that never arrived
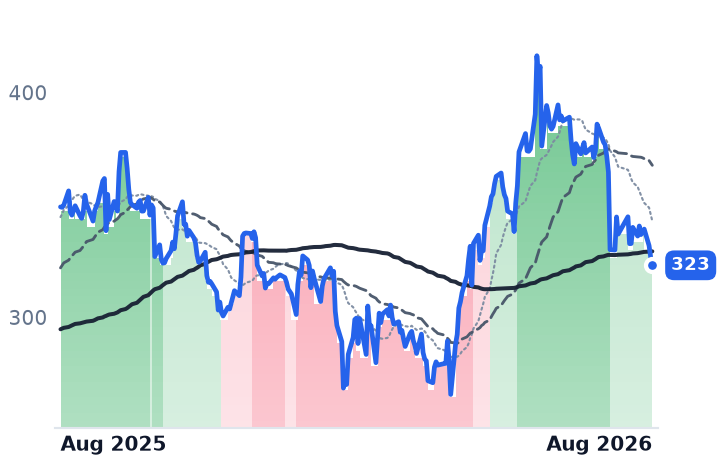
Electronic design automation — the software used to turn a chip architecture into a manufacturable layout — has been a two-company toll booth for two decades. On 17 July, Moonshot AI's Kimi K3, a 2.8-trillion-parameter open-weight model, ran the entire flow itself: architecture, register-transfer-level (RTL) code generation, synthesis, place-and-route and simulation verification, in 48 hours, using only open-source tools such as OpenROAD. No Cadence licence, no Synopsys licence. Both stocks fell roughly 9% that day, and Cadence went on to six consecutive down sessions totalling 14.5%, one of them erasing about $9.8bn of market value. Mizuho read the same release the other way, arguing that the model acts as a general-purpose agent invoking existing tools rather than replacing the platforms underneath.
That single event is why eight software names the market spent a year de-rating together no longer move together.
Cadence: the business contradicts the tape
Cadence Design Systems, which sells chip-design software, verification hardware and licensable circuit blocks to semiconductor firms, grew June-quarter revenue 24.2% to $1.584bn at a 28.4% operating margin, with net income up 129.3%. Backlog hit a record $8.1bn, first-half bookings rose about 55%, and management called it the largest single-quarter raise to annual guidance in company history — $6.26bn-$6.34bn for 2026, explicitly assuming export rules stay substantially unchanged. Its own agentic products are live: a validation agent in more than 20 production engagements cutting five-week RTL checks to under a day. CONTRADICTS. Valuation is the counterweight: 63.9x trailing and 39.7x forward earnings, 14.1x forward sales, 41.2x enterprise-value-to-EBITDA and a 1.9% free-cash-flow (FCF) yield — still the most expensive name in this group after the fall, though down from roughly 79x trailing three weeks ago. INCONCLUSIVE on valuation.
Synopsys, the number-two chip-intellectual-property franchise behind Arm, is the opposite case. Its headline 41.9% revenue growth is acquisition arithmetic: gross margin fell from 80.2% to 72.3%, operating margin from 23.5% to 10.4%, and net income dropped 95% as the Ansys deal amortised. CONFIRMS. At 27.9x forward, against roughly 45x in the spring, it is the only name in the group whose 50-day average sits below its 200-day and falling. It reports third-quarter results on 26 August.
Atlassian did the work, and got paid for it
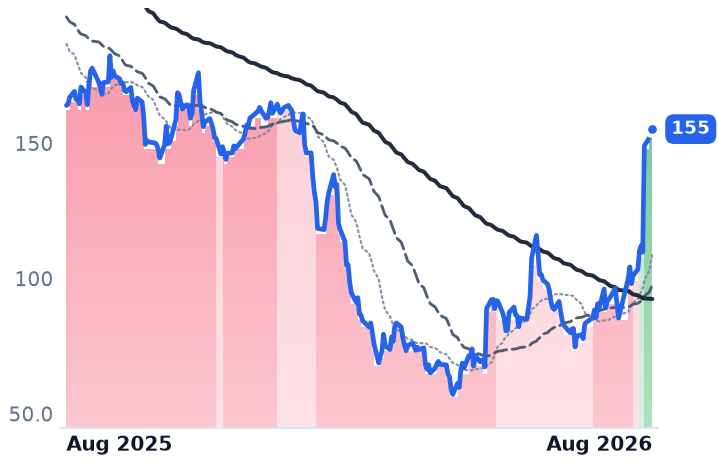
Atlassian, the Sydney maker of Jira and Confluence sold per user seat, grew fiscal 2026 revenue 26.0% to $6.572bn, cloud revenue 31% in the June quarter, remaining performance obligations 44% to $4.8bn and free cash flow 32% to $475m. Management says core seat counts are expanding again after disclosing the first enterprise seat decline in its history in May. CONFIRMS — but its own fiscal 2027 guide calls for total revenue growth of about 13% and non-GAAP operating margin of 25%, down from 36%, as Data Center revenue declines into a 2029 retirement. Price-to-sales went from 4.10x to 6.20x in ten sessions; at least 14 brokers raised targets after the 6 August print, averaging about $176 against a $155.24 close.
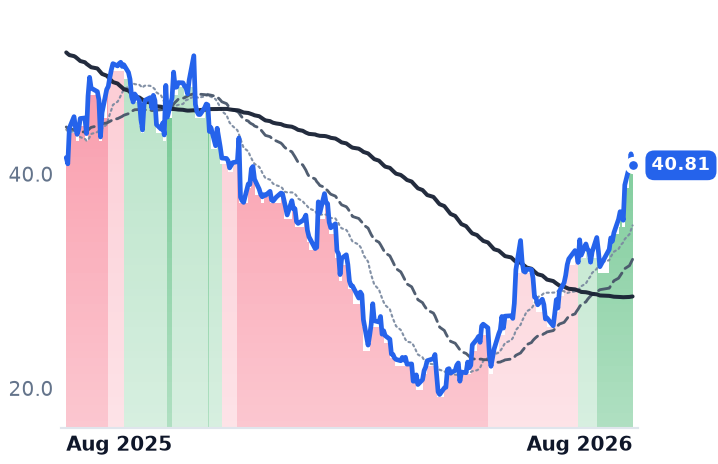
GitLab, which sells a single-application developer platform per seat, is the mirror image: growth has decelerated four straight quarters, 29.2% to 23.1%, with consensus at 17.8% next year, yet it trades at 50.2x forward earnings and 6.18x forward sales. Its 9.2% jump on 7 August came with no earnings, on renewed unconfirmed reporting that Datadog is exploring a bid above $60 a share. CONTRADICTS, in the expensive direction.
Where the business is ahead of the price
Adobe, which sells Creative Cloud and marketing software on subscription, grew revenue 12.7% to $6.618bn, though operating margin slipped from 35.9% to 33.8%. Its AI-first annual recurring revenue tripled past $500m with a third-quarter guide of $6.67bn-$6.72bn above $6.51bn consensus. It trades at 10.6x forward earnings against 14.8x trailing, on a 10.3% FCF yield.
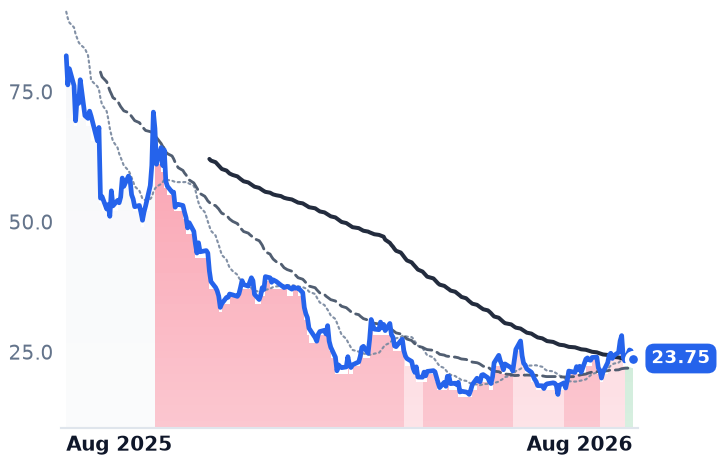
Autodesk, whose AutoCAD and Revit run architecture and construction projects, grew revenue 18.4% and operating income 60.1%, lifting operating margin from 20.7% to 28.0%; its spring de-rating traced to the $3.6bn all-cash purchase of MaintainX, not demand. It sits at 19.8x forward against 36.2x trailing and reports on 27 August. PTC, which sells product-lifecycle software to manufacturers, reached $2.448bn of ARR up 9.1% and raised full-year ARR guidance to 9.0%-9.5%, while buying back $525m of stock in one quarter citing its compressed price; headline revenue fell 6.8% purely on a divestiture. Figma, the browser-based design platform, grew revenue 48.2% to $370.1m with 136% net dollar retention and raised guidance by $40m, yet posted a $117.3m operating loss on inference costs and sits near the bottom of its 52-week range with a lock-up expiry at end-August. CONTRADICTS at all four.
The tape
Five of the eight — Adobe, Autodesk, PTC, Figma and Atlassian — turned their moving-average trend positive inside 30 days, while Cadence and Synopsys were downgraded on 17 and 30 July. The move has already stalled: over 10-12 August six of eight fell, averaging 2.0%, as money rotated back toward AI hardware even as hyperscaler capital spending stays guided up about 77% to $725bn.
The setup
Where it stands — Five design- and developer-software names re-rated on results; the two chip-design toolmakers de-rated on one AI demonstration, not on their numbers.
Would confirm — Cadence holds 2026 revenue guidance of $6.26bn-$6.34bn and backlog above $8.1bn at its next report.
Would invalidate — Synopsys guides fourth-quarter revenue below consensus on 26 August, or cites open-source tool competition in its outlook.
Watch next — Synopsys reports 26 August, Autodesk 27 August, Figma's lock-up unlocks end-August, Adobe's third quarter in September.
Valuation — Cadence 63.9x trailing, 39.7x forward; Adobe 14.8x trailing, 10.6x forward; Autodesk 36.2x trailing, 19.8x forward.