

GrafTech's 32% Rally Outpaces Steel Peers, But Its Own Trend Signal Never Turned
Hypothesis Opus 5 · Research Sonnet 5 · Writing Sonnet 5 · Prompt v1.0
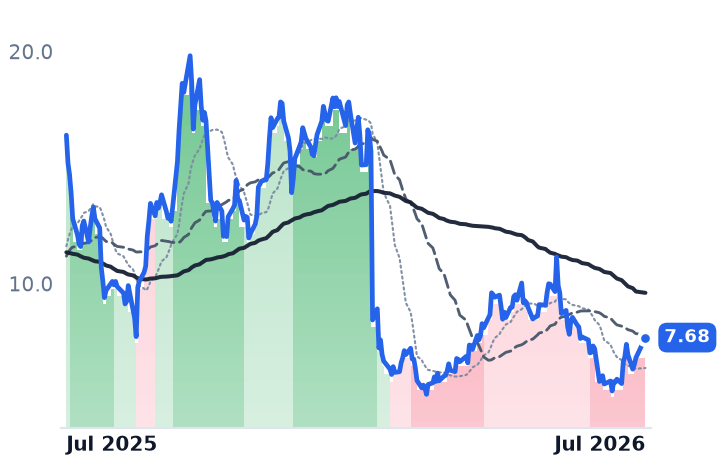
EAF is up 32.6% over the past month, but the stock's trend band has stayed in strongly bearish the entire time, roughly half the dollar gain came from two concentrated sessions rather than a broad grind higher, and steel-peer trend confirmation is mixed. Genuine macro tailwinds — tariffs, tightening electrode pricing, new anti-dumping duties — haven't yet translated into a validated technical reversal.
| Ticker | Company | Segment | Trend · 13mo | 30D | 1Y |
|---|---|---|---|---|---|
| The subject · what this brief is about | |||||
EAF | GrafTech International | Electrical Equipment & Parts | ⚠️ Emerging Bear | +32.6% | −53.2% |
| Compared against · context, not the story | |||||
NUE | Nucor | Integrated Steelmakers | 🟢 Cont. Bull | +16.5% | +85.8% |
STLD | Steel Dynamics | Long Products & Rebar | 🟢 Cont. Bull | +11.1% | +101.4% |
CLF | Cleveland-Cliffs | Flat-Rolled Steel | ⚠️ Emerging Bear | +27.7% | +6.4% |
TX | Ternium | Regional Integrated Mills | 🟢 Cont. Bull | +13.4% | +55.4% |
CMC | Commercial Metals | Long Products & Rebar | ⚠️ Emerging Bear | +9.4% | +34.9% |
MT | ArcelorMittal | Integrated Steelmakers | 🟢 Cont. Bull | — | — |
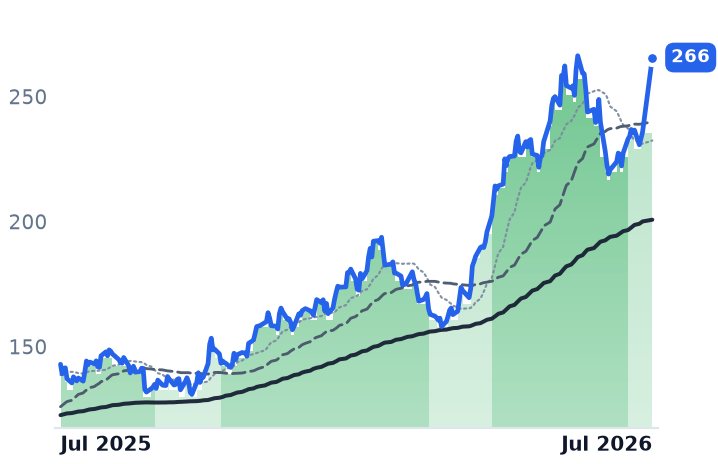
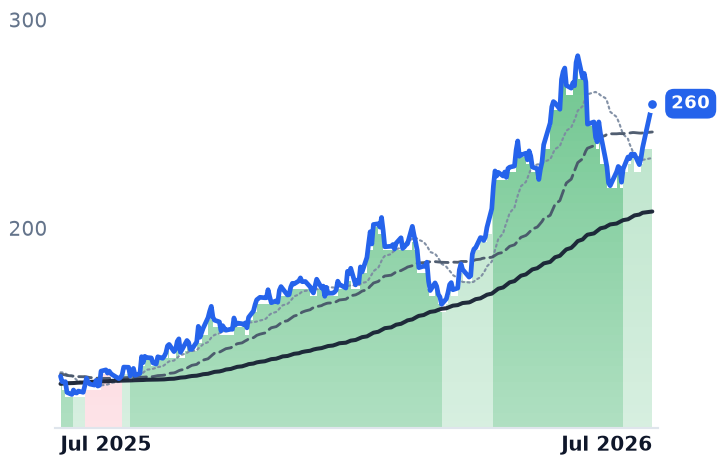
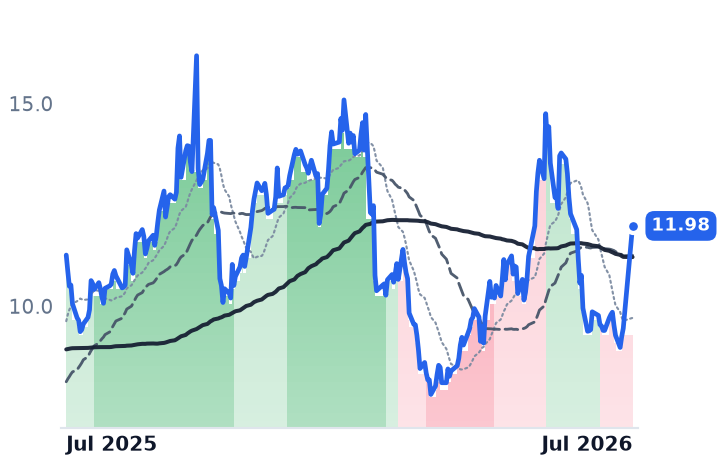
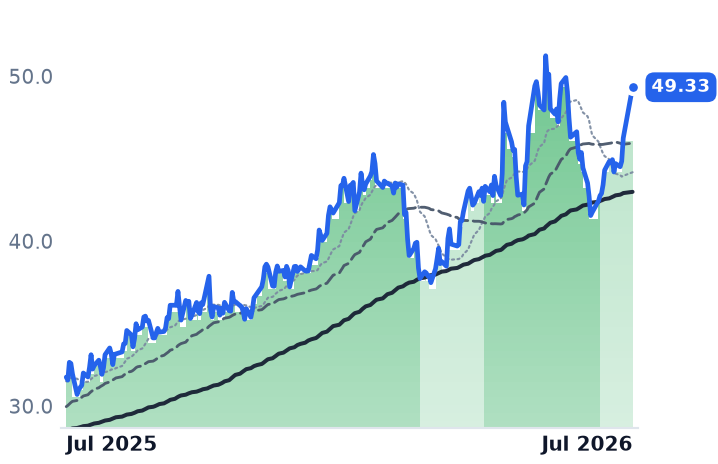
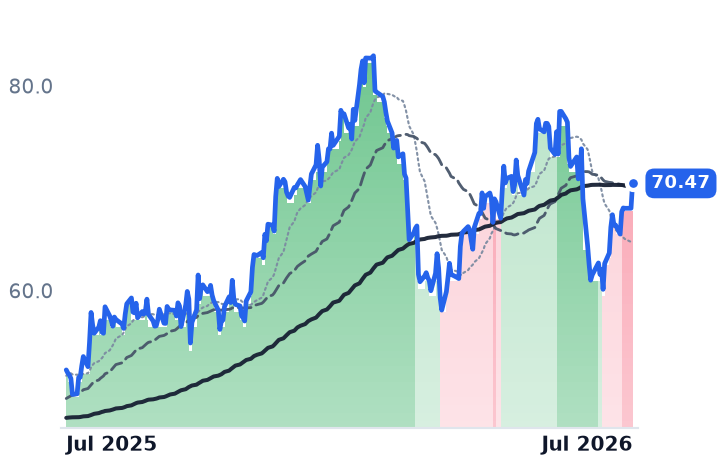
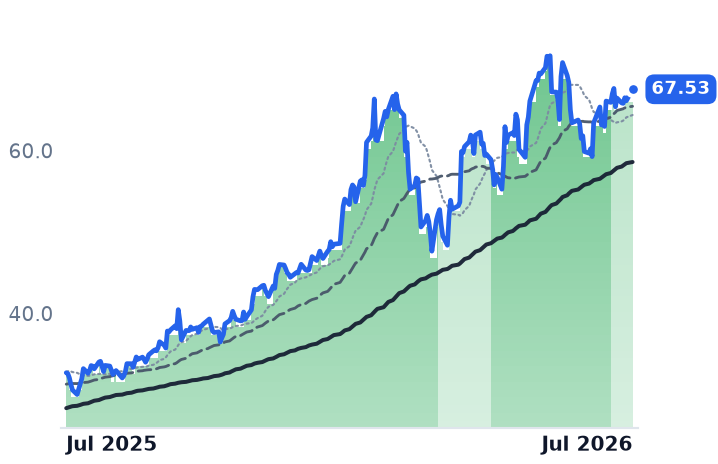
12-month price & trend
| Ticker | Mkt cap | P/E | P/E fwd | P/S | P/S fwd | P/GP | P/GP fwd | EV/EBITDA | FCF yld |
|---|---|---|---|---|---|---|---|---|---|
EAF | $233.4M | n/m | — | 0.5x | 0.4x | — | — | n/m | -45.0% |
NUE | $51.7B | 22.3x | 15.9x | 1.5x | 1.4x | 10.8x | 9.7x | 11.5x | 1.0% |
STLD | $33.1B | 24.2x | 15.2x | 1.7x | 1.5x | 12.4x | 10.7x | 15.1x | 2.0% |
| Ticker | Mkt cap | P/E | P/E fwd | P/S | P/S fwd | P/GP | P/GP fwd | EV/EBITDA | FCF yld |
|---|---|---|---|---|---|---|---|---|---|
CLF | $5.9B | n/m | — | 0.3x | 0.3x | — | — | 101.5x | -17.0% |
TX | $8.4B | 14.7x | 10.1x | 0.5x | 0.5x | 3.4x | 3.2x | 6.0x | -0.8% |
CMC | $7.9B | 15.6x | 11.1x | 0.9x | 0.9x | 5.3x | 4.9x | 11.9x | 5.0% |
| Ticker | Mkt cap | P/E | P/E fwd | P/S | P/S fwd | P/GP | P/GP fwd | EV/EBITDA | FCF yld |
|---|---|---|---|---|---|---|---|---|---|
MT | $45.8B | 15.8x | 12.9x | 0.7x | 0.7x | 7.8x | 7.3x | 8.4x | 1.1% |
Consensus projections
| Ticker | FY2026E | FY2027E | FY2028E | |
|---|---|---|---|---|
EAF | Revenue | −1.5% | +12.8% | — |
| EPS | −26.7% | −17.9% | — | |
NUE | Revenue | +16.3% | +2.4% | +1.5% |
| EPS | +79.7% | +9.6% | +6.0% | |
STLD | Revenue | +20.4% | +3.2% | +3.0% |
| EPS | +90.0% | +13.5% | +0.3% | |
CLF | Revenue | +9.2% | +2.3% | +0.6% |
| EPS | −78.7% | −155.5% | +40.0% | |
TX | Revenue | +5.3% | +5.0% | +3.8% |
| EPS | +39.8% | +30.4% | +11.0% | |
CMC | Revenue | +18.3% | +7.4% | +1.2% |
| EPS | +105.5% | +5.0% | −5.2% | |
MT | Revenue | +6.0% | +2.7% | — |
| EPS | +12.0% | +51.8% | — |
Forward fiscal years only. Blank means no analyst coverage for that year.
What's happening
GrafTech (EAF) closed at $5.79 on June 29 and $7.68 on July 28, a one-month gain of 32.6%. That's a real move and it outpaces every steel peer in its cohort over the identical window — Cleveland-Cliffs (+27.7%), Nucor (+16.2%), Steel Dynamics (+10.9%), and Ternium (+13.4%) all rose too, but none as much as EAF. The trouble is what the underlying trend signal says: EAF's moving-average trend signal band has read strongly bearish on every single date from June 23 through July 28, the exact window of the rally, after downgrading from mildly bearish to strongly bearish just days before the bounce began. By the tape's own trend classification, this stock has not left bear territory.
The concentration problem
The rally is also less gradual than the headline number implies. A single session on July 14 saw EAF jump 16.1%, from $5.70 to $6.62 — alone accounting for roughly half the month's dollar gain. The only identifiable news that day was a ratings tweak from Weiss Ratings, which moved EAF from 'sell (e+)' to 'sell (d-)' — still a sell rating, not an obvious catalyst for a double-digit move. The second leg came after GrafTech's July 23 earnings report, which did carry real substance: Q2 sales volume rose 8% year-over-year with capacity utilization hitting 74%, the highest since 2022, and new customer commitments were pricing more than 15% above pre-announcement levels. Notably, one data source flagged the quarter as missing EPS estimates by a penny rather than beating them, underscoring how noisy the read on this print already is.
Cohort confirmation is partial at best
Even among peers whose prices rose, trend bands tell a softer story: Nucor, Steel Dynamics, and Ternium all eased from strongly bullish to mildly bullish in mid-July, and Cleveland-Cliffs' band actually flipped to mildly bearish on July 7 despite its price climbing. Macro tailwinds are genuinely improving — Section 232 tariffs were restructured in April 2026 to apply full-value duties to more derivative steel products, US HRC imports roughly halved year-over-year through April as mill utilization hit multi-year highs, graphite electrode prices rose on tightening needle-coke supply in Q1 2026, and new US anti-dumping determinations against large-diameter graphite electrodes from China and India were published in April — distinct from the separate, larger battery-grade anode graphite duty case finalized in February.
Balance sheet and valuation
GrafTech's Q2 press release shows $1,225M gross debt against $253M liquidity, with no maturities until December 2029, though the company drew the last $100M of its delayed-draw term loan in June, just before that facility expired. Analyst price targets average $16.67 against a $7.68 price — over 2x upside on paper — but the consensus rating is only 'Hold,' and targets have moved in both directions this year.
The balance of evidence points to a distressed bounce riding real but not-yet-confirmed sector tailwinds, not a validated band exit.