

Memory Costs Cut Gross Margins at Dell, NetApp and Cisco. Only Cisco Was Punished.
Hypothesis Opus 5 · Research Opus 5 · Writing Opus 5 · Prompt v1.5
The same cost shock hit three enterprise hardware sellers, and the market reached opposite conclusions about it. Dell's gross margin fell 334 basis points year over year, to 17.75%, and its shares have tripled the price paid per dollar of gross profit since February. Cisco guided fiscal 2027 gross margin to 65-66% and lost 7.6% in a session — even though its AI infrastructure orders grew faster than either peer's, quadrupling to $9.3bn.
The reason is where the damage lands. Dell's case was never gross margin: operating income rose 197% last quarter on a shrinking one. Cisco's whole valuation rests on a software-and-services margin that hardware-heavy AI orders dilute. NetApp, guiding its own margin down on memory costs, has been treated like Dell rather than Cisco. Both Dell and NetApp report in the first days of September; Cisco has already printed.
| Ticker | Company | Segment | Trend · 13mo | 30D | 1Y |
|---|---|---|---|---|---|
| The subject · what this brief is about | |||||
DELL | Dell Technologies | Enterprise Storage & Software | 🟢 Cont. Bull | −1.5% | +244.2% |
NTAP | NetApp | Enterprise Storage & Software | 🟢 Cont. Bull | +16.3% | +82.2% |
CSCO | Cisco Systems | Enterprise Networking Infrastructure | 🟢 Cont. Bull | −1.2% | +68.3% |
| Compared against · context, not the story | |||||
HPE | Hewlett Packard Enterprise | Enterprise Storage & Software | 🟢 Cont. Bull | +10.2% | +147.5% |
SMCI | Super Micro Computer | Server & Infrastructure Systems | 🌱 Emerging Bull | +20.6% | −12.9% |
MU | Micron Technology | Memory (DRAM/NAND) | 🟢 Cont. Bull | +0.1% | +730.8% |
CLS | Celestica | Electronic Manufacturing Services | 🟢 Cont. Bull | −12.1% | +62.5% |
ANET | Arista Networks | Cloud Networking | 🟢 Cont. Bull | +6.0% | +40.4% |
MTSI | MACOM Technology Solutions | RF & Wireless | 🟢 Cont. Bull | −5.1% | +117.1% |
NXPI | NXP Semiconductors | Analog & Mixed-Signal | 🟢 Cont. Bull | −19.6% | +1.5% |
GLW | Corning | Display & Optical Materials | 🟢 Cont. Bull | −3.1% | +132.1% |
VST | Vistra | Integrated Retail & Generation | 🔴 Cont. Bear | −17.6% | −27.5% |
TEAM | Atlassian | Developer Tools & DevOps | 🔴 Cont. Bear | +99.0% | +3.2% |
TWLO | Twilio | Communications & Messaging Platforms | 🟢 Cont. Bull | +19.1% | +116.2% |
DOCN | DigitalOcean | Cloud Infrastructure & Platforms | 🟢 Cont. Bull | −21.3% | +274.6% |
FROG | JFrog | Developer Tools & DevOps | 🟢 Cont. Bull | +9.9% | +86.8% |
AKAM | Akamai Technologies | Network & Application Delivery | 🟢 Cont. Bull | −11.2% | +44.7% |
VEEV | Veeva Systems | Life Sciences Software & Data | 🌱 Emerging Bull | +34.3% | −12.2% |
FIG | Figma | Design & Content Creation | 🔴 Cont. Bear | +26.7% | −62.6% |
MCHP | Microchip Technology Incorporated | Analog & Mixed-Signal | 🟢 Cont. Bull | −10.7% | +17.4% |
MELI | MercadoLibre | Online Marketplaces | 🔴 Cont. Bear | +8.0% | −16.9% |
ITRN | Ituran Location and Control | IoT & Edge Connectivity | 🟢 Cont. Bull | −11.0% | +44.1% |
ADI | Analog Devices | Analog & Mixed-Signal | 🟢 Cont. Bull | −3.3% | +53.1% |
BTC-USD | Bitcoin USD | — | 🔴 Cont. Bear | +11.9% | −34.4% |
ETH-USD | Ethereum USD | — | 🔴 Cont. Bear | +21.5% | −44.5% |
CRM | Salesforce | Customer Experience & CRM | 🔴 Cont. Bear | +27.7% | −14.8% |
LSPD | Lightspeed Commerce | Marketplace & Commerce Platforms | 🌱 Emerging Bull | +7.6% | −10.4% |
FIVN | Five9 | Communications & Collaboration | 🌱 Emerging Bull | +42.8% | +28.5% |
WDAY | Workday | Enterprise Resource Planning | 🌱 Emerging Bull | +52.0% | −11.5% |
MNDY | monday.com | Other | 🔴 Cont. Bear | +22.2% | −47.3% |
ASAN | Asana | Other | 🌱 Emerging Bull | +37.0% | −31.2% |
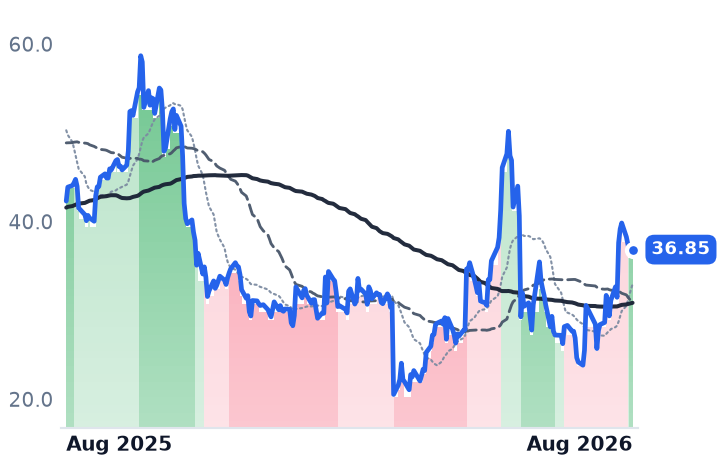
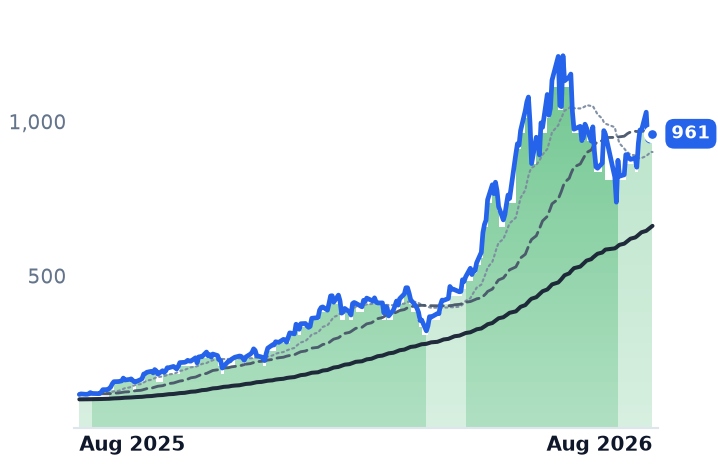
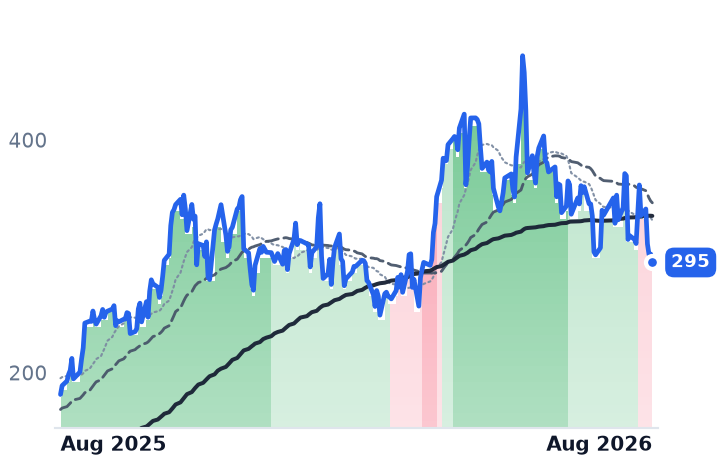
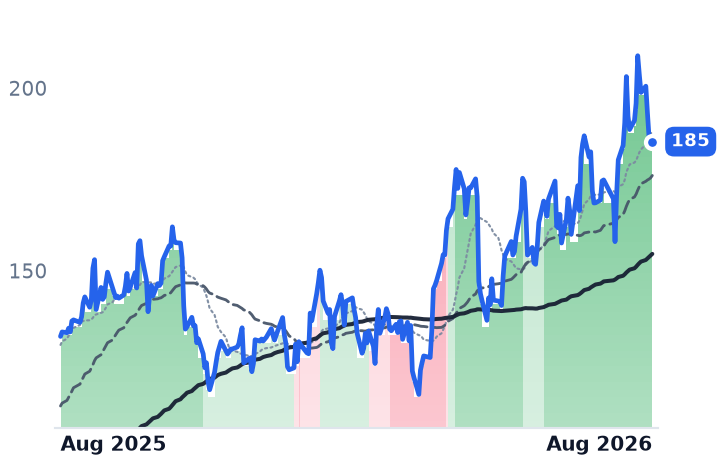
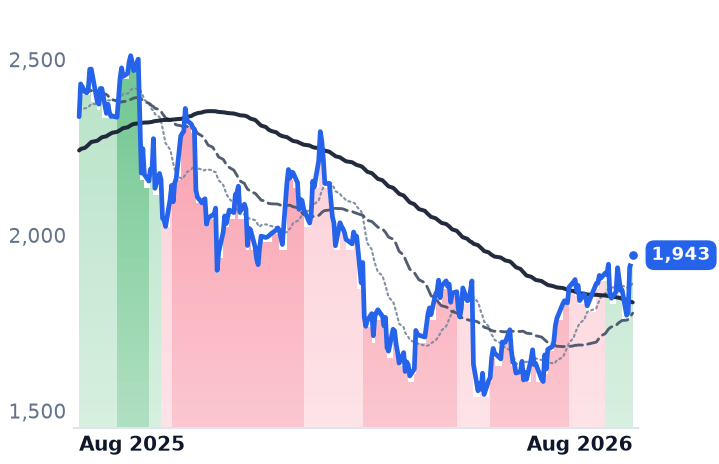
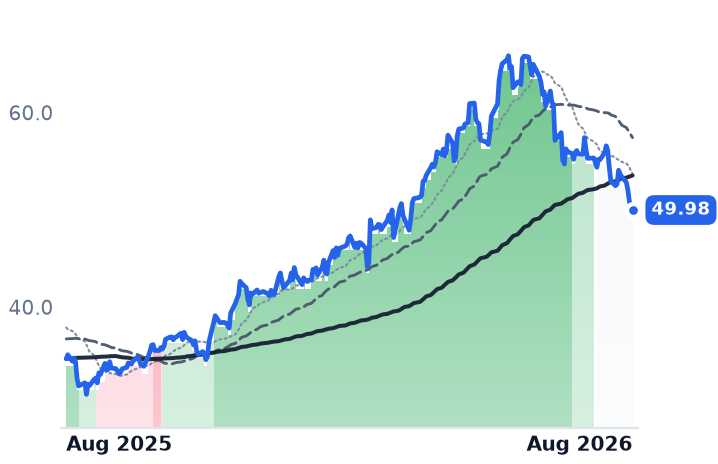
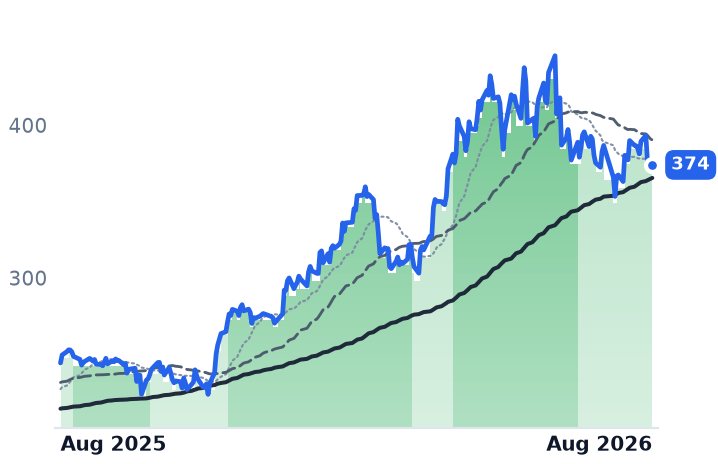
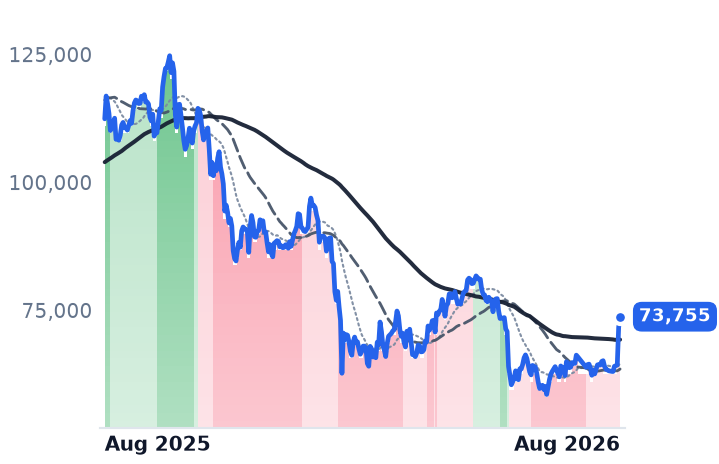
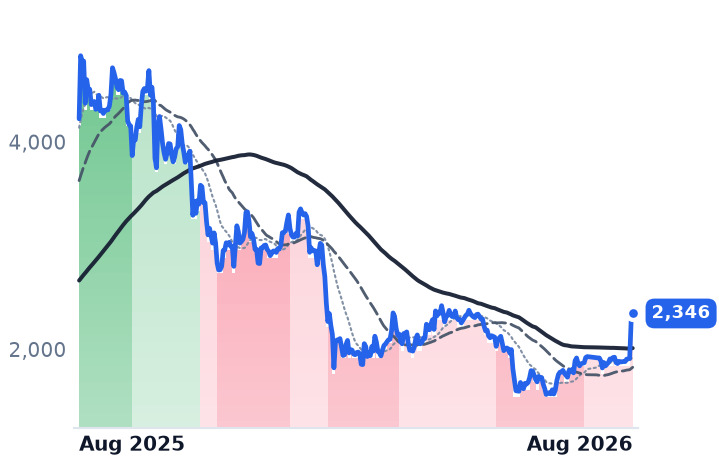
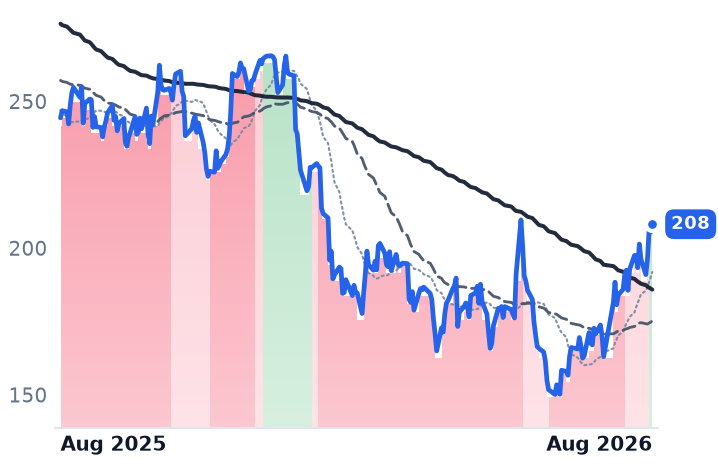
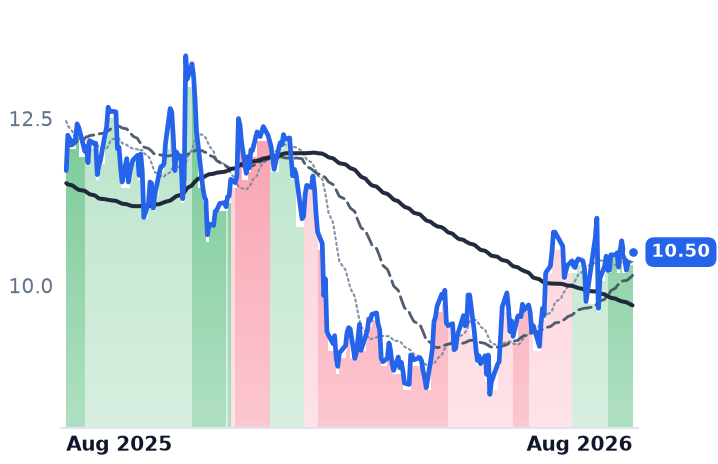
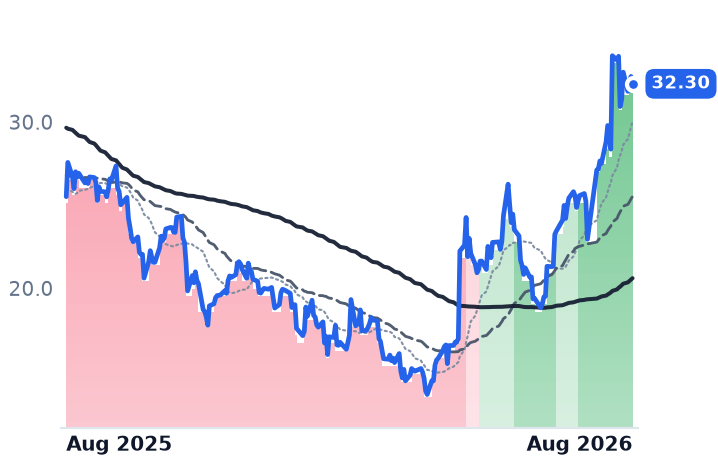
12-month price & trend
| Ticker | Mkt cap | P/E | P/E fwd | P/S | P/S fwd | P/GP | P/GP fwd | EV/EBITDA | FCF yld |
|---|---|---|---|---|---|---|---|---|---|
DELL | $293.6B | 34.5x | 23.5x | 2.2x | 1.7x | 11.5x | 8.9x | 21.2x | 3.2% |
NTAP | $37.7B | 29.9x | 21.3x | 5.4x | 5.0x | 7.7x | 7.1x | 19.6x | 5.0% |
CSCO | $437.7B | 33.0x | 21.6x | 6.9x | 6.0x | 10.7x | 9.3x | 23.0x | 3.1% |
| Ticker | Mkt cap | P/E | P/E fwd | P/S | P/S fwd | P/GP | P/GP fwd | EV/EBITDA | FCF yld |
|---|---|---|---|---|---|---|---|---|---|
HPE | $70.8B | 49.0x | 15.6x | 1.8x | 1.6x | 5.5x | 4.8x | 21.6x | 5.6% |
SMCI | $24.1B | 10.2x | 8.6x | 0.6x | 0.4x | 5.7x | 3.3x | 7.7x | -28.9% |
MU | $1.0T | 19.9x | 12.2x | 11.2x | 7.8x | 15.4x | 10.7x | 14.5x | 2.6% |
| Ticker | Mkt cap | P/E | P/E fwd | P/S | P/S fwd | P/GP | P/GP fwd | EV/EBITDA | FCF yld |
|---|---|---|---|---|---|---|---|---|---|
CLS | $34.1B | 30.5x | 25.9x | 2.2x | 1.6x | 18.8x | 14.1x | 22.8x | 1.5% |
ANET | $256.4B | 63.4x | 50.6x | 24.3x | 20.6x | 38.6x | 32.7x | 49.8x | 2.0% |
MTSI | $20.3B | 83.3x | 48.4x | 17.5x | 15.4x | 30.9x | 27.2x | 59.2x | 0.6% |
| Ticker | Mkt cap | P/E | P/E fwd | P/S | P/S fwd | P/GP | P/GP fwd | EV/EBITDA | FCF yld |
|---|---|---|---|---|---|---|---|---|---|
NXPI | $56.9B | 19.1x | 15.0x | 4.3x | 4.0x | 7.7x | 7.1x | 13.2x | 5.2% |
GLW | $129.0B | 67.8x | 45.7x | 7.6x | 6.7x | 20.9x | 18.5x | 34.8x | 1.9% |
VST | $45.9B | 22.7x | 15.4x | 2.9x | 2.0x | 22.2x | 15.5x | 10.1x | 3.0% |
| Ticker | Mkt cap | P/E | P/E fwd | P/S | P/S fwd | P/GP | P/GP fwd | EV/EBITDA | FCF yld |
|---|---|---|---|---|---|---|---|---|---|
TEAM | $45.1B | n/m | 31.3x | 6.9x | 6.0x | 8.1x | 7.1x | 298.8x | 2.9% |
TWLO | $34.2B | 30.0x | 38.0x | 6.1x | 5.7x | 12.6x | 11.8x | 93.9x | 3.2% |
DOCN | $13.5B | 45.9x | 79.6x | 13.4x | 11.5x | 23.4x | 20.1x | 38.1x | 0.1% |
| Ticker | Mkt cap | P/E | P/E fwd | P/S | P/S fwd | P/GP | P/GP fwd | EV/EBITDA | FCF yld |
|---|---|---|---|---|---|---|---|---|---|
FROG | $11.2B | n/m | 94.0x | 18.6x | 17.1x | 23.9x | 22.0x | n/m | 1.5% |
AKAM | $16.1B | 38.9x | 16.4x | 3.7x | 3.6x | 6.6x | 6.3x | 18.6x | 3.9% |
VEEV | $40.3B | 43.0x | 27.4x | 12.1x | 11.0x | 16.2x | 14.7x | 29.6x | 4.1% |
| Ticker | Mkt cap | P/E | P/E fwd | P/S | P/S fwd | P/GP | P/GP fwd | EV/EBITDA | FCF yld |
|---|---|---|---|---|---|---|---|---|---|
FIG | $13.2B | n/m | 94.6x | 10.3x | 9.0x | 13.0x | 11.4x | n/m | 1.7% |
MCHP | $41.3B | 105.4x | 20.9x | 8.1x | 6.5x | 13.4x | 10.7x | 27.6x | 2.7% |
MELI | $97.5B | 52.3x | 50.1x | 2.8x | 2.4x | 6.5x | 5.5x | 34.5x | 12.8% |
| Ticker | Mkt cap | P/E | P/E fwd | P/S | P/S fwd | P/GP | P/GP fwd | EV/EBITDA | FCF yld |
|---|---|---|---|---|---|---|---|---|---|
ITRN | $1.0B | 15.7x | 14.2x | 2.6x | 2.4x | 5.2x | 4.8x | 8.7x | 8.2% |
ADI | $181.7B | 44.0x | 29.1x | 13.1x | 12.1x | 19.9x | 18.3x | 28.9x | 2.7% |
BTC-USD | — | — | — | — | — | — | — | — | — |
| Ticker | Mkt cap | P/E | P/E fwd | P/S | P/S fwd | P/GP | P/GP fwd | EV/EBITDA | FCF yld |
|---|---|---|---|---|---|---|---|---|---|
ETH-USD | — | — | — | — | — | — | — | — | — |
CRM | $171.3B | 24.1x | 14.8x | 4.0x | 3.7x | 5.2x | 4.8x | 14.6x | 8.6% |
LSPD | $1.5B | n/m | 17.0x | 1.2x | 1.2x | 2.7x | 2.7x | 74.8x | 2.6% |
| Ticker | Mkt cap | P/E | P/E fwd | P/S | P/S fwd | P/GP | P/GP fwd | EV/EBITDA | FCF yld |
|---|---|---|---|---|---|---|---|---|---|
FIVN | $2.5B | 43.1x | 10.1x | 2.1x | 2.0x | 3.8x | 3.6x | 15.2x | 7.9% |
WDAY | $52.4B | 62.1x | 18.6x | 5.3x | 4.9x | 7.0x | 6.5x | 33.2x | 5.7% |
MNDY | $3.8B | 38.0x | 16.6x | 2.8x | 2.6x | 3.2x | 2.9x | 34.1x | 7.8% |
| Ticker | Mkt cap | P/E | P/E fwd | P/S | P/S fwd | P/GP | P/GP fwd | EV/EBITDA | FCF yld |
|---|---|---|---|---|---|---|---|---|---|
ASAN | $2.3B | n/m | 25.7x | 2.8x | 2.6x | 3.2x | 3.0x | n/m | 4.9% |
Consensus projections
| Ticker | FY2026E | FY2027E | FY2028E | |
|---|---|---|---|---|
DELL | Revenue | +16.2% | +54.7% | +15.1% |
| EPS | +27.3% | +88.5% | +22.3% | |
NTAP | Revenue | +4.3% | +10.0% | +5.7% |
| EPS | +10.4% | +12.9% | +11.1% | |
CSCO | Revenue | +11.1% | +15.9% | +7.3% |
| EPS | +12.9% | +20.0% | +9.3% | |
HPE | Revenue | +30.3% | +11.5% | +5.6% |
| EPS | +80.5% | +18.1% | +9.6% | |
SMCI | Revenue | +77.7% | +69.8% | +17.7% |
| EPS | +33.5% | +54.8% | +23.3% | |
MU | Revenue | +248.0% | +92.8% | +11.4% |
| EPS | +804.9% | +111.2% | +7.9% | |
CLS | Revenue | +69.7% | +71.6% | +32.3% |
| EPS | +91.2% | +73.4% | +34.8% | |
ANET | Revenue | +40.0% | +27.7% | +21.9% |
| EPS | +39.6% | +25.5% | +23.9% | |
MTSI | Revenue | +37.0% | +35.7% | +16.5% |
| EPS | +58.9% | +53.9% | +17.5% | |
NXPI | Revenue | +16.7% | +11.5% | +8.3% |
| EPS | +28.0% | +20.5% | +15.3% | |
GLW | Revenue | +17.4% | +18.7% | +21.5% |
| EPS | +29.9% | +31.8% | +37.3% | |
VST | Revenue | +18.9% | +9.1% | +4.6% |
| EPS | +85.4% | +19.1% | +17.0% | |
TEAM | Revenue | +24.7% | +15.4% | +14.7% |
| EPS | +55.5% | −0.1% | +21.6% | |
TWLO | Revenue | +19.4% | +11.7% | +10.6% |
| EPS | +23.5% | +14.5% | +14.2% | |
DOCN | Revenue | +31.2% | +53.5% | +43.7% |
| EPS | −29.0% | +23.2% | +60.4% | |
FROG | Revenue | +24.2% | +17.7% | +18.3% |
| EPS | +23.8% | +16.8% | +26.0% | |
AKAM | Revenue | +7.2% | +12.8% | +10.8% |
| EPS | −4.7% | +6.1% | +13.9% | |
VEEV | Revenue | +16.3% | +15.1% | +12.0% |
| EPS | +23.1% | +14.1% | +10.6% | |
FIG | Revenue | +40.5% | +23.8% | +24.1% |
| EPS | −24.4% | +26.7% | +34.5% | |
MCHP | Revenue | +6.2% | +37.1% | +16.4% |
| EPS | +20.7% | +132.5% | +25.7% | |
MELI | Revenue | +44.7% | +28.4% | +24.9% |
| EPS | −5.1% | +43.7% | +42.0% | |
ITRN | Revenue | +16.5% | +5.4% | +7.5% |
| EPS | +23.8% | +8.6% | +9.4% | |
ADI | Revenue | +37.5% | +21.4% | +9.2% |
| EPS | +65.1% | +28.3% | +14.6% | |
CRM | Revenue | +9.3% | +11.1% | +9.4% |
| EPS | +17.4% | +20.2% | +10.4% | |
LSPD | Revenue | +13.5% | +3.5% | +12.6% |
| EPS | +7.8% | +28.3% | +48.7% | |
FIVN | Revenue | +9.5% | +9.9% | +10.6% |
| EPS | +10.5% | +18.0% | +16.6% | |
WDAY | Revenue | +13.4% | +11.8% | +11.0% |
| EPS | +26.5% | +18.6% | +17.3% | |
MNDY | Revenue | +19.8% | +15.2% | +14.9% |
| EPS | +27.8% | +22.3% | +19.1% | |
ASAN | Revenue | +9.2% | +8.9% | +7.9% |
| EPS | −272.8% | +45.4% | +26.1% |
Forward fiscal years only. Blank means no analyst coverage for that year.
The world's three largest memory makers spent this year diverting capacity toward high-bandwidth memory for AI accelerators, where a gigabyte of output earns three to four times what ordinary server memory does. The result reached everyone who builds hardware around it: DRAM contract prices rose 90-95% quarter on quarter in January, and server DRAM rose a further 58-63% in the second quarter, according to TrendForce. Dell raised list prices across its product line roughly 17% at the end of March to cover it.
All three of the big enterprise hardware names have now told investors the same thing: gross margin is going down. Only one of them was marked down for saying it.
Dell: the margin that was never the argument
Dell Technologies sells servers, storage and networking to corporations and governments through its Infrastructure Solutions Group, and PCs through its Client Solutions Group. In the quarter to 1 May, revenue grew 87.5% to $43.84bn — the third straight acceleration, from 10.8% two quarters earlier. Gross margin fell to 17.75%, so gross profit rose only 57.6%. Operating income rose 197%, to $3.66bn.
That gap is the whole Dell case. The infrastructure segment produced $29bn of revenue, up 181%, with operating margin up 80 basis points to 10.5%, while the PC business improved its margin faster still, by 280 basis points to 8.0%. The company booked $24.4bn of AI orders and recognised $16.1bn of AI server revenue, raising its expectation for full-year AI server revenue to $60bn, and exited the quarter with a record $51.3bn AI backlog. Dell is the largest AI server builder by volume, and scale plus supplier relationships give it allocation priority on Nvidia GPUs — a position rivals have to buy their way into.
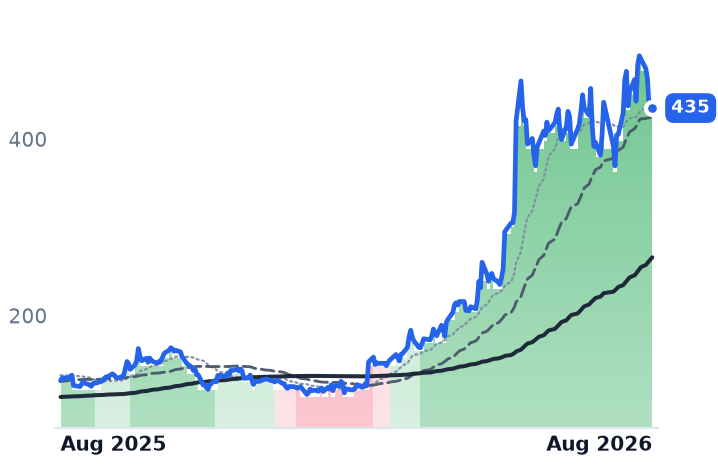
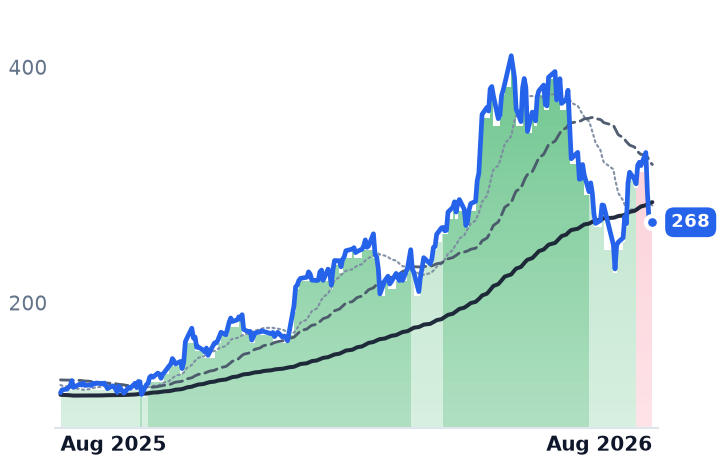
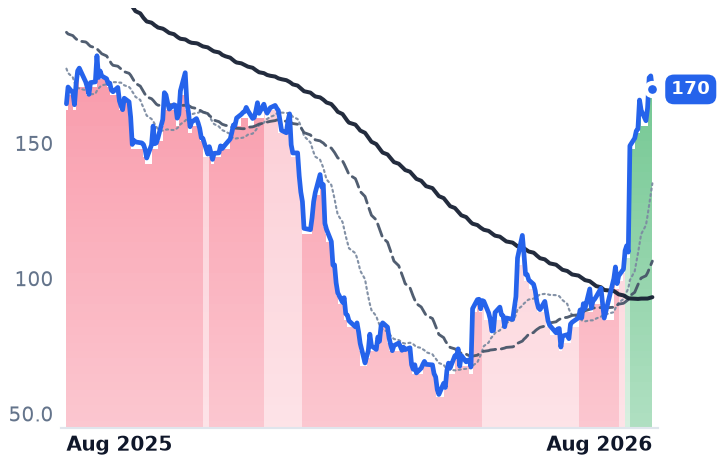
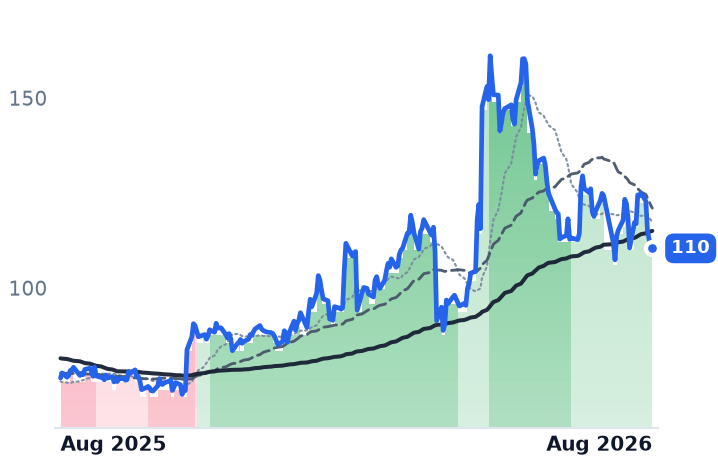
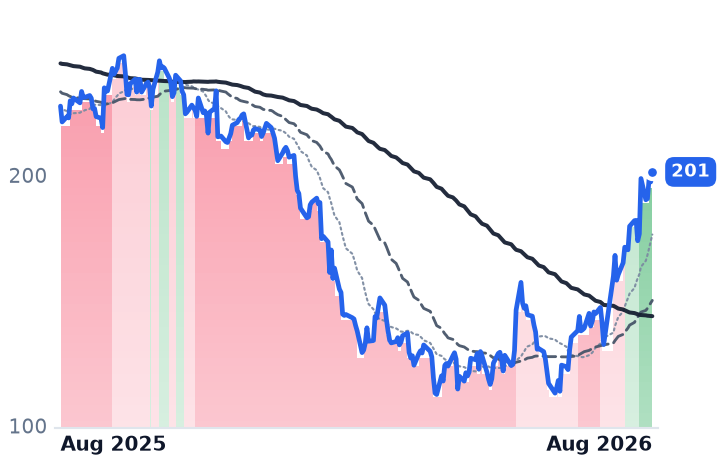
What has run ahead is the price. Six months ago the shares changed hands at roughly 3.8 times trailing gross profit; in May, about 7.4 times; today, 11.49 times. Trailing gross profit grew 19% over that stretch. Dell now trades at 34.5x trailing earnings and 23.5x forward, against the roughly 19x Barron's cited in July and the 14-17x range that made it, a few months ago, the cheapest large-cap way to own AI hardware. The company repurchased 11m shares at an average $147 in the May quarter; the stock is $435 now.
NetApp: treated like Dell, priced like a re-rating
NetApp sells flash storage arrays and the ONTAP software that runs them, plus cloud storage services resold through Microsoft Azure and Amazon Web Services. Fiscal 2026 revenue was $6.93bn, up 5.4%, but the fourth quarter accelerated to 12.5% and operating margin expanded 715 basis points to 27.3%. All-flash array revenue hit a record $1.2bn, up 18%, and public cloud revenue reached $182m. The company logged more than 1,100 AI and data-preparation wins in the year but discloses no AI revenue line in dollars.
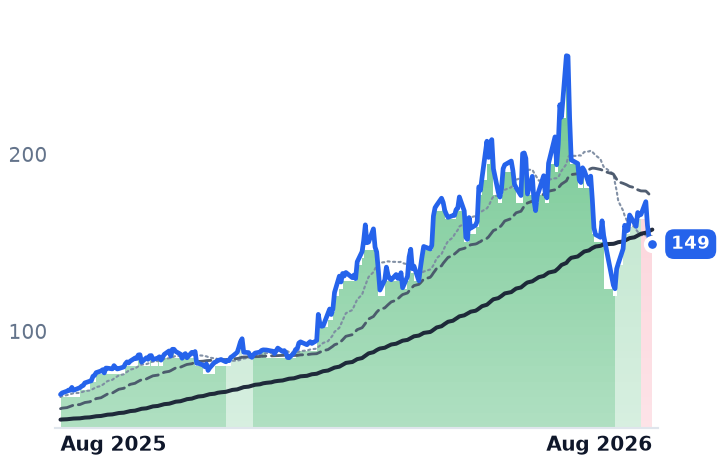
It also guided fiscal 2027 gross margin down to 68.5-69.5% from 71.3%, citing memory and component costs. That is the same disclosure Cisco made. NetApp's price per dollar of trailing gross profit went from 4.55x on 3 May to 7.70x today — a 69% expansion against annual gross profit growth of 6.2%. The forward multiple of 7.08x sits barely below the trailing one, which is the market saying it expects almost no gross-profit growth at all.
Cisco: fastest AI growth, only de-rating
Cisco Systems makes the switches, routers and optics that wire data centers together. Revenue accelerated four quarters running, to $17.25bn in the July quarter, up 17.6%, with operating income up 38.1%. Its AI infrastructure orders reached $9.3bn for the year, roughly 4.5 times the prior year, with fiscal 2027 AI revenue guided to about $7.5bn against the "at least $6bn" previously signalled. On the fastest AI growth of the three, the shares fell 7.6% on 13 August, because those hardware-heavy orders dragged gross-margin guidance to 65-66%.
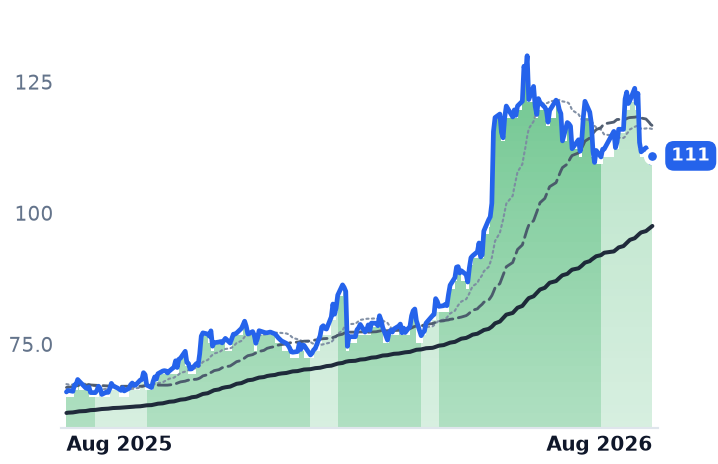
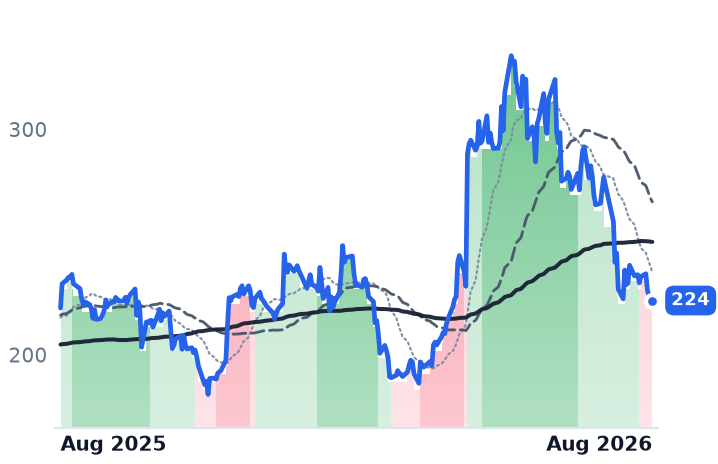
That is the asymmetry. Cisco's valuation is built on in-house Silicon One switching chips and Acacia coherent optics — more than 40,000 800-gigabit pluggables shipped, an integration Arista and the Juniper business now inside Hewlett Packard Enterprise cannot match — and on the software and services attached to them. Diluting that mix costs it multiple. Dell's gross margin was 17.75% to begin with; there is no premium there to lose. Cisco's price per dollar of trailing gross profit compressed from about 11.9x in May to 10.71x, while its trailing gross profit rose from $39.1bn to $40.9bn.
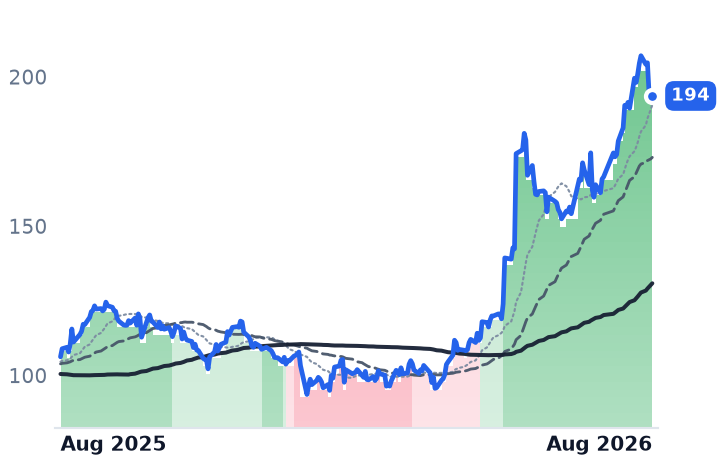
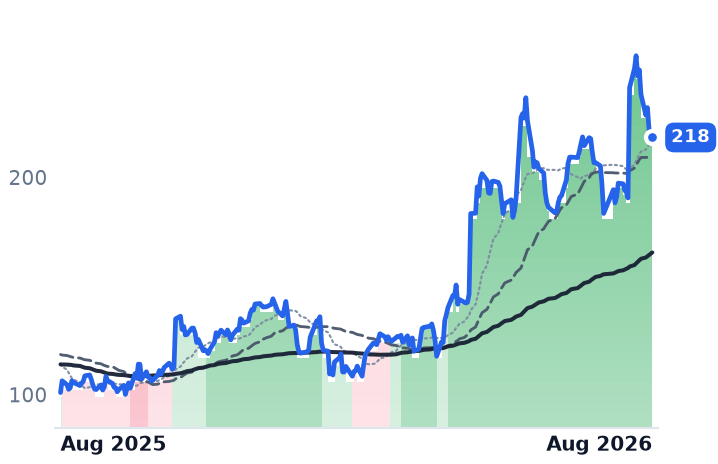
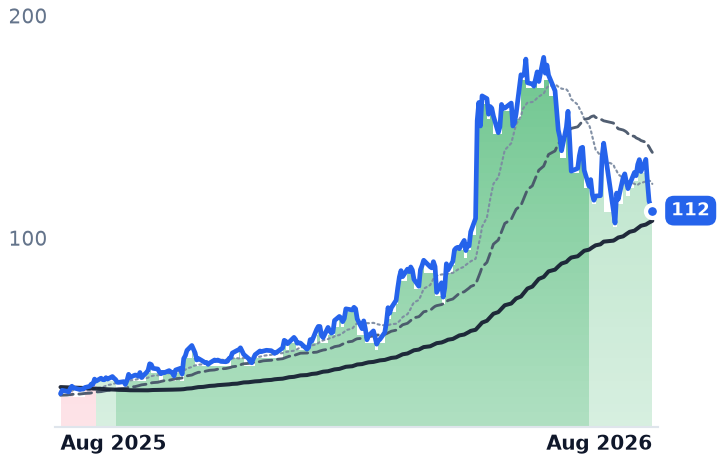
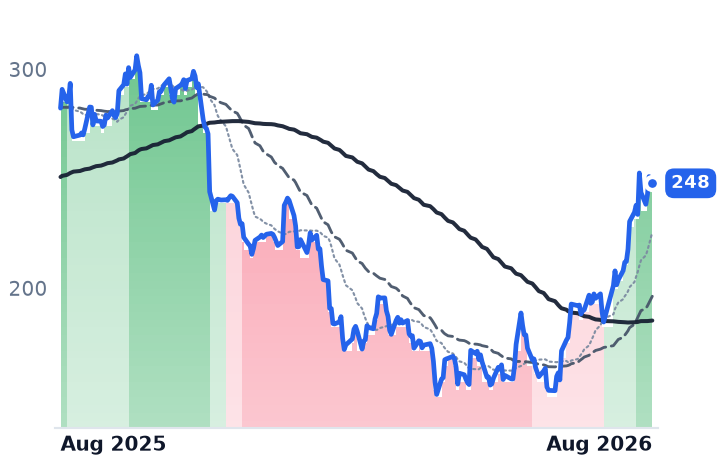
The trend readings follow the same split. Dell's shares have been in a confirmed uptrend since 31 March, with the 50-day average above the 200-day, having been in the opposite condition as late as 11 March; NetApp crossed over on 21 May; Cisco's uptrend was downgraded on 20 July and has not recovered. Neither of the winners ground higher: Dell gapped 21.9% on 27 February and 32.8% on 29 May, NetApp 12.4% and 22.4% in the same May week. Almost all of it arrived on earnings.
One caveat cuts against the cheap-hardware-rotation reading. Long rates are not helping: a 10-year Treasury auction on 12 August cleared at 4.683%, the highest since 2007. Multiples expanded anyway at two of these three, which points at AI content rather than a defensive rotation — except that the company with the most AI content is the one that got cheaper.
The setup
Where it stands — The same memory-driven gross-margin guide-down re-rated Dell and NetApp and de-rated Cisco, on Cisco's faster AI order growth. Would confirm — Dell holds infrastructure operating margin at or above 10.5% on 1 September despite a further gross-margin fall. Would invalidate — Dell's operating margin contracts alongside gross margin, making the dilution a profit problem rather than a mix effect. Watch next — Dell reports fiscal Q2 on 1 September; NetApp reports fiscal Q1 after the close on 2 September. Valuation — Dell 34.5x trailing and 23.5x forward earnings, against roughly 19x cited in July and 14-17x in May.