

Atlassian Guided Fiscal 2027 Growth to Halve, Then Its Multiple Rose 58%
Hypothesis Opus 5 · Research Opus 5 · Writing Opus 5 · Prompt v1.4
Atlassian's June quarter looked like a vindication of software sold by the user seat: revenue up 27.6% and the first meaningfully profitable quarter in the company's public life. The shares rose 35% in a single session.
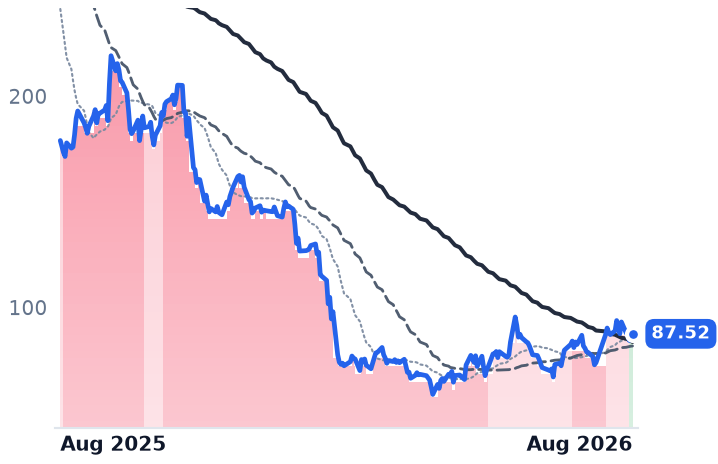
What management said alongside it is that fiscal 2027 revenue growth will be roughly 13%, about half of fiscal 2026's, because the quarter was flattered by term-license revenue pulled forward when Atlassian set a 2029 end date for its self-managed Data Center product. Its price-to-gross-profit went from 4.83x to 7.64x in seventeen sessions anyway.
Eight other enterprise-software names rose with it. Strip each one's two best sessions and the group's 21% month becomes -2.9%. Real acceleration exists at JFrog, Twilio, Samsara and Salesforce; Veeva, Nutanix and Dynatrace re-rated without publishing a new number. How a company bills — per seat or per unit of usage — sorted none of it.
| Ticker | Company | Segment | Trend · 13mo | 30D | 1Y |
|---|---|---|---|---|---|
| The subject · what this brief is about | |||||
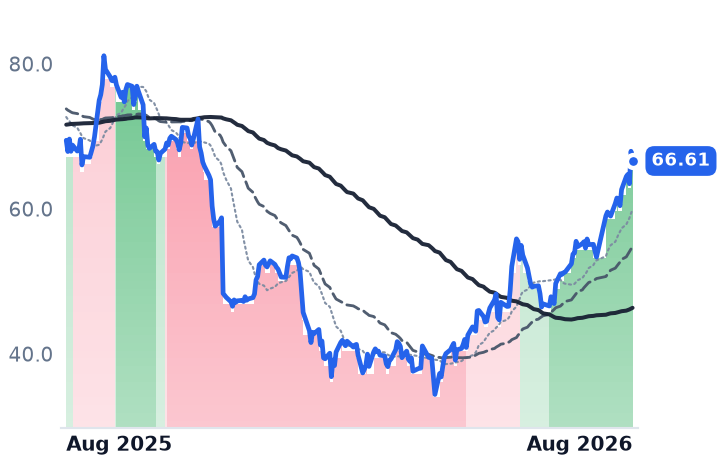
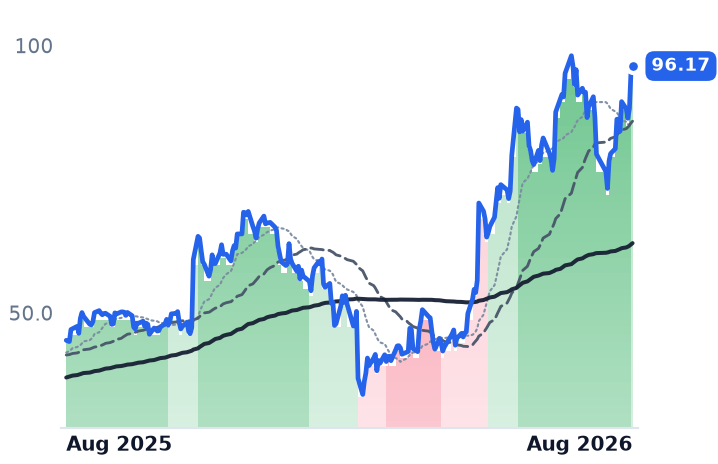
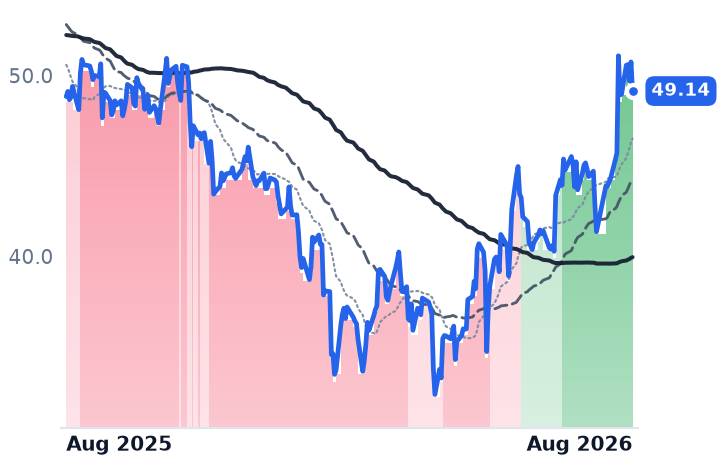
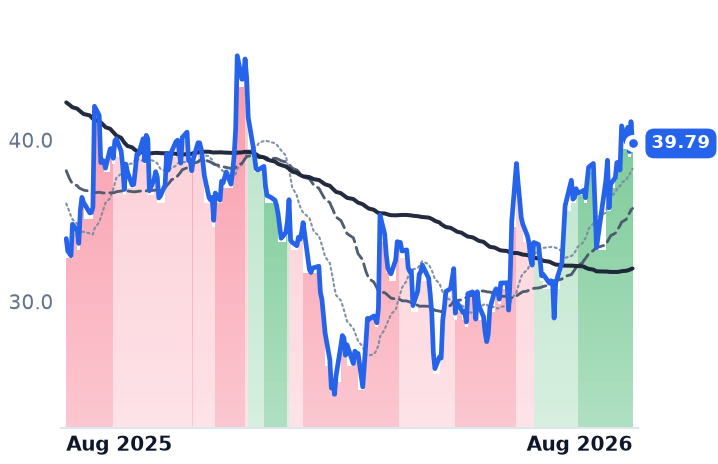
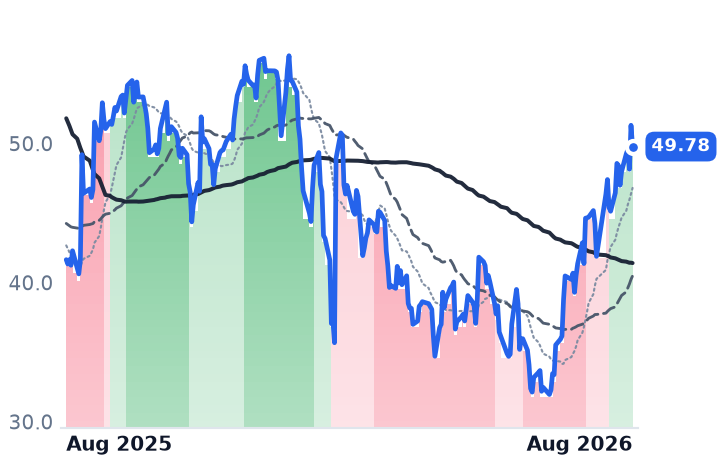
TEAM | Atlassian | Developer Tools & DevOps | 🔴 Cont. Bear | +68.2% | −4.1% |
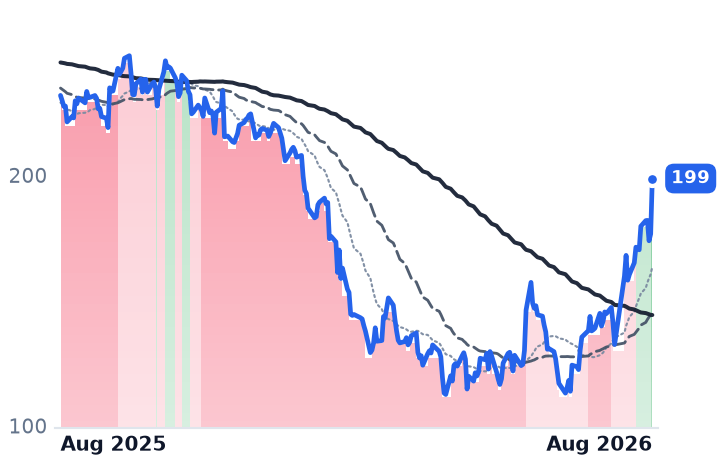
TWLO | Twilio | Communications & Messaging Platforms | 🟢 Cont. Bull | +16.1% | +126.7% |
CRM | Salesforce | Customer Experience & CRM | 🔴 Cont. Bear | +12.9% | −19.1% |
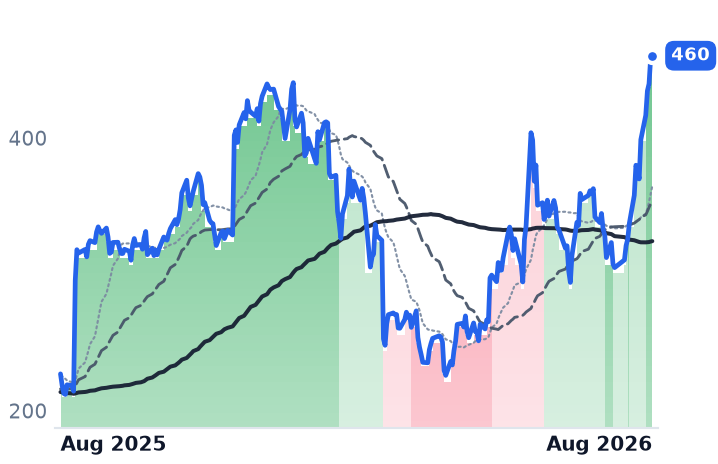
VEEV | Veeva Systems | Life Sciences Software & Data | 🌱 Emerging Bull | +23.5% | −13.6% |
NTNX | Nutanix | Cloud Infrastructure & Platforms | 🌱 Emerging Bull | +20.9% | −4.1% |
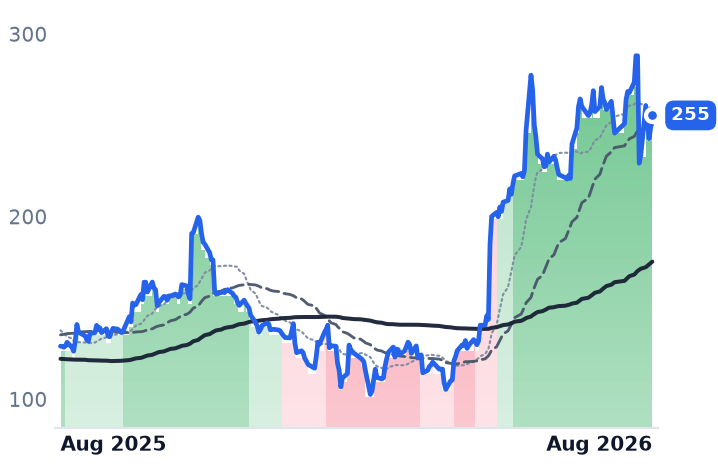
FROG | JFrog | Developer Tools & DevOps | 🟢 Cont. Bull | +6.3% | +114.3% |
DT | Dynatrace | Other | 🌱 Emerging Bull | +9.9% | +0.6% |
IOT | Samsara | IoT & Connected Operations | 🌱 Emerging Bull | +3.2% | +17.4% |
BILL | Bill.com | Fintech & Digital Finance | ⚠️ Emerging Bear | +10.2% | +19.5% |
| Compared against · context, not the story | |||||
WDAY | Workday | Enterprise Resource Planning | 🔴 Cont. Bear | +35.0% | −14.3% |
DDOG | Datadog | Data & Analytics Platforms | 🌱 Emerging Bull | −2.9% | +97.9% |
MDB | MongoDB | Data Management & Analytics | 🟢 Cont. Bull | +42.4% | +102.7% |
SNOW | Snowflake | Data & Analytics Platforms | 🟢 Cont. Bull | +19.9% | +65.9% |
NOW | ServiceNow | Specialized Enterprise Solutions | 🔴 Cont. Bear | +18.4% | −30.5% |
ZS | Zscaler | AI & Data Intelligence | 🔴 Cont. Bear | +22.5% | −33.7% |
NET | Cloudflare | Network & Application Delivery | 🟢 Cont. Bull | +15.9% | +56.0% |
MNDY | monday.com | Other | 🔴 Cont. Bear | +14.0% | −51.1% |
HUBS | HubSpot | Customer Experience & CRM | 🔴 Cont. Bear | −3.1% | −50.0% |
SPY | State Street SPDR S&P 500 ETF Trust | Asset Management | 🟢 Cont. Bull | +4.6% | +21.7% |
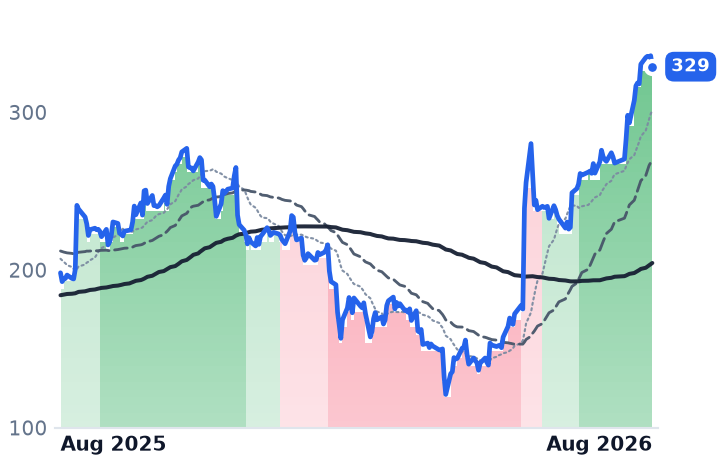
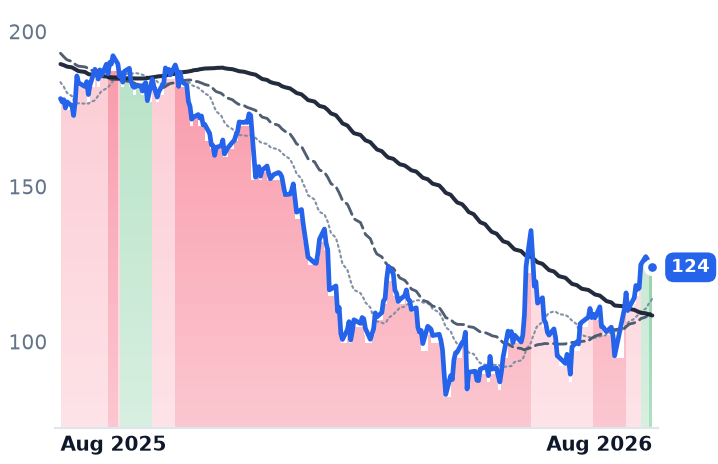
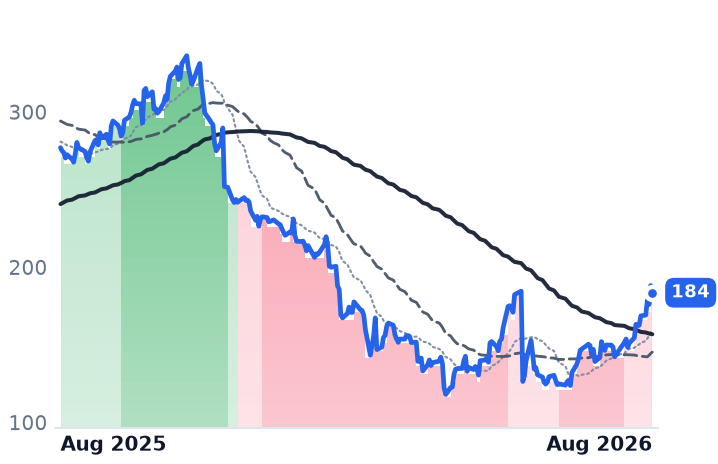
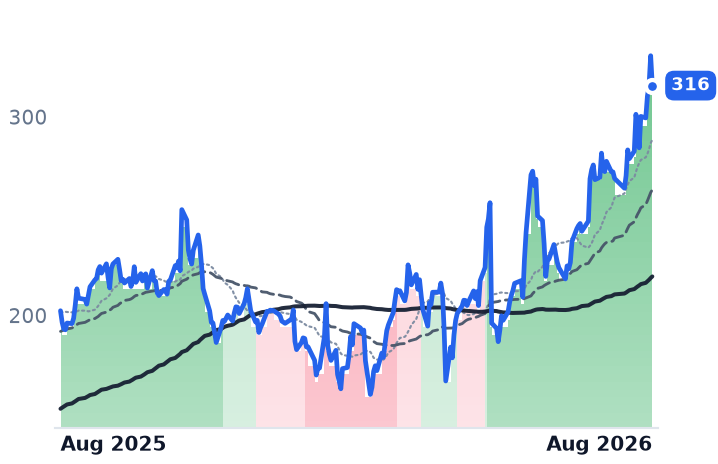
12-month price & trend
| Ticker | Mkt cap | P/E | P/E fwd | P/S | P/S fwd | P/GP | P/GP fwd | EV/EBITDA | FCF yld |
|---|---|---|---|---|---|---|---|---|---|
TEAM | $42.6B | n/m | 26.7x | 6.5x | 5.8x | 7.6x | 6.8x | 282.1x | 3.1% |
TWLO | $36.2B | 31.7x | 41.7x | 6.5x | 6.2x | 13.4x | 12.8x | 99.3x | 3.1% |
CRM | $160.7B | 22.6x | 13.9x | 3.8x | 3.5x | 4.8x | 4.5x | 13.8x | 9.1% |
| Ticker | Mkt cap | P/E | P/E fwd | P/S | P/S fwd | P/GP | P/GP fwd | EV/EBITDA | FCF yld |
|---|---|---|---|---|---|---|---|---|---|
VEEV | $39.6B | 42.3x | 26.9x | 11.9x | 10.9x | 15.9x | 14.5x | 29.1x | 4.2% |
NTNX | $18.0B | 65.3x | 30.4x | 6.5x | 5.6x | 7.5x | 6.5x | 53.3x | 4.3% |
FROG | $11.6B | n/m | 100.8x | 19.4x | 18.4x | 24.9x | 23.6x | n/m | 1.5% |
| Ticker | Mkt cap | P/E | P/E fwd | P/S | P/S fwd | P/GP | P/GP fwd | EV/EBITDA | FCF yld |
|---|---|---|---|---|---|---|---|---|---|
DT | $14.3B | 96.6x | 24.8x | 6.8x | 6.2x | 8.4x | 7.6x | 43.9x | 4.0% |
IOT | $23.0B | 389.3x | 55.9x | 13.3x | 11.4x | 17.4x | 15.0x | 234.7x | 1.0% |
BILL | $5.0B | n/m | 14.8x | 3.1x | 2.7x | 3.8x | 3.3x | 42.8x | 7.7% |
| Ticker | Mkt cap | P/E | P/E fwd | P/S | P/S fwd | P/GP | P/GP fwd | EV/EBITDA | FCF yld |
|---|---|---|---|---|---|---|---|---|---|
WDAY | $47.1B | 55.8x | 16.7x | 4.8x | 4.4x | 6.3x | 5.8x | 30.0x | 6.3% |
DDOG | $90.9B | 513.8x | 104.6x | 22.9x | 20.8x | 28.8x | 26.1x | 348.6x | 1.3% |
MDB | $37.6B | n/m | 76.3x | 14.4x | 12.7x | 20.1x | 17.6x | — | 1.6% |
| Ticker | Mkt cap | P/E | P/E fwd | P/S | P/S fwd | P/GP | P/GP fwd | EV/EBITDA | FCF yld |
|---|---|---|---|---|---|---|---|---|---|
SNOW | $114.0B | n/m | 170.2x | 22.7x | 18.7x | 33.7x | 27.8x | n/m | 1.0% |
NOW | $128.2B | 77.0x | 30.5x | 8.7x | 7.9x | 11.6x | 10.6x | 38.4x | 3.6% |
ZS | $29.7B | n/m | 40.1x | 9.4x | 7.6x | 12.2x | 9.9x | 251.1x | 3.2% |
| Ticker | Mkt cap | P/E | P/E fwd | P/S | P/S fwd | P/GP | P/GP fwd | EV/EBITDA | FCF yld |
|---|---|---|---|---|---|---|---|---|---|
NET | $112.0B | n/m | 263.6x | 44.6x | 39.9x | 61.4x | 54.9x | — | 0.3% |
MNDY | $4.7B | 39.8x | 20.3x | 3.6x | 3.2x | 4.1x | 3.6x | 51.1x | 6.4% |
HUBS | $11.5B | 79.1x | 17.0x | 3.3x | 3.1x | 4.0x | 3.7x | 37.9x | 6.7% |
| Ticker | Mkt cap | P/E | P/E fwd | P/S | P/S fwd | P/GP | P/GP fwd | EV/EBITDA | FCF yld |
|---|---|---|---|---|---|---|---|---|---|
SPY | $773.0B | — | — | — | — | — | — | — | — |
Consensus projections
| Ticker | FY2026E | FY2027E | FY2028E | |
|---|---|---|---|---|
TEAM | Revenue | +24.7% | +13.4% | +15.9% |
| EPS | +55.5% | +10.5% | +18.0% | |
TWLO | Revenue | +16.0% | +10.1% | +10.4% |
| EPS | +19.1% | +16.3% | +15.7% | |
CRM | Revenue | +9.3% | +11.1% | +9.4% |
| EPS | +17.4% | +20.2% | +10.4% | |
VEEV | Revenue | +16.3% | +15.1% | +12.0% |
| EPS | +22.7% | +14.1% | +10.7% | |
NTNX | Revenue | +12.1% | +12.8% | +12.5% |
| EPS | +10.9% | +13.6% | +16.3% | |
FROG | Revenue | +20.6% | +17.5% | +19.4% |
| EPS | +20.4% | +17.6% | +27.4% | |
DT | Revenue | +18.9% | +15.5% | +14.8% |
| EPS | +22.8% | +17.7% | +15.3% | |
IOT | Revenue | +28.9% | +25.9% | +19.7% |
| EPS | +129.2% | +40.4% | +27.9% | |
BILL | Revenue | +13.2% | +12.2% | +12.0% |
| EPS | +26.0% | +27.2% | +20.5% | |
WDAY | Revenue | +13.4% | +11.8% | +11.0% |
| EPS | +26.5% | +18.5% | +17.3% | |
DDOG | Revenue | +28.9% | +21.5% | +23.5% |
| EPS | +20.9% | +17.3% | +23.1% | |
MDB | Revenue | +23.1% | +21.6% | +17.9% |
| EPS | +59.1% | +27.1% | +19.6% | |
SNOW | Revenue | +29.4% | +30.9% | +25.7% |
| EPS | +72.3% | +59.4% | +41.1% | |
NOW | Revenue | +22.4% | +18.7% | +18.6% |
| EPS | +17.1% | +23.2% | +21.4% | |
ZS | Revenue | +25.2% | +16.9% | +16.7% |
| EPS | +29.0% | +11.2% | +17.6% | |
NET | Revenue | +31.0% | +27.9% | +27.4% |
| EPS | +31.0% | +32.8% | +38.3% | |
MNDY | Revenue | +19.8% | +16.1% | +16.1% |
| EPS | +7.0% | +21.4% | +10.9% | |
HUBS | Revenue | +18.5% | +14.9% | +14.0% |
| EPS | +37.2% | +22.5% | +18.5% |
Forward fiscal years only. Blank means no analyst coverage for that year.
A record quarter with an expiry date
Atlassian, the Australian-founded maker of the Jira issue tracker and Confluence wikis used by more than 350,000 corporate customers, reported June-quarter revenue of $1.77bn, up 27.6% from a year earlier. Adjusted earnings of $1.87 a share beat the $1.50 analysts expected. Operating income came in at $211.7m against a loss of $28.5m a year earlier. Subscription annual recurring revenue reached $6.6bn, up 23%, and contracted revenue not yet recognized rose 44% to $4.8bn.
The same release guided fiscal 2027 revenue growth to roughly 13% — half of fiscal 2026's 26%. The reason is largely accounting. In September 2025 Atlassian set March 2029 as the end of life for Data Center, its self-managed server product, a decision that pulled term-license revenue forward into the year just closed. Data Center revenue is guided to decline about 17% next year. Non-GAAP operating margin is guided down to 25% from 36% in the June quarter, with roughly four points of last year's margin attributable to that revenue timing and a further three points of pressure from a shift toward cash compensation.
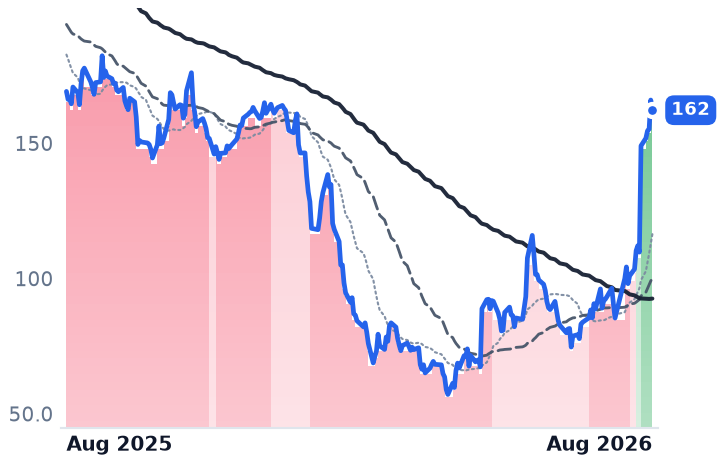
The shares rose 35% on 7 August, trading as high as $153.20 intraday. Price-to-gross-profit expanded from 4.83x on 29 July to 7.64x on 14 August, a 58% re-rating in seventeen sessions. Forward earnings multiple is 26.67x; there is no usable trailing figure on a GAAP loss.
One disclosure did travel the other way. Management said seat counts in core Jira and Confluence expanded, and that artificial-intelligence adoption is increasing rather than reducing demand for planning and collaboration seats — a year after Atlassian reported its first-ever enterprise seat decline. That is a direct answer to the argument that AI assistants shrink software headcount licenses.
Three days did most of the work
Atlassian sits in a group of nine software companies that all rose over the nineteen sessions to 14 August, averaging +21.1%. Strip each name's two best sessions and that average becomes -2.9%, with only four of nine still positive. Strip three shared days — 28 July, 7 August and 13 August — and it is -4.5%.
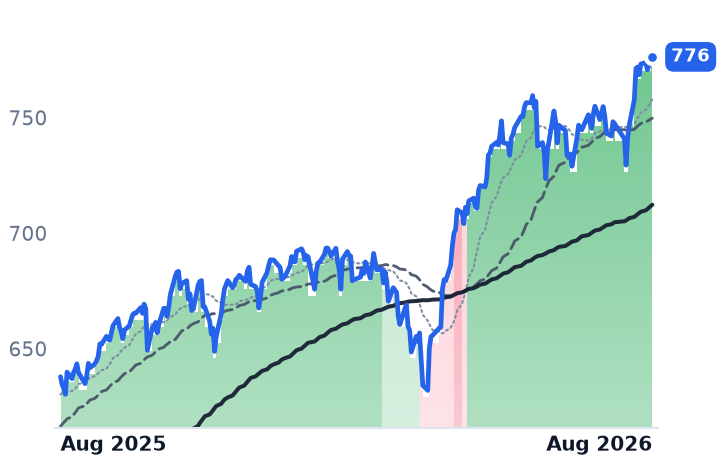
The 28 July session is the tell. The S&P 500 tracking fund fell 0.88% while eight of the nine rose between 6% and 17%. It was a rotation: the semiconductor index dropped 4.8% as ServiceNow gained 4.8% and monday.com 6.1%. Morningstar's US application-software index bounced 15% from 22 July, helped by a July consumer-price reading of +0.1% month-on-month that pared bets on a September rate increase. Workday rose 40.1% over the same thirty days, MongoDB 38.2%, against 2.9% for the index fund.
That breadth kills the neatest available theory. Workday bills per employee seat and led the complex; Datadog, the purest consumption-priced observability vendor in software, fell 3.4%. Inside the nine the split runs the wrong way as well: the accelerators include seat-billed Atlassian and Salesforce, while the decelerators are usage-priced Nutanix, whose growth slipped from 13.5% to 10.0% across three quarters, and Dynatrace, from 19.4% to 16.2%.
Four companies actually accelerated
JFrog, which runs Artifactory — the repository where software teams store and distribute code packages — delivered the cleanest print: revenue up 28.7% to $163.8m, net dollar retention of 121%, and non-GAAP operating margin of 19.9% against 15.2%. It is also the group's worst performer at +5.4%, and the most expensive, at 100.84x forward earnings and 23.64x forward gross profit. Its cloud line, now 53% of revenue and growing 53%, means it is consumption-billed in practice.
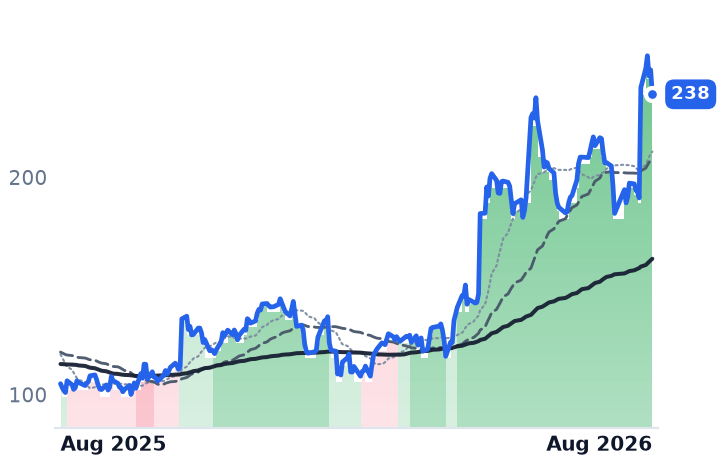
Twilio, whose programming interfaces let developers send messages and place calls from inside their own apps, raised fiscal 2026 organic growth guidance to 13-13.5% from 9.5-10.5%, with net expansion at 116% and free cash flow of $353m. Its third-quarter organic guide steps back to 11-12%, and at 12.78x forward gross profit on a 48% gross margin it is the least software-like economics in the group. Its uptrend is the longest here, unbroken since 17 April.
Samsara, which sells dashboard cameras and equipment sensors subscribed per connected vehicle or machine, grew 30.5% and turned an operating profit for the first time, at 1.5% of revenue. It has published nothing since 4 June.
Three re-rated on no new numbers
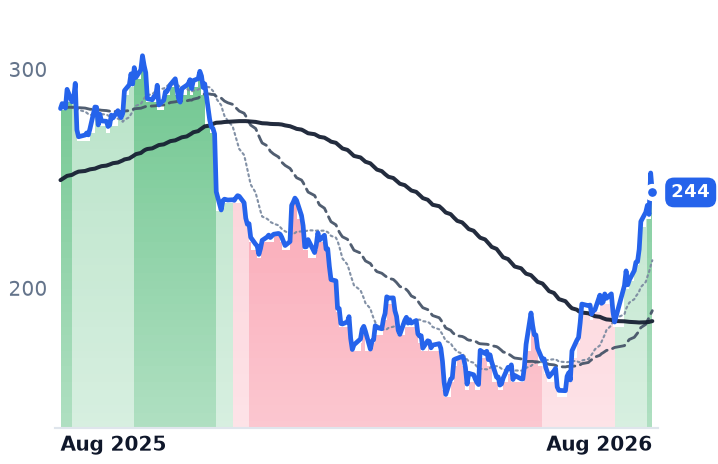
Veeva, which sells clinical-trial and sales software exclusively to drugmakers, has not reported since 3 June, yet its price-to-gross-profit rose from 13.13x to 15.92x in seventeen sessions. Growth has sat near 16% for five straight quarters and gross margin narrowed 240 basis points. At $243.75 it is level with the $244.14 average analyst target and reports on 26 August.
Nutanix, the per-node hybrid-cloud platform pitched as the alternative to VMware, gained 22% with no earnings since May and announced a 5% workforce cut on 4 August, carrying charges of $33m-$43m. Dynatrace, which monitors application performance across clouds, raised its revenue guidance by only 25 basis points and re-rated least, from 7.76x gross profit to 8.40x. Bill.com, which automates supplier payments for small businesses, grew 13.5% on a 1.1% operating margin and remains the cheapest at 14.78x forward earnings.
The one that never turned
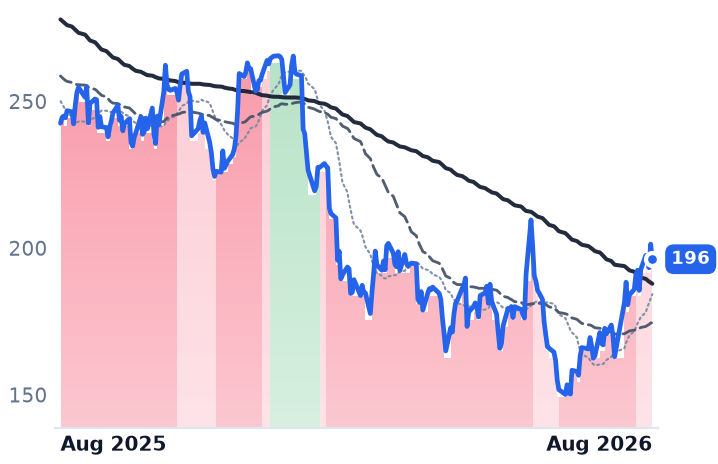
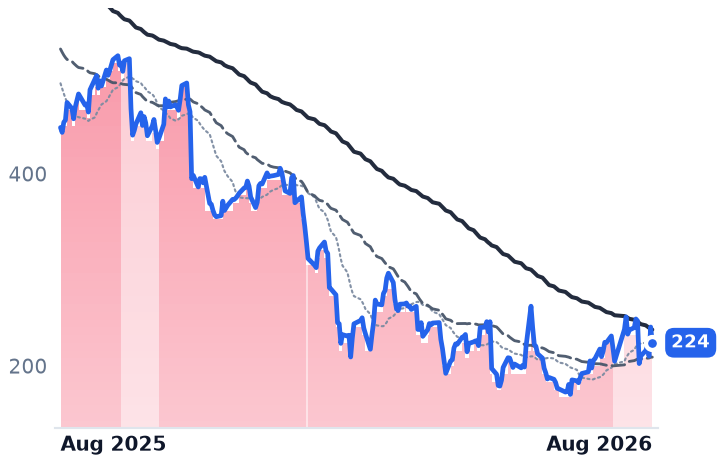
Salesforce is the divergence. Growth has accelerated three quarters running — 8.6%, then 12.1%, then 13.3% — operating margin widened to 21.8% from 19.8%, and net income rose 36.7%. It trades at 13.86x forward earnings against 22.63x trailing, on a 9.12% free-cash-flow yield. It is down 15.9% over twelve months and is the only one of the nine whose 50-day average is still below its 200-day.
The setup
Where it stands — Atlassian's gross-profit multiple is 58% higher than three weeks ago while management guides next year's revenue growth to halve. Would confirm — Subscription annual recurring revenue growth holding near 18% next quarter as Data Center license revenue rolls off. Would invalidate — Fiscal 2027 revenue guidance trimmed below 13%, or cloud revenue growth slipping under 25%. Watch next — Veeva reports 26 August; Atlassian's first fiscal-2027 quarter lands in late October. Valuation — 26.67x forward earnings and 6.85x forward gross profit against 7.64x trailing; no meaningful trailing multiple on a GAAP loss.