

Freight Core Still Grinding Higher; Telecom Drag Masks the Real Story
Hypothesis Opus 5 · Research Sonnet 5 · Writing Sonnet 5 · Prompt v1.0
The watchlist's 17-name logistics/telecom bucket looks flat over 30 days, but that's an illusion: the 9-name freight core (rails, LTL, truckload/leasing) is uniformly in bull bands with strongly bullish streaks clustering since mid-April, while collapsing telecom names CCOI and TMUS are dragging the blended average down. Rail intermodal records, six straight months of positive truck tonnage, and driver-supply tightening from CDL enforcement support a genuine but capacity-led (not demand-led) freight cycle turn.
| Ticker | Company | Segment | Trend · 13mo | 30D | 1Y |
|---|---|---|---|---|---|
UNP | Union Pacific | Class I Railroads | 🟢 Cont. Bull | +8.0% | +30.7% |
NSC | Norfolk Southern | Class I Railroads | 🟢 Cont. Bull | +7.0% | +20.0% |
CSX | CSX | Class I Railroads | 🟢 Cont. Bull | +5.9% | +43.9% |
ODFL | Old Dominion Freight Line | Less-Than-Truckload (LTL) | 🌱 Emerging Bull | +3.0% | +38.4% |
SAIA | Saia | Less-Than-Truckload (LTL) | 🟢 Cont. Bull | −3.7% | +26.8% |
XPO | XPO Logistics | Truckload & LTL | 🟢 Cont. Bull | −0.7% | +50.8% |
JBHT | J.B. Hunt Transport Services | Truckload & LTL | 🟢 Cont. Bull | −3.6% | +88.5% |
WSC | WillScot | Modular & Portable Storage | 🌱 Emerging Bull | −10.5% | −17.9% |
R | Ryder System | Vehicle & Truck Rental | 🟢 Cont. Bull | −1.7% | +44.5% |
CCOI | Cogent Communications | Technology & Services | 🔴 Cont. Bear | −1.4% | −71.9% |
CGNX | Cognex | Precision Motion & Sensors | 🟢 Cont. Bull | −11.7% | +75.3% |
IRDM | Iridium Communications | Specialty & Small Carriers | 🌱 Emerging Bull | −16.8% | +82.0% |
ROK | Rockwell Automation | Industrial Automation & Controls | 🟢 Cont. Bull | −2.3% | +33.8% |
SYM | Symbotic | Industrial Automation & Controls | ⚠️ Emerging Bear | +0.5% | −20.2% |
T | AT&T | Wireless Carriers | ⚠️ Emerging Bear | +13.0% | −7.7% |
TMUS | T-Mobile US | Wireless Carriers | 🔴 Cont. Bear | +4.8% | −22.4% |
VZ | Verizon Communications | Wireless Carriers | 🟢 Cont. Bull | +9.3% | +19.5% |
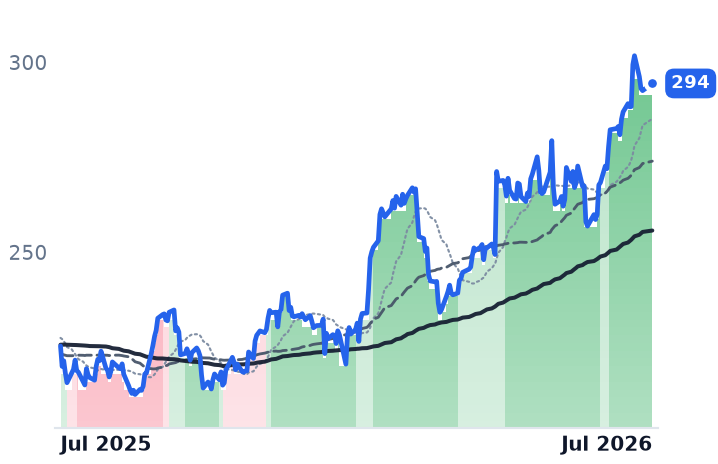
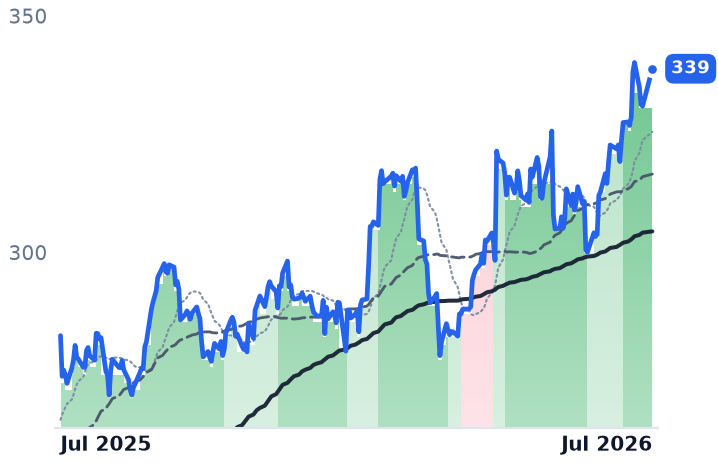
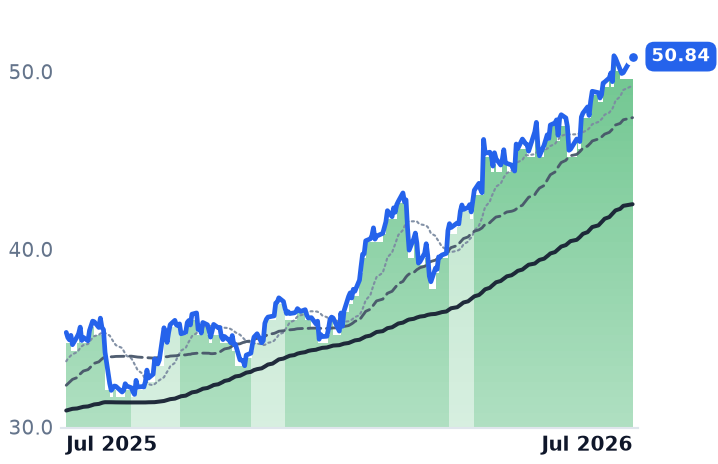
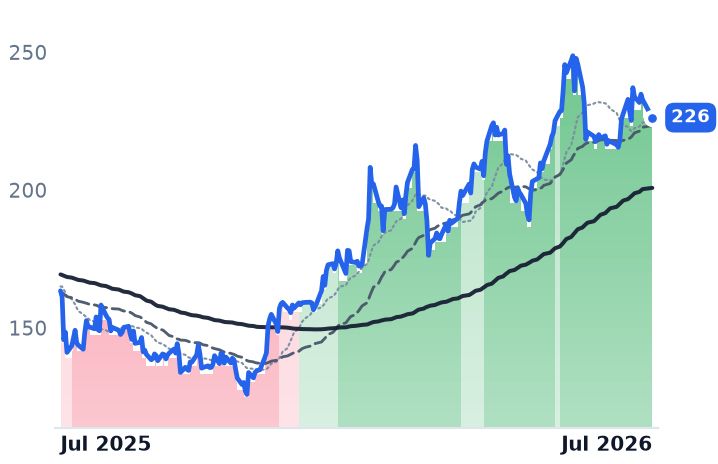
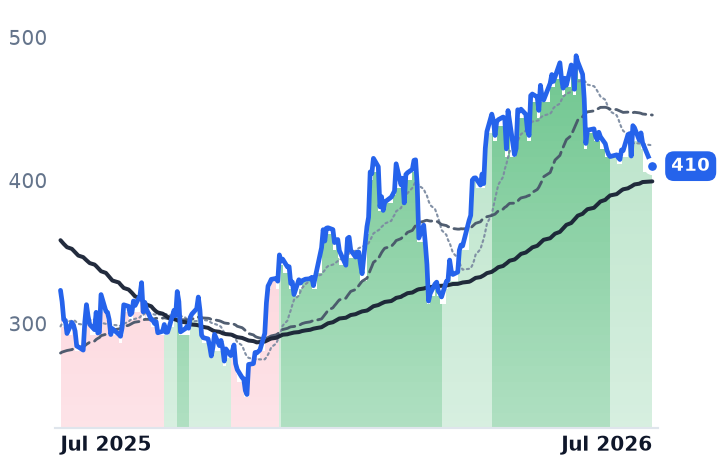
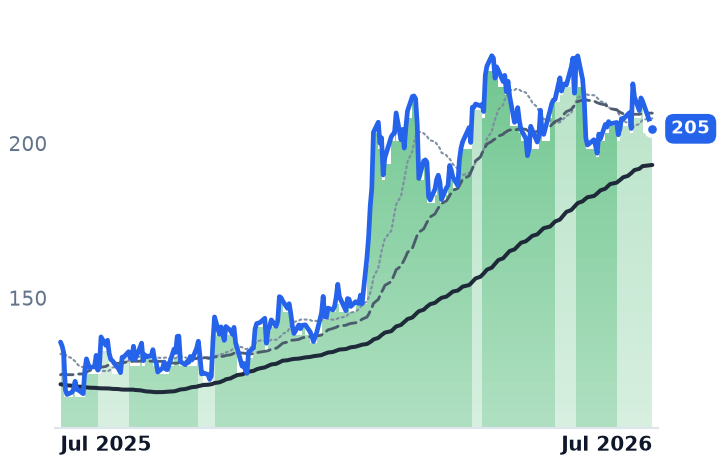
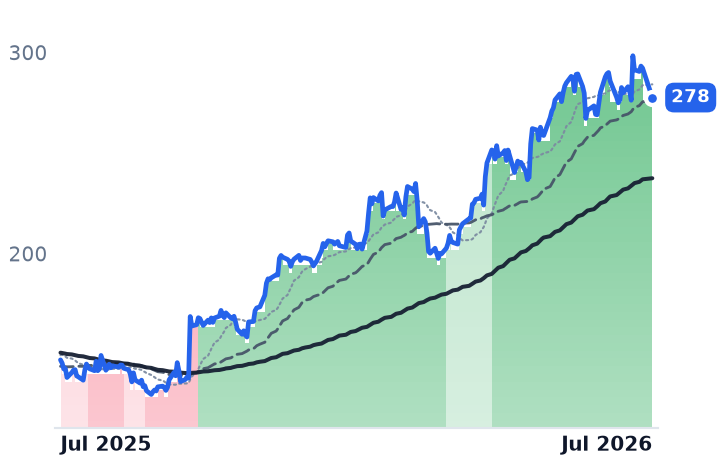
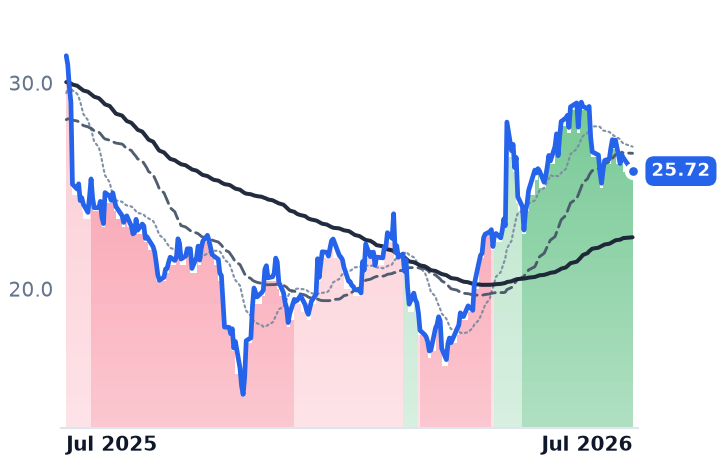
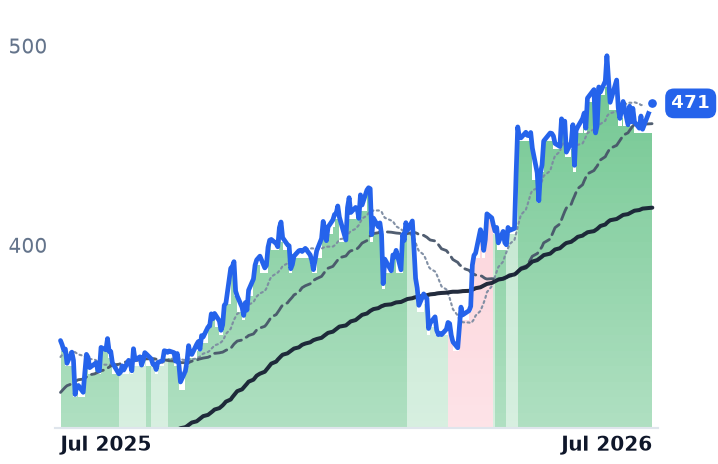
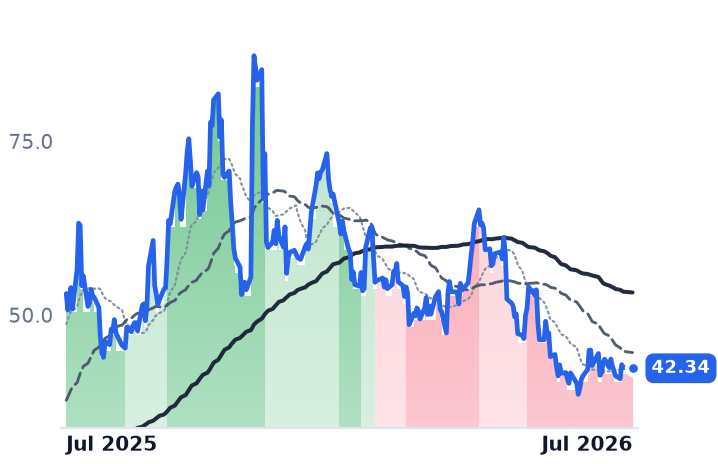
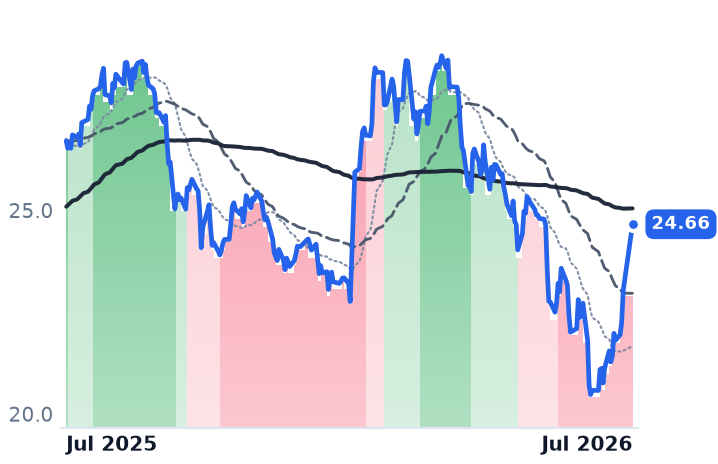
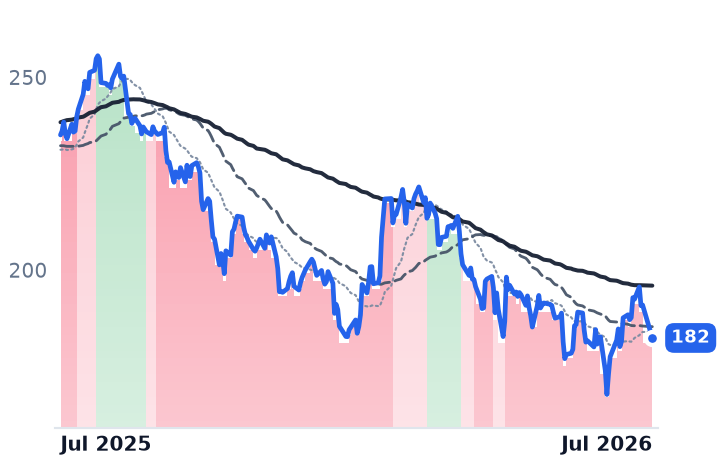
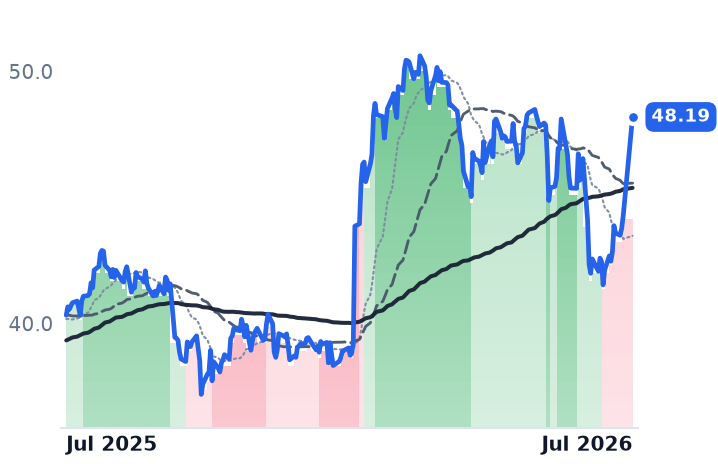
12-month price & trend
| Ticker | Mkt cap | P/E | P/E fwd | P/S | P/S fwd | P/GP | P/GP fwd | EV/EBITDA | FCF yld |
|---|---|---|---|---|---|---|---|---|---|
UNP | $174.5B | 23.7x | 22.5x | 6.9x | 6.5x | 15.1x | 14.3x | 15.3x | 3.7% |
NSC | $75.1B | 28.5x | 26.0x | 6.0x | 5.7x | 11.2x | 10.6x | 16.7x | 5.1% |
CSX | $92.9B | 29.0x | 25.0x | 6.4x | 6.1x | 11.7x | 11.1x | 16.6x | 5.4% |
| Ticker | Mkt cap | P/E | P/E fwd | P/S | P/S fwd | P/GP | P/GP fwd | EV/EBITDA | FCF yld |
|---|---|---|---|---|---|---|---|---|---|
ODFL | $43.9B | 40.6x | 36.3x | 7.8x | 7.4x | 24.7x | 23.5x | 24.0x | 2.5% |
SAIA | $10.3B | 37.0x | 33.8x | 3.0x | 2.8x | 18.8x | 17.6x | 16.5x | 2.5% |
XPO | $24.7B | 61.5x | 39.3x | 2.9x | 2.7x | 22.6x | 21.5x | 22.1x | 2.4% |
| Ticker | Mkt cap | P/E | P/E fwd | P/S | P/S fwd | P/GP | P/GP fwd | EV/EBITDA | FCF yld |
|---|---|---|---|---|---|---|---|---|---|
JBHT | $26.3B | 39.7x | 35.7x | 2.1x | 1.9x | 12.7x | 11.8x | 16.7x | 4.2% |
WSC | $4.3B | n/m | 21.9x | 1.9x | 1.9x | 3.9x | 3.9x | 22.6x | 12.5% |
R | $10.1B | 21.4x | 18.0x | 0.8x | 0.8x | 4.2x | 4.0x | 7.1x | 6.8% |
| Ticker | Mkt cap | P/E | P/E fwd | P/S | P/S fwd | P/GP | P/GP fwd | EV/EBITDA | FCF yld |
|---|---|---|---|---|---|---|---|---|---|
CCOI | $566.4M | n/m | — | 0.5x | 0.6x | 1.1x | 1.4x | 7.9x | -25.2% |
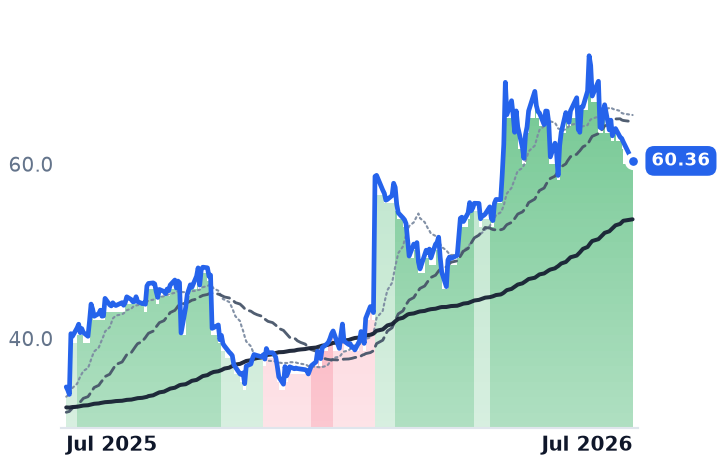
CGNX | $11.1B | 63.4x | 44.5x | 10.2x | 10.0x | 14.8x | 14.5x | 38.9x | 2.4% |
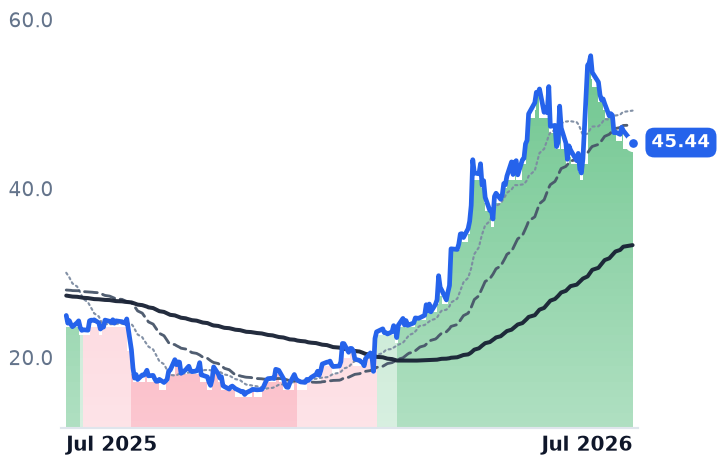
IRDM | $5.3B | 57.0x | 48.9x | 6.0x | 5.8x | 8.5x | 8.2x | 16.3x | 5.4% |
| Ticker | Mkt cap | P/E | P/E fwd | P/S | P/S fwd | P/GP | P/GP fwd | EV/EBITDA | FCF yld |
|---|---|---|---|---|---|---|---|---|---|
ROK | $49.5B | 41.6x | 33.7x | 5.5x | 5.5x | 10.1x | 10.0x | 29.6x | 3.0% |
SYM | $27.2B | 442.1x | 77.9x | 10.3x | 9.7x | 47.6x | 44.9x | 420.0x | 2.7% |
T | $170.5B | 8.2x | 10.6x | 1.3x | 1.3x | 2.2x | 2.2x | 5.9x | 10.4% |
| Ticker | Mkt cap | P/E | P/E fwd | P/S | P/S fwd | P/GP | P/GP fwd | EV/EBITDA | FCF yld |
|---|---|---|---|---|---|---|---|---|---|
TMUS | $195.9B | 19.1x | 16.7x | 2.1x | 2.1x | 3.9x | 3.8x | 10.9x | 7.8% |
VZ | $202.4B | 12.6x | 9.7x | 1.5x | 1.4x | 2.5x | 2.4x | 8.1x | 10.6% |
Consensus projections
| Ticker | FY2026E | FY2027E | FY2028E | |
|---|---|---|---|---|
UNP | Revenue | +9.0% | +4.4% | +9.3% |
| EPS | +11.6% | +8.5% | +10.8% | |
NSC | Revenue | +8.0% | +4.3% | +4.5% |
| EPS | +7.1% | +11.0% | +9.7% | |
CSX | Revenue | +7.5% | +5.0% | +3.7% |
| EPS | +22.5% | +13.3% | +10.5% | |
ODFL | Revenue | +7.5% | +7.8% | +8.7% |
| EPS | +21.0% | +14.2% | +15.3% | |
SAIA | Revenue | +12.1% | +7.7% | +8.1% |
| EPS | +22.0% | +25.4% | +20.2% | |
XPO | Revenue | +11.3% | +5.2% | +6.8% |
| EPS | +48.8% | +19.1% | +21.1% | |
JBHT | Revenue | +13.9% | +9.2% | +7.8% |
| EPS | +29.6% | +29.6% | +19.3% | |
WSC | Revenue | −0.0% | +3.3% | +4.9% |
| EPS | −3.3% | +22.3% | +34.3% | |
R | Revenue | +6.5% | +6.1% | +5.9% |
| EPS | +13.9% | +20.8% | +18.6% | |
CCOI | Revenue | −1.6% | +4.5% | +6.4% |
| EPS | −11.7% | −21.4% | −23.5% | |
CGNX | Revenue | +13.2% | +8.9% | +10.4% |
| EPS | +55.4% | +20.7% | +22.8% | |
IRDM | Revenue | +4.5% | +4.9% | +9.7% |
| EPS | −4.2% | +33.5% | +20.3% | |
ROK | Revenue | +9.9% | +5.5% | +6.3% |
| EPS | +31.2% | +12.2% | +11.9% | |
SYM | Revenue | +25.7% | +29.1% | +23.6% |
| EPS | +123.9% | +54.0% | −2.4% | |
T | Revenue | +3.4% | +2.1% | +2.1% |
| EPS | +13.6% | +9.4% | +13.7% | |
TMUS | Revenue | +7.1% | +4.4% | +4.0% |
| EPS | +10.2% | +27.4% | +20.0% | |
VZ | Revenue | +2.3% | +1.7% | +1.1% |
| EPS | +6.8% | +4.7% | +7.1% |
Forward fiscal years only. Blank means no analyst coverage for that year.
The bifurcation hiding in the blended average
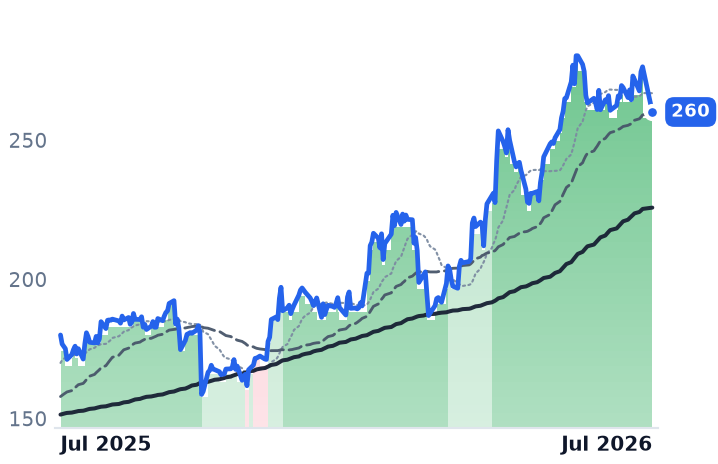
The "Data Center: Logistics, Telecom & Adjacent" bucket's flat 30-day return conceals two very different stories. The 9-name freight core — rails UNP, NSC, CSX; LTL players ODFL, SAIA, XPO; and truckload/leasing names JBHT, R, WSC — sits uniformly in mildly bullish or strongly bullish bands as of July 28, with no member downgraded to a bear band in the trailing 30 days. Strongly bullish streaks for CSX, JBHT, ODFL and NSC all began within a tight mid-to-late-April window (CSX on April 17, JBHT on April 20, ODFL on April 15, NSC re-entering on April 28 after a brief whipsaw), pointing to a genuine cohort inflection rather than a handful of names carrying a mixed group. Over the past 30 days, UNP is up 9.7%, NSC up 8.3%, and CSX up 6.7%, even as JBHT, SAIA and WSC have pulled back modestly.
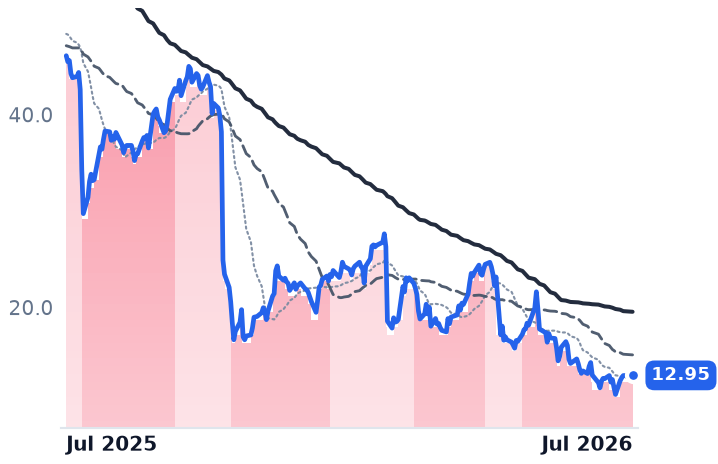
The drag comes from the bucket's non-freight legs. CCOI and SYM sit in strongly bearish bands, alongside T and TMUS, with VZ in mildly bearish. CCOI alone is down roughly 73% over the trailing year following Q4 2025 and Q1 2026 revenue misses, a dividend cut, and net leverage above 8x, far worse than anything in the freight names. That single collapse, not a freight rollover, is what flattens the headline 30-day average.
What the freight data actually shows
The fundamentals lean toward a real, capacity-driven cycle turn. Rail volumes hit record weekly intermodal levels in June, up 11.7% year-over-year, with Q2 carloads up 2.3%. The ATA tonnage index posted its sixth straight month of annual growth in May, and spot truckload rates are up roughly 31% year-over-year with tender rejections near 13%, the tightest capacity signal since early 2022. That tightness traces partly to English-proficiency and CDL enforcement actions that have sidelined roughly 20,000 drivers and revoked ~28,000 licenses, a supply-side shock rather than a demand boom.
The picture is uneven, though. Cass freight expenditures rose 11.2% in June, but the shipments component fell 4.1% year-over-year, meaning much of the gain is pricing, not volume. LTL is split the same way: Saia's tonnage per workday rose as much as 8.4% in May on genuine share gains, while Old Dominion's tons per day still declined year-over-year even as yield rose 5.4%. And the UNP-NSC deal remains a slow-moving regulatory process — the STB accepted the revised application in May with supplemental filings still underway and no close expected before 2027 — so it isn't a near-term price catalyst.
The freight core's bull streak looks real and broad-based rather than a merger-arb sideshow, but it's a capacity-tightening story more than a volume boom, and the bucket's blended optics are being distorted by unrelated telecom weakness.