

PPL's 31.8 GW Data-Center Pipeline Narrows to 11 GW Signed and 2 GW of Load by 2031
Hypothesis Opus 5 · Research Opus 5 · Writing Opus 5 · Prompt v1.6
A utility's interconnection queue is not its order book, and PPL has now published the arithmetic showing what is lost in between. Of the advanced-stage Pennsylvania data-center pipeline it disclosed in August, more than 11 gigawatts carries signed electric service agreements, and management expects roughly 2 gigawatts to be drawing power by 2031 — about 6% of the headline figure reaching the meter. Exelon made the same cut on its own queue, keeping only the gigawatts backed by cash collateral.
The operating business is fine: June-quarter operating income rose 17%, and regulators in both Pennsylvania and Kentucky granted increases this year. The cost of building the rate base is the open question. PPL priced $1bn of equity units in February paying 7.00% a year, against the 9.775% return Kentucky allows it to earn — under three points of spread before regulatory lag.
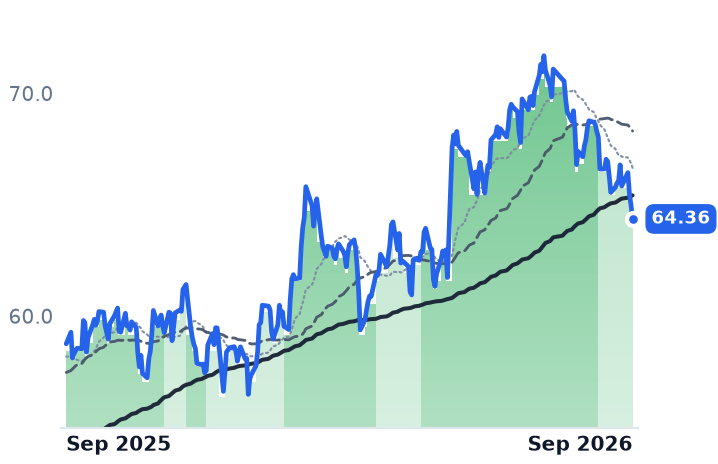
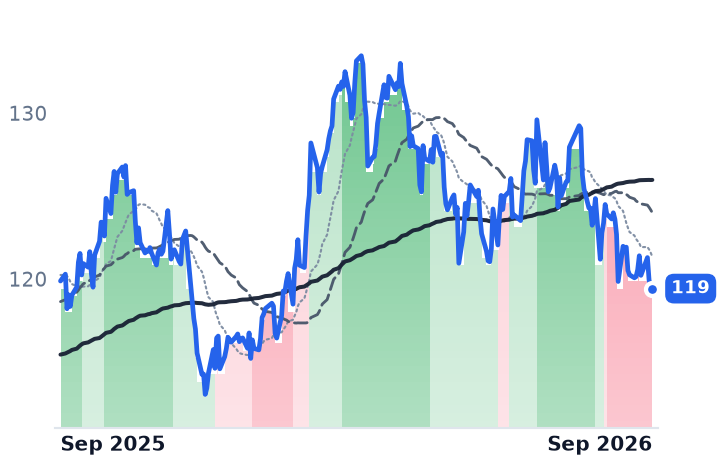
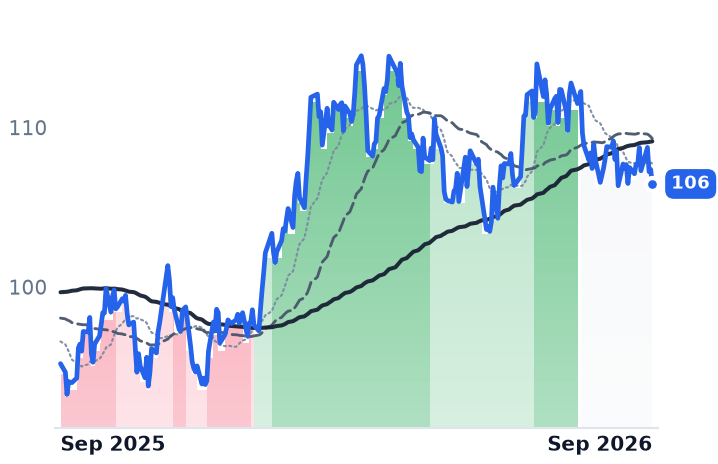
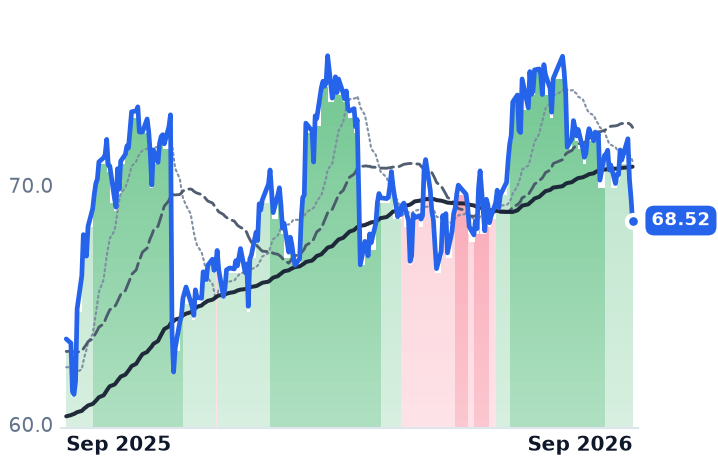
| Ticker | Company | Segment | Trend · 13mo | 30D | 1Y |
|---|---|---|---|---|---|
| The subject · what this brief is about | |||||
PPL | PPL | Transmission & Distribution Only | ⚠️ Emerging Bear | −4.4% | −4.3% |
NGG | National Grid | Transmission & Distribution Only | ⚠️ Emerging Bear | −5.1% | +8.9% |
| Compared against · context, not the story | |||||
EXC | Exelon | Vertically Integrated Utilities | ⚠️ Emerging Bear | −5.0% | +1.2% |
AEP | American Electric Power | Vertically Integrated Utilities | ⚠️ Emerging Bear | −1.4% | +14.5% |
D | Dominion Energy | Vertically Integrated Utilities | 🟢 Cont. Bull | −6.0% | +9.5% |
DUK | Duke Energy | Vertically Integrated Utilities | ⚠️ Emerging Bear | −4.1% | −0.4% |
ED | Consolidated Edison | Vertically Integrated Utilities | 🟢 Cont. Bull | −1.5% | +11.8% |
ES | Eversource Energy | Vertically Integrated Utilities | 🟢 Cont. Bull | −4.9% | +7.8% |
NEE | NextEra Energy | Vertically Integrated Utilities | ⚠️ Emerging Bear | −4.3% | +16.5% |
PEG | Public Service Enterprise Group Incorporated | Vertically Integrated Utilities | ⚠️ Emerging Bear | −4.4% | −11.0% |
SO | The Southern | Vertically Integrated Utilities | ⚠️ Emerging Bear | −5.9% | −4.0% |
WEC | WEC Energy | Vertically Integrated Utilities | ⚠️ Emerging Bear | −4.3% | −3.1% |
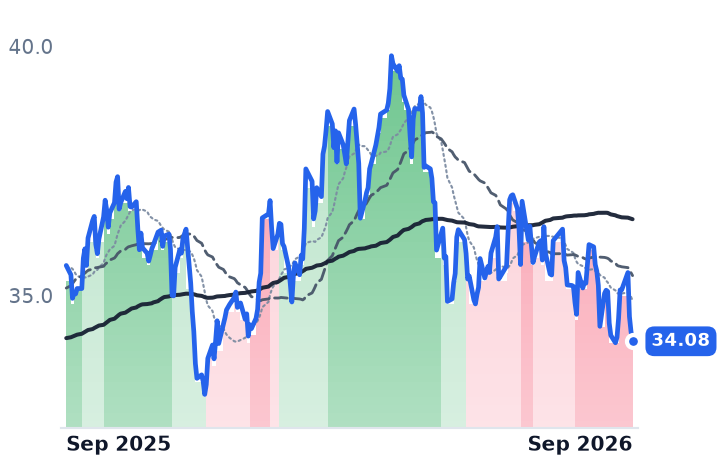
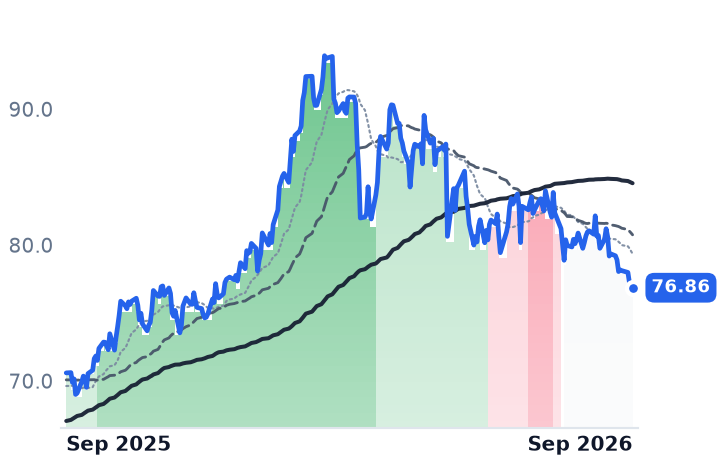
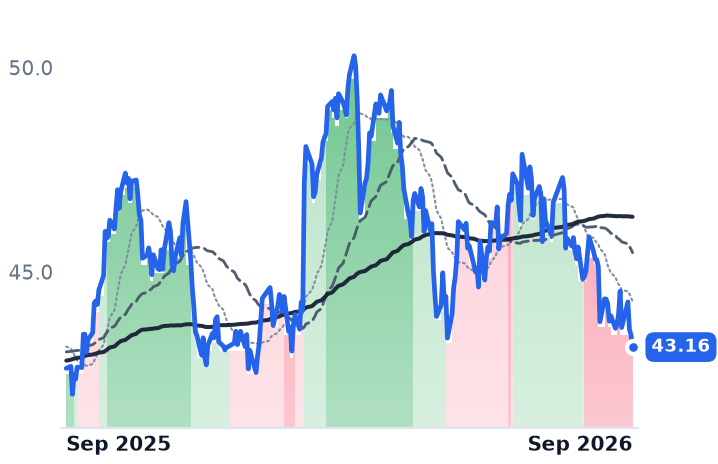
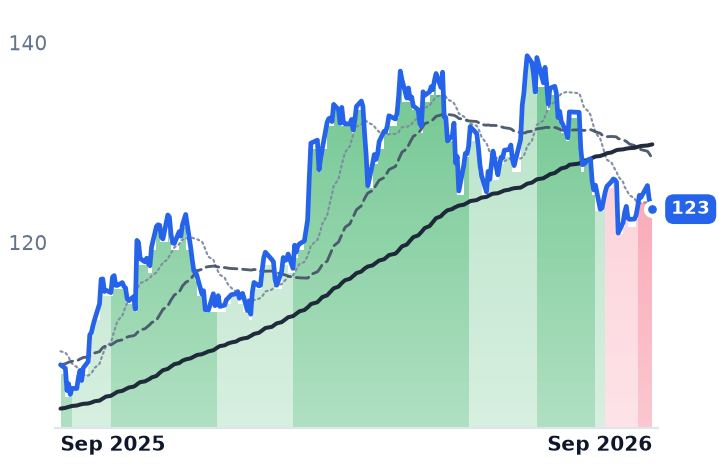
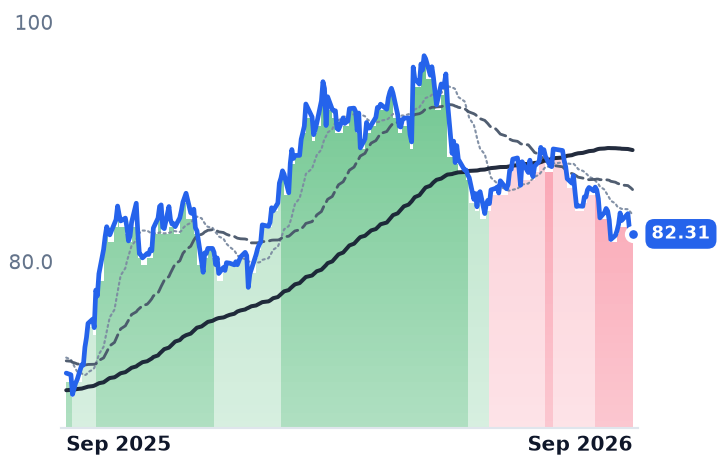
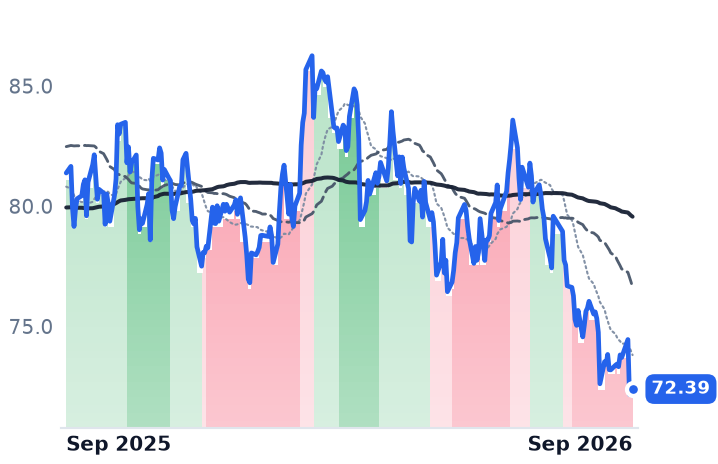
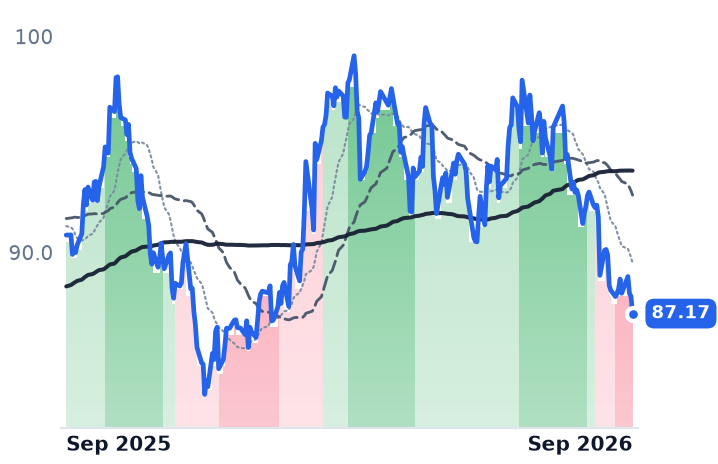
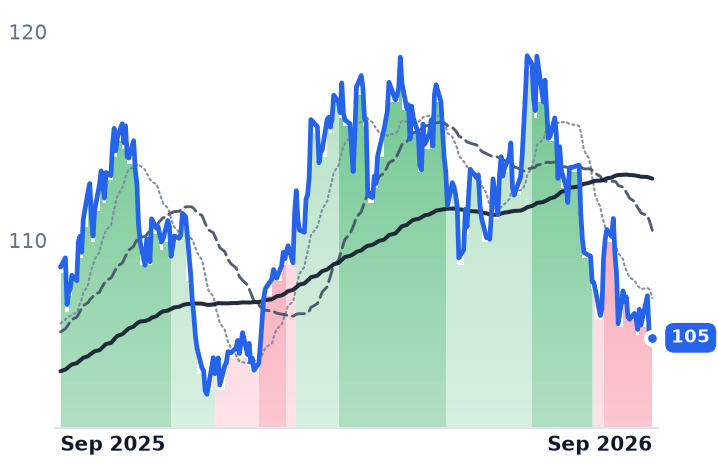
12-month price & trend
| Ticker | Mkt cap | P/E | P/E fwd | P/S | P/S fwd | P/GP | P/GP fwd | EV/EBITDA | FCF yld |
|---|---|---|---|---|---|---|---|---|---|
PPL | $25.6B | 27.1x | 17.5x | 3.6x | 2.6x | 10.5x | 7.6x | 13.7x | 1.0% |
NGG | $77.3B | 17.1x | 16.8x | 3.2x | 3.9x | 5.1x | 6.1x | 13.3x | -6.6% |
EXC | $44.5B | 15.8x | 15.1x | 1.8x | 1.7x | 7.2x | 7.1x | 10.5x | -4.3% |
| Ticker | Mkt cap | P/E | P/E fwd | P/S | P/S fwd | P/GP | P/GP fwd | EV/EBITDA | FCF yld |
|---|---|---|---|---|---|---|---|---|---|
AEP | $67.8B | 21.4x | 19.5x | 3.0x | 2.9x | 6.1x | 5.9x | 14.1x | 13.2% |
D | $57.4B | 22.6x | 18.2x | 3.1x | 3.1x | 6.4x | 6.4x | 15.0x | -11.9% |
DUK | $93.7B | 18.1x | 17.9x | 2.8x | 2.8x | 4.1x | 4.1x | 11.4x | 1.6% |
| Ticker | Mkt cap | P/E | P/E fwd | P/S | P/S fwd | P/GP | P/GP fwd | EV/EBITDA | FCF yld |
|---|---|---|---|---|---|---|---|---|---|
ED | $38.8B | 17.7x | 17.3x | 2.3x | 2.2x | 3.5x | 3.4x | 9.4x | 7.2% |
ES | $25.3B | 14.4x | 14.4x | 1.8x | 1.9x | 4.5x | 4.7x | 10.2x | 0.9% |
NEE | $172.8B | 18.5x | 20.6x | 6.0x | 5.6x | 8.3x | 7.8x | 15.8x | -5.9% |
| Ticker | Mkt cap | P/E | P/E fwd | P/S | P/S fwd | P/GP | P/GP fwd | EV/EBITDA | FCF yld |
|---|---|---|---|---|---|---|---|---|---|
PEG | $37.7B | 18.7x | 17.3x | 3.0x | 3.0x | 3.5x | 3.5x | 14.2x | 5.3% |
SO | $106.6B | 22.2x | 20.2x | 3.5x | 3.5x | 8.1x | 8.0x | 12.7x | 2.4% |
WEC | $35.6B | 21.7x | 19.5x | 3.5x | 3.5x | 6.3x | 6.3x | 14.3x | -3.1% |
Consensus projections
| Ticker | FY2026E | FY2027E | FY2028E | |
|---|---|---|---|---|
PPL | Revenue | +10.9% | +5.8% | +5.4% |
| EPS | +7.7% | +8.7% | +8.5% | |
NGG | Revenue | −6.3% | +0.4% | +9.1% |
| EPS | +8.9% | +14.8% | +8.9% | |
EXC | Revenue | +5.1% | +2.9% | +3.4% |
| EPS | +5.5% | +6.3% | +7.3% | |
AEP | Revenue | +9.5% | +5.9% | +7.6% |
| EPS | +7.9% | +7.6% | +10.6% | |
D | Revenue | +13.7% | +6.5% | +5.8% |
| EPS | +5.0% | +6.3% | +7.0% | |
DUK | Revenue | +5.8% | +4.6% | +4.2% |
| EPS | +6.3% | +6.9% | +7.0% | |
ED | Revenue | +6.9% | +4.2% | +3.9% |
| EPS | +7.3% | +6.2% | +6.5% | |
ES | Revenue | +4.6% | +3.5% | +6.6% |
| EPS | −1.4% | +5.6% | +6.2% | |
NEE | Revenue | +9.4% | +9.7% | +8.9% |
| EPS | +9.0% | +9.0% | +8.5% | |
PEG | Revenue | +6.5% | +3.5% | +4.9% |
| EPS | +8.1% | +7.0% | +7.7% | |
SO | Revenue | +7.7% | +5.5% | +6.1% |
| EPS | +6.8% | +7.5% | +9.2% | |
WEC | Revenue | +8.0% | +5.0% | +7.5% |
| EPS | +6.6% | +7.2% | +8.2% |
Forward fiscal years only. Blank means no analyst coverage for that year.
PPL told investors on August 7 that the advanced-stage data-center pipeline at its Pennsylvania utility had reached 31.8 gigawatts, its tenth consecutive quarterly increase. The same disclosure carried the number that decides what any of it is worth: a little over 11 gigawatts is covered by signed electric service agreements, with more than 6.5 gigawatts under construction, and the load management expects to be actually ramped by 2031 is roughly 2 gigawatts.
PPL, which delivers electricity and gas to about 3.6 million customers in Pennsylvania, Kentucky and Rhode Island, is paid for capital rather than for electrons. Its profit is an allowed return on a rate base a regulator has agreed to let it recover, so a gigawatt sitting in an interconnection queue earns nothing until wires are built and rolled into rates. The distance between the advertised queue and the signed, building, ramping load is the distance between a growth story and a capital bill that has to be paid up front — and this year PPL agreed to pay 7% for part of it.
What actually converts
Kentucky shows the funnel at smaller scale. PPL's economic-development pipeline there grew to 13.7 gigawatts, 11.6 of it data centers, while signed reimbursement agreements totalled 1.3 gigawatts, up from 900 megawatts a quarter earlier; the company's own probability-weighted expectation is 3.7 gigawatts of new load by 2032. What is signed is contractually hard: the Pennsylvania large-load tariff requires ten-year minimum terms, at least 80% guaranteed capacity payments and material termination fees.
Exelon, the purest wires-only comparable in the group since it spun off Constellation, made the same cut explicit on its July 30 call, trimming its pipeline from 43 to 36 gigawatts, of which 4 gigawatts carries signed transmission security agreements backed by $1bn of collateral and 25 gigawatts remains under study. Its $41bn capital plan through 2029 was left unchanged — confirmation that no speculative load was ever in the spending. Exelon trades at 15.1x forward earnings and 1.49x book.
What the capital costs
PPL reiterated a $23bn plan through 2029 aimed at rate-base growth above 10% a year, funded roughly half from operating cash flow net of dividends, about 40% from utility debt and some $3bn from equity, around $2bn of it still to be issued. On February 23 it priced $1bn of equity units paying total distributions of 7.00% a year, settling into stock by February 2029 at a $37.2606 reference price — above the $34.08 close. Kentucky regulators, meanwhile, set the allowed return on equity at 9.775%, below the 9.90% requested, and declined the proposed earnings-sharing mechanism. Diluted shares are already up 2.0% year over year, and trailing free-cash-flow yield is 1.02%.
The regulatory news was otherwise good. Pennsylvania approved a $275m annual distribution increase effective July 1, the first since 2016, alongside $233m granted in Kentucky. June-quarter operating income rose 17.0% on revenue up 4.2%, margin widening to 22.5%, and guidance of $1.90–$1.98 was reaffirmed. The shares are down 9.5% over six months and trade at 17.5x that guidance midpoint and 2.30x book.
The same model, a different regulator
National Grid is the wires-and-pipes version with no generation at all, and its numbers rhyme. Ofgem's December 4 final determination set a real allowed cost of equity of 6.12% to March 2031 and lifted the baseline spending allowance to £4.9bn, still 14% short of the £5.7bn requested. The company accepted on March 2 and committed to at least £70bn of investment. "National Grid is embarking on the largest investment programme in our history," chief executive Zoë Yujnovich said on May 14. Underlying earnings per share rose 8% at constant currency and assets grew 10.9%, but net debt rose 7% to £44.2bn and free cash outflow widened to £2.1bn; the share count is 23% higher than two years ago after the 2024 rights issue. The American depositary shares, down 14.3% in six months to 1.43x book, have given back the entire re-rating they gained between the Ofgem ruling and its acceptance.
The verdict
Most of both declines is not about data centers. Twelve US regulated electrics fell a median of roughly 3.6% over the past thirty days, Southern and Dominion worse than either of these two, with the 30-year Treasury at 5.36% and the 30-year gilt at 5.89% on September 1, its highest since March 1998 — a discount rate that competes directly with National Grid's 6.12% allowed real return. That is duration being repriced across a whole sector, and the operating results at both companies argue against reading it as demand doubt.
What is company-specific is narrower and sharper. PPL remains the most expensive of these three per dollar of book equity while funding rate-base growth with 7% money against a sub-10% allowed return, and while its headline gigawatt number converts to ramped load at about one part in sixteen. It is also not purely a wires business: it owns Kentucky generation, is expected to file for a further $3.5–4bn of it, and holds 51% of Invitium Energy, a Blackstone venture with more than 5 gigawatts of gas turbines in the PJM queue — capital outside the rate base, earning no allowed return before 2030.
The February equity units settle into stock in 2029 whatever the queue looks like then. The capital goes in now; the load has five more years to show up.